II 章
分担研究報告
平成 26 年度厚生労働科学研究費補助金(地球規模保健課題推進研究事業)
「エビデンスに基づく日本の保健医療制度の実証的分析」(H26‑地球規模‑一般‑001)
平成26年度分担研究報告書
研究代表者・渋谷健司
東京大学 医学系研究科 国際保健政策学教室 教授
Context and future challenges in Japan s health system
研究分担者 ミジャヌール・ラハマン 東京大学 国際保健政策学 特任研究員 ギルモー・スチュアート 東京大学 国際保健政策学 助教 渋谷健司 東京大学 国際保健政策学 教授
研究要旨
Japan has experienced remarkable improvements in health over the past 50 years, which occurred in the context of the introduction of a universal health coverage system based on affordability, equity and high coverage. However, in the past 30 years, as Japan passes through the epidemiological transition, new challenges have arisen that require changes to the organization, governance and perspective of the health system.
At the same time, Japan has undergone major demographic changes leading to an aging society with growing elderly population, and economic stagnation have restricted the fiscal space available for UHC as well as created new economic strains. This report describes the challenges Japan s health system faces in the context of these changes, and outlines some of the future policy reform problems that the Japanese government will face.
A.研究目的
Japan is the world’s third largest economy, with a correspondingly high standard of living, levels of development, safety, and stability.
Japan is a constitutional monarchy with a parliamentary system of government and is split into 47 prefectures spanning four main islands with many small archipelagoes. Tokyo, the capital, is one of the largest cities in the world and the country as a whole is highly urbanized. Japan’s population of 126 million people is ageing rapidly due to low birth rates and increased life expectancy. This has led to what some claim is an imminent demographic crisis.
Healthcare in Japan is centered around the National Health Insurance system which since its founding in 1958 has provided comprehensive coverage to all Japanese citizens. Thanks to its overall effectiveness and advances in technology, Japan has for many years enjoyed increases in life expectancy along with decreases in maternal and infant mortality. However, in recent decades incidence of lifestyle -elated diseases such as obesity and diabetes
has increased significantly. This rise, along with population ageing, is placing strain upon the national health system.
Coupled with over two decades of economic slowdown, Japan must now find policies that balance universal coverage, support for the elderly, and financial sustainability.
Understanding the economic and sociodemographic context for health in Japan is important to understand the policy challenges Japan faces and reforms that will be needed to maintain and improve its universal health coverage system. This report will describe this context and set out the future challenges facing the Japanese health system.
B.研究方法
Using available data from the Ministry of Health, Labor and Welfare, the cabinet office and published papers, this report summarizes the health context.
Data was obtained on economic changes, demographic trends and core health indicators for Japan and OECD countries for the period 1980 – 2012.
This data was summarized and
combined with data on the burden of specific diseases obtained from published research and the Global Burden of Disease project 2010. Finally, health behavior and risk factor prevalence data were obtained from published sources, and trends in risk factors analyzed for the Japanese population.
C.研究成績及び考察 C-1 Sociodemography
Because of the sharp decline in Japan’s birth rate, the shape of the population pyramid is no longer like an original pyramid (Figure 1). The two bulges of the pyramid represent two baby booms, with the first one occurring shortly after the Second World War (1947-1950) and the second one in the early 1970’s.
Japan has a large ageing population and will face an unprecedented ageing society when the first baby boomers (now over 55 years old) retire.
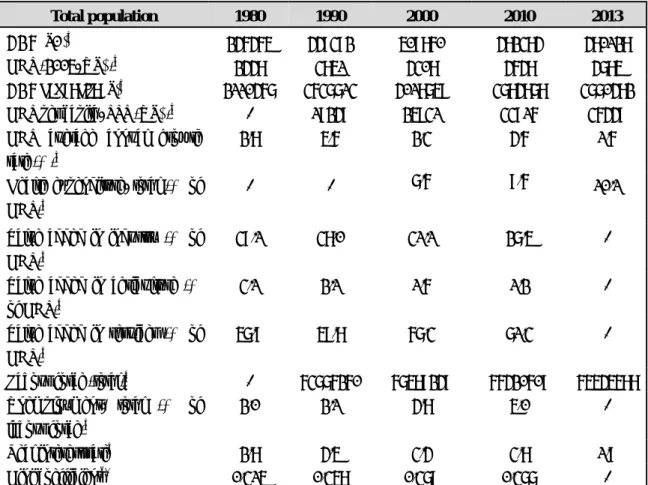
As shown in Table 1, the population in Japan has increased steadily from 117 million in 1980 to 128 million in 2010, followed by a declining trend 2013 (127 million). The proportion of the population aged 65 years and over was
almost double the proportion of 0-14 years olds in 2013. The proportion of the population aged 65 years and older increased from 9% in 1980 to 25% in 2013, while the proportion of the population aged 0-14 years fell from 23.5% to 12.9%. The total fertility rate was below the replacement level (2.0 children per women) for all years from 1980 to 2013. Thus, the annual population growth rate has decreased steadily and became negative in 2013.
The crude birth rate shows a decreasing trend over time (from 13.6 per 1000 population in 1980 to 8.2 in 2013), while there has been a consistent increase in life expectancy. Among the OECD countries, Japan had the lowest fertility rate along with highest mean maternal age at first birth (Sleebos 2003).
There are several reasons for the population decline in high-income countries like Japan: delayed marriage, an increasingly large unmarried population, changes in the housing environment and social customs, increasing numbers of women in the workforce, maternity and childcare leave, and rising costs of childbirth and
child-raising (Jones 2007; Morgan and Taylor 2006; Sleebos 2003). The age-dependency ratio, the number of people who are too young or too old to be in the labour force divided by the working-age population, increased from 48.4 in 1980 to 61.1 in 2013.
Urbanization is also taking place quite rapidly. In 1980, 23.8% of the population was rural but by 2013 this had declined to 7.5%.
C-2 Economic context
Japan is the world’s third largest economy by gross domestic product (GDP) and is a member of the G8.
Although in the immediate postwar period Japan’s GDP increased rapidly, the economic crisis of the 1990s growth caused several periods of stagnation and recession (Table 2). Value added by the service industry was 71.3% of GDP in 2010, representing a 4.0% rise from 2000 levels. However, the value added by industry fell by 3.6% to 27.5% of GDP in the same period, as did agriculture by 0.4% to 1.2% of GDP.
Historically Japan has had low levels of unemployment. However, since the
1990s the percentage of the labour force out of work has grown from 2.0% in 1990 to 5.0% by 2010 due to changing patterns of employment. This has been accompanied by a gradual shrinking of the total labor force population between 2000 and 2013 by 3.0%. The proportion of part-time and contingent workers has continued to grow in recent years and has increasingly been seen as a labour problem with serious social implications.
Gini coefficients quantifying income inequality declined (meaning income was distributed more equally) continuously from 1962 to 1981. In the 1980s and 1990s Japan’s Gini coefficient increased (showing higher income disparity) before reaching a peak in the 2000s. By 2010 the coefficient was 0.377, a slight decrease from the 2000 level of 0.379. Worries about the impact of increasing inequality on access and quality of healthcare are common.
C-3 Health status
Table 3 presents trends in life expectancy at birth and death rates from 1980 to 2012. Life expectancy has
increased rapidly over the past 50 years in Japan. The life expectancy at birth increased between 1980 and 2008 by 6.59 years for men and 7.65 years for women, reaching 79.9 years and 86.4 years, respectively. Healthy life expectancy, the expected years of life in self-perceived good health, was 72 years for men and 77 years for women in 2012. There has been a consistent improvement in mortality rates over the years, with the greatest improvement seen in age-adjusted mortality rates. The difference between life expectancy and healthy life expectancy shows the numbers of years an individual can be expected to live in poor health, which was 7.9 years for men and 10.4 years for women in 2012.
The crude mortality rate shows a gradual increase since 1980, reflecting population ageing.
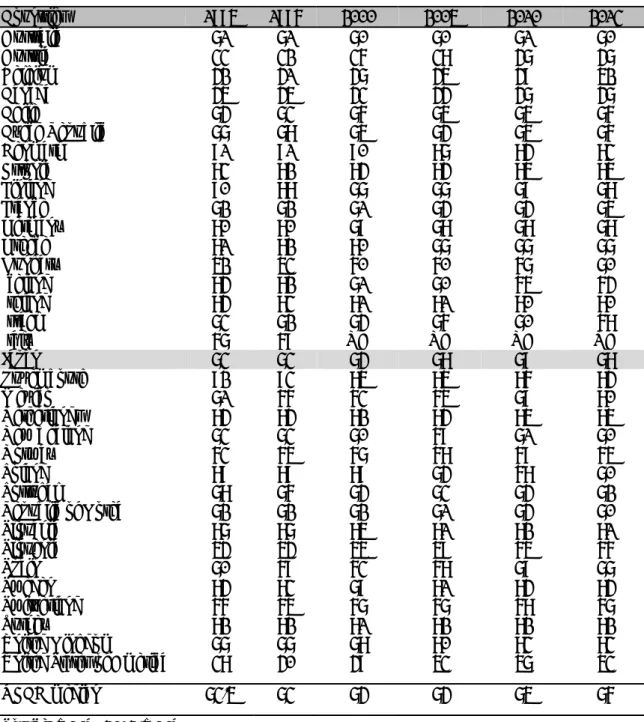
There have been rapid gains in life expectancy over the past 50 years in all OECD countries, as shown in Table 4.
Of the 11 high-income OECD countries, Japan has the highest life expectancy, at 86.4 years in 2012 and Japan also has the world’s longest life expectancy.
This relatively long life expectancy
position compared to other OECD countries has been sustained over time.
Among the other OECD countries, France has the second position followed by Italy and Korea. On the other hand, the lowest life expectancy among OECD countries was observed in Mexico, at 77 years. Maintaining healthy lifestyles, regular medical checkups, proper medical and long-term care, and healthy diets may contribute to long healthy life expectancy in Japan.(Horiuchi 2011; Ikeda et al.
2011)
C-4 Burden of diseases
Like many high-income countries, non-communicable diseases (NCDs) are now the leading causes of morbidity and mortality in Japan while the communicable diseases burden decreased substantially in the past five decades. The major diseases of cause death, disability, and burden during 1980 to 2010 are described below.
Table 5 shows the number and rate (per 100,000 population) of main causes of death in Japan by selected years.
Overall, NCD deaths increased rapidly from 1990 to 2010 compared to
communicable diseases.(Ikeda et al.
2011) Circulatory diseases, cancer, cerebrovascular and ischaemic heart diseases and chronic respiratory diseases have remained the leading killers during the past five decades in Japan. This trend has been increasing since 1980. However, transport accident-related death rates decreased almost 50% in the past five decades (11.4 deaths in 1980 and 5.1 deaths in 2012) and suicide deaths rates decreased slightly since 2000 (24.1 deaths in 2000, 23.4 in 2010 and 21.0 in 2012). Similar to Europe and other Western countries, breast cancer deaths tripled since 1980, making it becoming the second leading cause of death among cancer patients.
Infectious disease death rates, particularly tuberculosis, decreased sharply over this period.
Disability-adjusted life years (DALYs) are a health metric used for assessing the disease burden, which is defined as years of healthy life lost to both fatal and non-fatal disease (Murray et al.
2012). It is estimated by summing two components: years lost due to premature death (YLLs) and years
lived with disability (YLDs). Table 6 shows the number, rate, and percentage of DALYs by major disease categories.
Broadly for Japan, while gains are being achieved for cerebrovascular diseases, and also for transport-related injury and suicide, for many of the major causes of disease burden the overall burden has increased over the past two decades. The improvements were largely achieved by death rate reduction particularly infectious diseases deaths. Conversely, overall an increase in DALY burden across many conditions is primarily associated with an increasing disability.
In 2010, NCDs contributed 26 million (or 83%) of total DALYs, while communicable including maternal, neonatal and nutritional disorders contributed two million (7%) and injuries three million DALYs (10%). A slight increasing trend of DALYs was observed for all categories of diseases over the past 20 years. Population ageing, high prevalence of hypertension, increasing risk from NCDs, and lower levels of physical activity may be responsible for this increase in DALYs in Japan (Tanaka 2012).
Another measure of disease burden is years of life lost (YLLs), which are calculated by summing the total number of years of life lost due to death and multiplying the number of deaths by a standard life expectancy.(Murray et al. 2012) Figure 2 presents the change in the top 15 leading causes of YLLs due to premature death from 1990 (left panel graph) and 2010 (right panel graph) in Japan. The top five leading causes of YLLs in Japan are dietary risks, high blood pressure, tobacco smoking, ambient particulate matter pollution, and alcohol consumption from 1990 to 2010.
Dietary risks, high blood pressure, and tobacco use accounted for around 50%
of YLLs in 1990 and 2010. Stable values in YLLs may be due to increasing prevalence of hypertension among the Japanese adult population.
C-5 Risk factors
Diabetes and hypertension are two major chronic diseases in Japan and have become a major public health concern among all OECD countries.
The age-standardized prevalence of diabetes was 9.7% for men and 6.1% for
women in 2010. Between 1980 and 2010, the prevalence of diabetes increased nearly three-fold in men and twice in women. Japan is among the top 10 countries for the largest number of adults living with diabetes in the world (International Diabetes Federation 2015). The reason for this striking increase in diabetes among Japanese is not clear (Ministry of Health 2007), but low dietary fiber intake and high glycemic index could associated with this increase, in view of the preference of Japanese people for highly refined rice and bread as their main staples (Sasaki 1964).
Hypertension is another major chronic disease, acknowledged as one of the established risk factors for stroke and cardiovascular diseases in Japan.
Japan has one of the highest prevalences of hypertension in the OECD, at 57.6% for men and 42.2% for women in 2010. Lowering sodium intake is strongly recommended and salt intake has been identified as a strong risk factor for hypertension in Japan (Miura et al. 2013a). Public health programmes established to promote salt reduction and primary
care management of high blood pressure with antihypertensives have been credited with large reductions in hypertension in Japan.
Age and sex-specific prevalence of diabetes and hypertension are shown in Figures 3 and Figure 4, respectively and show Japan’s achievements in hypertension control. For both sexes, the prevalence of diabetes appeared to remain unchanged over the years in all age categories except for men aged 60 years and older, amongst whom a sharp increasing trend in diabetes prevalence can be seen. Age-specific prevalence of hypertension appeared to remain unchanged or showed a decreasing trend over time. However, further monitoring is needed of men aged 50 years or older, because of increasing prevalence of hypertension between 2000 and 2010 amongst some older age groups.
According to the recent report of the International Diabetes Federation (IDF) (International Diabetes Federation 2015) Japan is among the top ten countries with the largest number of adults with diabetes. Figure 1.6 shows prevalence of diabetes among
OECD countries. Among OECD countries, Japan ranked 6th position with a prevalence of 7.6%. The highest prevalence of diabetes, 9.6%, was in Portugal and lowest prevalence, 3.9%, was in Lithuania.
In 2013 the prevalence of obesity with a body mass index of 30 kg/m2 or greater was only 4.5 % for men and 3.3% for women. While the prevalence of obesity was constant among women over time, it increased between 1980 and 2013 from 1.5% to 4.5% in men. Prevalence of overweight or obesity with a body mass index of 25 kg/m2 or greater is much higher in men than women. In 2013, the prevalence of overweight or obesity was 28.9% for men and 17.6%
for women. While the proportion of overweight or obese women was constant, it increased rapidly in men from 18.0 % to 28.9 % between 1980 and 2013. Although, prevalence of obesity is still much below that other developed countries,(Ng et al. 2014) an increasing trend has been observed in both men and women since 1990.
Japan has made limited progress in reducing tobacco consumption over the past few decades compared to other
OECD countries, and it remains a leading cause of early death. The trend in tobacco use in Japan is shown in Table 9.
Tobacco related intervention programs including public awareness campaigns, smoking bans in public and work places, smoking cessation reimbursement support, and increased price on tobacco related products may have helped reduce the prevalence of tobacco consumption among the Japanese adult population (Joossens and Raw 2006;
Schumann et al. 2006).
The prevalence of smoking dropped almost 50% in Japan since 1980.
Around 21% of adults in Japan now smoke daily, down from over 42% in 1980. Japanese men smoke more than four times as much daily compared to women. Effective policies for tobacco control are needed in Japan in the light of tobacco control ordinances consistent with the Framework Convention on Tobacco Control (Shibuya et al. 2003).
There were approximately 1,000,000 births in Japan in 2010. Of these 9.6%
were low birth weight, a trend which has been increasing over the past decades. Since the 1970s Japan has
enjoyed low mortality rates for both mothers and their children. Infant mortality reached a new low in 2013 with 2.1 deaths per 1000 live births.
This decrease was mirrored in all measures, including neonatal, perinatal, and under-five mortality rates. Likewise the maternal mortality ratio (risk associated with each pregnancy) more than halved between 1990 and 2013.
Table 10 summarizes maternal, child and adolescent health indicators in Japan. Adolescent fertility rates have risen slowly over recent decades and have increased from four births per 1000 women to 5.4 per 1000, which is very low globally. Immunization rates in Japan are high and comprehensive coverage has been achieved for some years now, with the exception of measles where coverage fell to 73% in the 1990s due to fears surrounding the MMR vaccine. This drop proved to be temporary and as of 2013, 95% of children aged 12 to 23 months were immunized.
D 結論
In the past five decades, Japan has
achieved many noticeable successes including the full implementation of sustainable universal health coverage, gaining the highest healthy life expectancy in the world and the eradication or control of common infectious diseases. In addition, tobacco and alcohol consumption and transport accident deaths decreased substantially in the past 50 years. Because of these achievements, the country is facing many challenges including negative population growth with low fertility rate, an ageing population, shrinking economy, increasing unemployment rate, and increasing NCD-related disease burden. Many NCDs are preventable, since they are linked to modifiable lifestyles and dietary patterns. It is clear from the literature that people who do not smoke, abstain from or are moderate alcohol drinkers, are physically active, eat a healthy diet, and who are not overweight or obese are less likely to die or encounter disability in early life compared to those who have unhealthy habits.
Therefore, further attention to implementing effective policies on the health agenda is needed in order to
reduce the disease burden and prevent or reverse a declining population growth rate. To prepare for a future of low birth rates, population ageing and slow economic growth, Japan also needs to reform its universal health coverage system and reorient its health system towards managing the health problems that have arisen from its demographic transition.
E.健康危険情報 なし
F.研究発表 1.論文発表
1. Gilmour S, Liao Y, Bilano V, Shibuya K.
Burden of disease in Japan: Using national and subnational data to inform local health policy. Journal of
Preventive Medicine and Public Health.
2014; 47(3): 136-143.
2. Bilano V, Gilmour S, Moffiet T, Tursan d'Espaignet E, Stevens GA, Commar A, Tuyl F, Hudson I, Shibuya K. Global trends and projections for tobacco use, 1990–
2025:an analysis of smoking indicators from the WHO Comprehensive
Information Systems for Tobacco
Control. The Lancet.
2015;385(9972):966-76.
2.学会発表
1. Gilmour S. 2015. Estimation of the burden of disease in Japan.Presented at the Symposium on Environmental Burden of Disease in Japan.
Sungkyunkwan University School of Medicine. Feb. 24th, 2015.
2. Kita M, Gilmour S, Ota E. 2014. Trends in perinatal mortality and its risk factors in Japan. 20th World Congress on
Controversies in Obstetrics and Gynecology.
Paris, December 4-7, 2014.
G.知的所有権の取得状況の出願・登録状 況
1.特許取得 なし
2.実用新案登録
なし 3.その他 参考文献
1. Charvat H, Goto A, Goto M, Inoue M, Heianza Y, Arase Y, et al. 2015. Impact of population aging on trends in
diabetes prevalence: A meta‐
regression analysis of 160,000 japanese adults. Journal of Diabetes
Investigation.
2. Danaei G, Finucane MM, Lu Y, Singh GM, Cowan MJ, Paciorek CJ, et al.
2011. National, regional, and global trends in fasting plasma glucose and diabetes prevalence since 1980:
Systematic analysis of health examination surveys and
epidemiological studies with 370 country-years and 2· 7 million participants. The Lancet 378:31-40.
3. Horiuchi S. 2011. Major causes of the rapid longevity extension in postwar japan. The Japanese journal of population 9:162-171.
4. Ikeda N, Saito E, Kondo N, Inoue M, Ikeda S, Satoh T, et al. 2011. What has made the population of japan healthy?
The Lancet 378:1094-1105.
5. International Diabetes Federation.
2015. Idf diabetes atlas. 6th ed.
Brussels, belgium,
6. international diabetes federation.
7. Jones GW. 2007. Delayed marriage and very low fertility in pacific asia.
Population and Development Review 33:453-478.
8. Joossens L, Raw M. 2006. The tobacco control scale: A new scale to measure country activity. Tobacco control 15:247-253.
9. Martiniuk AL, Lee CM, Lawes CM, Ueshima H, Suh I, Lam TH, et al. 2007.
Hypertension: Its prevalence and population-attributable fraction for mortality from cardiovascular disease in the asia-pacific region. Journal of hypertension 25:73-79.
10. Ministry of Health Labour and Welfare.
2007. National health and nutrition survey 2007. Kasumigaseki
government publication service center.
11. Ministry of Health Labour and Welfare.
2015a. Vital statistics.
Tokyo:Kasumigaseki Government Publication Service Center.
12. Ministry of Health Labour and Welfare.
2015b. Statistical year book.
Tokyo:Kasumigaseki Government Publication Service Center.
13. Miura K, Ando K, Tsuchihashi T, Yoshita K, Watanabe Y, Kawarazaki H, et al. 2013a. [scientific statement]
report of the salt reduction committee of the japanese society of
hypertension(2) goal and strategies of dietary salt reduction in the
management of hypertension.
Hypertension research : official journal of the Japanese Society of Hypertension 36:1020-1025.
14. Miura K, Nagai M, Ohkubo T. 2013b.
Epidemiology of hypertension in japan:
Where are we now? Circulation
journal : official journal of the Japanese Circulation Society 77:2226-2231.
15. Morgan SP, Taylor MG. 2006. Low fertility at the turn of the twenty-first century. Annual review of sociology 32:375.
16. Murray CJ, Vos T, Lozano R, Naghavi M, Flaxman AD, Michaud C, et al. 2012.
Disability-adjusted life years (dalys) for 291 diseases and injuries in 21 regions, 1990-2010: A systematic analysis for the global burden of disease study 2010.
Lancet 380:2197-2223.
17. Ng M, Fleming T, Robinson M,
Thomson B, Graetz N, Margono C, et al.
2014. Global, regional, and national prevalence of overweight and obesity in children and adults during 1980–2013:
A systematic analysis for the global burden of disease study 2013. The Lancet 384:766-781.
18. OECD. 2014. Life expectancy at birth, total population", health: Key tables
from oecd, no. 11. 2014.
Http://dx.Doi.Org/10.1787/lifexpy-total- table-2014-1-en.
19. OECD. 2014. Health at a glance:
Asia/pacific 2014: Measuring progress towards universal health coverage, OECD publishing, Paris.
Http://dx.Doi.Org/10.1787/health_glanc e_ap-2014-en.
20. Salomon JA, Wang H, Freeman MK, Vos T, Flaxman AD, Lopez AD, et al.
2012. Healthy life expectancy for 187 countries, 1990-2010: A systematic analysis for the global burden disease study 2010. Lancet 380:2144-2162.
21. Sasaki N. 1964. The relationship of salt intake to hypertension in the japanese.
Geriatrics 19:735-744.
22. Schumann A, John U, Thyrian JR, Ulbricht S, Hapke U, Meyer C. 2006.
Attitudes towards smoking policies and tobacco control measures in relation to smoking status and smoking behaviour.
The European Journal of Public Health 16:513-519.
23. Shibuya K, Ciecierski C, Guindon E, Bettcher DW, Evans DB, Murray CJ.
2003. Who framework convention on tobacco control: Development of an
evidence based global public health treaty. BMJ 327:154-157.
24. Sleebos J. 2003. Low fertility rates in oecd countries.
25. Tanaka S. 2012. Status of physical activity in the japanese population. The Journal of Physical Fitness and Sports Medicine 1:491-497.
26. The World Bank. World development indicators.
Http://data.Worldbank.Org/data-catalo g/world-development-indicators.
(accessed date: March 2, 2015).
27. World Health Organization (WHO).
2014. Global health observatory (GHO) data repository. (accessed date: March 5, 2015).
Http://apps.Who.Int/gho/data/node.Mai n.688. Geneva.
28. World Health Organization (WHO).
2015. Global health expenditure database.
Http://apps.Who.Int/nha/database (access date: March 5, 2015). Geneva.
表1 Trends in population/demographic indicators, selected years
Indicators 1980 1990 2000 2010 2013
Population (in thousands) a 117060 123611 126926 128057 127298
Female (% of total) a 50.8 50.9 51.1 51.3 51.4
Population (% of total) a,b
0–14 years 23.5 18.2 14.6 13.2 12.9
65 years and older 9.1 12.1 17.4 23.0 25.1
80 years and older 0.5 0.9 1.7 3.0 3.6
Annual population growth rate (%)a 0.90 0.42 0.21 0.05 -0.17
Population density (per sq. km) a 314 332 340 343 341
Mean age at first childa 26.4 27.0 28.0 29.9 30.4
Mean age at first marriagea
Male 27.8 28.4 28.8 30.5 30.9
Female 25.5 25.9 27.0 28.8 29.3
Total fertility rate (per woman)a 1.75 1.54 1.36 1.39 1.43
Crude birth rate (per 1000 population)a 13.6 10.0 9.5 8.5 8.2
Crude death rate (per 1000 population)a 6.2 6.7 7.7 9.5 10.1
Age dependency ratio* 48.4 43.5 46.9 56.8 61.1
Rural population (%) b 23.8 22.7 21.3 9.5 7.5
Sources: aMHLW(Ministry of Health 2015b), bWorld Bank(The World Bank)
*Age-dependency ratio is the ratio of population (0-14 and 65+)/15-64
表2 Macroeconomic indicators, selected years
Total population 1980 1990 2000 2010 2013
GDP (¥B)a 246465 449392 509860 482384 480128
GDP (2005, US$)a 2448 3851 4308 4648 4785
GDP per capita (¥)a 2110467 3637713 4018759 3784878 3770482
GDP per capita, PPP (US$)a - 19249 25931 33916 36449
GDP average annual growth rate (%)a
2.8 5.6 2.3 4.6 1.6
Health expenditure, total (% of GDP)b
- - 7.6 9.6 10.1
Value added in industry (% of GDP)a
39.1 38.0 31.1 27.5 -
Value added in agriculture (%
of GDP)a
3.1 2.1 1.6 1.2 -
Value added in services (% of GDP)a
57.9 59.8 67.3 71.3 -
Labour force (total)a - 63776260 67589249 66420609 65545688
Unemployment, total (% of labour force)a
2.0 2.1 4.8 5.0 -
Real interest ratea 2.8 4.5 3.4 3.8 1.9
Gini coefficientc* 0.315 0.358 0.379 0.377 -
Source: aWorld Bank,(The World Bank) bWHO,(World Health Organization (WHO) 2015) cOECD(OECD 2014) Note: *The Gini coefficient is a measure of income inequality, higher figures indicate greater inequality among the population (estimated based on gross income).
¥, yen; ¥B, billion ¥; ppp, purchasing per capita
表3 Life expectancy at birth and health indicators by gender, selected years
Indicators 1980 1990 2000 2010 2012
Life expectancy at birtha
Male 73.3 75.9 77.7 79.5 79.9
Female 78.8 81.9 84.6 86.3 86.4
Healthy life expectancy at birthb,c
Male - 66.6 71.0 68.8 72.0
Female - 70.0 76.0 71.7 77.0
Total death ratea
Male 6.8 7.4 8.6 10.3 10.7
Female 5.6 6.0 6.8 8.7 9.3
Age-adjusted death ratea
Male 9.2 7.5 6.3 5.4 5.2
Female 5.8 4.2 3.2 2.7 2.7
Sources: aMHLW,(Ministry of Health 2015a) bSalomon et al. 2012,(Salomon et al. 2012) cWHO(World Health Organization (WHO) 2014). Note: Both death rates presented as per 1000 population
表4 Life expectancy (years), selected OECD countries, selected years
Life expectancy (years) Year
1980 1990 2000 2010 2012
Selected OECD countries
Canada 75.3 77.6 81.7 83.4 -
Finland 73.6 75 81.2 83.5 83.7
France 74.3 76.9 83 85.3 85.4
Germany 72.9 75.3 81.2 83.0 83.3
Greece 74.5 77.1 80.9 83.3 83.4
Italy 74.0 77.1 82.8 84.7 84.8
Japan 76.1 78.9 84.6 86.3 86.4
Korea 65.9 71.4 79.6 84.1 84.6
Mexico - - 76.1 77.0 77.3
United Kingdom 73.2 75.7 80.3 82.6 82.8
United States 73.7 75.3 79.3 81.0 -
Source: OECD(OECD 2014)
表5 Main causes of death, selected years Causes of death
(ICD-10 classification)
Number (rate per 100 000 population)
1980 1990 2000 2010 2012
Communicable diseases - 85902
(69.9)
120085 (95.7) 161162 (128.1)
Tuberculosis 6439
(5.5)
3664 (3.0)
2656 (2.1) 2129 (1.7) 2714 (2.2)
HIV/AIDS - 367 (0.3) 167 (0.1) 170 (0.1) -
Non-communicable diseases - 674492 (549.2) 811944 (647.1) 1024850 (814.5) -
Circulatory diseases 308462 (265.2) 303061 (246.9) 298338 (237.5) 341882 (270.5) 350912 (278.6) Malignant neoplasms 161764 (139.1) 217413 (177.2) 295484 (235.2) 353499 (279.7) 360963 (286.6)
Colon cancer 7932 (6.8) 15509 (12.6) 23637 (18.8) 30040 (23.8) 32177 (25.5)
Cancer of larynx, trachea, bronchus and lung
21294 (18.3) 36486 (29.7) 54770 (43.6) 70815 (56.0) 72471 (57.6)
Breast cancer 4141 (7.0) 5848 (9.4) 9171 (14.3) 12455 (19.2) 12529 (19.4)
Cervical cancer 1745 (3.0) 1875 (3.0) 2393 (3.7) 2664 (4.1) 2712 (4.2)
Diabetes 8504 (7.3) 9470 (7.7) 12303 (9.8) 14422 (11.4) 14486 (11.5)
Mental and behavioural disorders 3017 (2.6) 3068 (2.5) 3920 (3.1) 8049
(6.4)
10768 (8.5)
Ischaemic heart diseases 48347 (41.6) 48804 (41.9) 70183 (55.8) 77217 (61.1) 77579 (61.6)
Cerebrovascular diseases 162317 (139.5) 121944 (99.4) 132529 (105.5) 123461 (97.7) 121602 (96.5) Chronic respiratory diseases 48466 (41.6) 84910 (69.3) 134501 (107.1) 187609 (148.4) 201798 (160.2)
Digestive diseases 29606 (25.5) 27264 (22.3) 38268 (30.5) 45503 (36.0) 47255 (37.5)
Transport accidents 13302 (11.4) 15828 (12.9) 12857 (10.2) 7222 (5.7) 6414 (5.1)
Suicide 20542 (17.7) 20088 (16.4) 30251 (24.1) 29554 (23.4) 26433 (21.0)
Sources: MHLW(Ministry of Health 2015a) and GBD database
表6Disability adjusted life years (DALYs) by major diseases categories during 1990 to 2010
Characteristics All ages
DALYs
DALYs per 100,000
% of total DALYs
All diseases or injuries 100
1990 27812800 22647.1 100
2000 29990700 23900.2 100
2010 31231200 24821.3 100
Non-communicable diseases
1990 22867400 18620.2 82.2
2000 24732800 19710.1 82.5
2010 26071600 20720.8 83.5
Communicable, maternal, neonatal, and nutritional disorders
1990 2006120 1633.5 7.2
2000 2110450 1681.9 7.0
2010 2143830 1703.8 6.9
Injuries
1990 2939220 2393.3 10.6
2000 3144150 2505.6 10.5
2010 3015670 2396.7 9.7
Sources: GBD database
表7Prevalence of diabetes and hypertension in adults, Japan, selected years
Health conditions Percentage
1980 1990 2000 2010
Standardized diabetes (ages ≥ 20 years)
Male 3.8 9.3 9.5 9.7
Female 3.3 6.6 6.3 6.1
Both sexes - 7.9 7.8 7.9
Hypertension (ages ≥ 35-84 years)
Male 50.1 51.7 41.4 57.6
Female 43.3 46.8 31.9 42.2
Age-standardized (both sexes) 48.2 45.5 39.7 48.5
Sources: Diabetes: Danaei et al. 2011(Danaei et al. 2011), Charvat et al. 2015(Charvat et al. 2015) and hypertension:
Ikeda et al. 2014, Kearney et al. 2004, Miura et al. 2013,(Miura et al. 2013b) Martiniuk et al. 2007(Martiniuk et al.
2007) Note: Author’s estimated prevalence of hypertension for 1990 using meta-analysis from Miura et al.
2013(Miura et al. 2013b) data
表8 Body mass index in adult ages 20 years and older, Japan, selected years
High body mass index Percentage
1980 1990 2000 2010 2013
Overweight or obesity
Male 18.0 21.5 26.1 29.3 28.9
Female 19.4 18.5 18.0 20.7 17.6
Obesity
Male 1.5 1.8 3.0 3.6 4.5
Female 2.5 2.4 3.1 3.2 3.3
Sources: Ng et al. 2014(Ng et al. 2014).Note: Cut-off point for overweight or obesity≥25 kg/m2and obesity≥30 kg/m2.
表9 Proportion of Japanese adults who are daily smokers, 1980-2010
Risk factors Percentage
1980 1990 2000 2010
Smoking (ages ≥ 15 who are daily smokers)
Male 70.2 53.1 47.4 32.2
Female 14.3 9.7 11.5 8.4
Both sexes 42.3 28.5 27.0 21.5
Sources: OECD(OECD/WHO and DOI: 2014)
表10 Maternal, child and adolescent health indicators, selected years
Selected health indicator 1980 1990 2000 2010 2012 2013
Adolescent fertility rate 4.0 4.0 5.2 5.3 5.4 -
Perinatal mortalityb 11.7 5.7 3.8 2.9 2.7 -
Neonatal mortality rateb - 2.5 1.7 1.2 1.1 1.0
Infant mortality ratec 7.5 4.6 3.2 2.3 2.2 2.1
Under-five mortality rateb 9.9 6.3 4.5 3.2 3.0 2.9
Maternal mortality ratiobd - 14.2 10.0 6.0 - 6.1
Measles immunizationb 69.0 73.0 96.0 94.0 96.0 95.0
Low-birth weight babies (% of live births) 5.2 6.3 8.6 9.6 - -
Sources: bWorld Bank; b,cMHLW(Ministry of Health 2015a, b); dKassebaum et al. 2014; eOECD(OECD/WHO and DOI: 2014) Note: Adolescent fertility rate birth per 1000 women ages 15-19; mortality represents per 1000 live births; measles immunization for % of children ages 12-23 months
図1 Population pyramid in Japan
Sources: Ministry of Health, Labour and Welfare(MHLW) (Ministry of Health 2015b)
MEN WOMEN
85+
80 - 84 75 - 79 70 - 74 65 - 69 60 - 64 55 - 59 50 - 54 45 - 49 40 - 44 35 - 39 30 - 34 25 - 29 20 - 24 15 - 19 10 - 14 5 - 9 0 - 4
Age group (years)
,0 ,2 ,4 ,6 ,8
,0 ,2 ,4 ,6 ,8 ,10
図2 Top 15 leading risks for years of life lost (YLLs) in Japan
Sources: GBD database
21.33 17.40 14.98 5.66
5.59 3.18 3.04 2.91 1.26 0.63 0.23 0.17 0.10 0.10 0.02
0.00 5.00 10.00 15.00 20.00 25.00
Dietary risks High blood pressure Tobacco smoking Ambient particulate matter
pollution Alcohol use High fasting plasma glucose High total cholesterol High body-mass index Occupational risks Drug use Low bone mineral density Lead exposure Iron deficiency Ambient ozone pollution Zinc deficiency
% of total YLLs, 1990
21.41 14.89 13.62 6.82
5.08 4.85 3.95 3.38 3.33 0.87 0.65 0.54 0.48 0.38 0.32
0.00 5.00 10.00 15.00 20.00 25.00 Dietary risks
High blood pressure Tobacco smoking Physical inactivity and low
physical activity Ambient particulate matter
pollution Alcohol use High body-mass index High total cholesterol High fasting plasma glucose Occupational risks Intimate partner violence Drug use Lead exposure Low bone mineral density Childhood sexual abuse
% of total YLLs, 2010
図3 Age and sex-specific prevalence of diabetes in Japan during 1990-2010
Sources: Charvat et al. 2015(Charvat et al. 2015)
図4 Age and sex-specific prevalence of hypertension in Japan during 1980-2010
Sources: Miura et al. 2013(Miura et al. 2013b)
1.0 0.9 0.9 0.8 0.8
2.9 2.5 2.2 1.9 1.7
7.7 7.1 6.6 6.0 5.6
14.2 13.6 13.1 12.5 12.0
14.6 15.4 16.2 17.0 17.8
14.5 15.8
17.2 18.6
20.1
0.0 5.0 10.0 15.0 20.0 25.0
1990 1995 2000 2005 2010
Prevalence of diabetes
Years Men
0.8 0.7 0.7 0.6 0.6
1.5 1.2 1.1 0.9 0.8
3.5 3.2 2.9 2.6 2.4
7.1 6.6 6.3
5.9 5.6
10.3 10.4 10.5 10.6 10.7
12.3 12.3 12.2 12.2 12.1
0.0 2.0 4.0 6.0 8.0 10.0 12.0 14.0
1990 1995 2000 2005 2010
Years Women
20–29 30–39 40–49 50–59 60–69
≥70
25.4
21.7 23.7
20 45.7
38.9 36.4
29.9
58.2 56.1 54.9
63.2 71.6
66.3 67.4
65.6 79.3
75.6 74.9
80.8
0 10 20 30 40 50 60 70 80 90
1980 1990 2000 2010
Prevalence of hypertension
Year Men
11 9.6
7.4 5.6
31.6 29.2
19.4
12.6
52.5 50.5
45.5
38.4
68.3 67.1
64.2 62.3
78.1 77.8
75.3
71.2
0 10 20 30 40 50 60 70 80 90
1980 1990 2000 2010
Year Women
30-39 40-49 50-59 60-69 70-79
図5 Prevalence estimates of diabetes, adults aged 20-79 years, 2013
Sources: OECD 2014(OECD/WHO and DOI: 2014); IDF 2014; Note: Used diabetes prevalence for Japan in 2014
3.9 4.0 4.6 4.6 4.7 4.8 4.8 4.9 5.1 5.2 5.2 5.3 5.4 5.5 5.6 5.7 5.8 6.1 6.0 6.3 6.6 6.6 6.9 7.5 7.6 7.9 8.2 8.3 9.3 9.6
0 1 2 3 4 5 6 7 8 9 10
Lithuania Romania
Luxembourg Latvia
Sweden Belgium
Greece United Kingdom
Italy Poland
Netherlands Bulgaria
France Ireland
Croatia Estonia
Finland EU Hungary
Denmark Austria
Malta Czech Rep.
Slovenia Japan Slovak Rep.
Spain Germany
Cyprus Portugal
Prevalence of diabetes
平成 26 年度厚生労働科学研究費補助金(地球規模保健課題推進研究事業)
「エビデンスに基づく日本の保健医療制度の実証的分析」(H26‑地球規模‑一般‑001)
平成26年度分担研究報告書
研究代表者・渋谷健司
東京大学 医学系研究科 国際保健政策学教室 教授
Japan health system financing: a systematic assessment
研究分担者 ミジャヌール・ラハマン 東京大学 国際保健政策学 特任研究員 ギルモー・スチュアート 東京大学 国際保健政策学 助教
研究要旨
Health financing is a core component of health system function and can have significant effects on health care utilization decisions. Understanding the effect of health financing and the different kinds of financing system available during the implementation of health system reforms is essential to effective and sustainable UHC. Total expenditure on health accounted for 10% of GDP in Japan in 2013, one percentage point above the OECD average of 9%. The health insurance coverage rate was nearly 100% in Japan, and the share of household consumption spent on OOP payments was only 2%, which is less than the OECD average (3%). Reforms to the financing system and greater
efficiencies will be necessary to maintain a low-cost, equitable health system in the future.
A.研究目的
Health financing is a core component of health system function and can have significant effects on health care utilization decisions. As national health systems move to universal health coverage (UHC), decisions about financing mechanisms can exert considerable influence on the structure of the overall health system and its ability to ensure UHC goals such as equity, access, coverage and quality.
Understanding the effect of health financing and the different kinds of financing system available during the implementation of health system reforms is essential to effective and sustainable UHC. This report describes Japan’s health financing system, how it has changed over time, and the future challenges it faces.
B.研究方法
We used published national and international data sources to assess health financing in Japan. The available literature includes published papers, health financing-related reports and databases published by the Ministry of Health, Labour and Welfare
(MHLW). International data sources mainly include World Health Organization (WHO) and OECD libraries. Using this data we conducted a short analysis of health expenditure patterns since 1995 and then presented sources of health care expenditure. We also describe how decisions are made on the allocation of resources between types of health care, the relationship between purchasing and purchaser and payment mechanisms.
C.研究成績及び考察 C-1 Sources of financing
The Japanese health care system is primarily funded through taxes (Figure 1). Both the central government and municipalities levy proportional income taxes on their respective population.
The key sources of financing are an insurance premium (20.2% business operators and 28.4% insured persons), followed by public funds (26% state subsidies and 12.4% local subsidies), co-payments (12%) and others (0.7%).
The national subsidy rate for the Japan Health Insurance Association was 16.4% from July 2010 to fiscal year
2014.(Ministry of Health 2014) National medical expenditure was distributed as follows: 37% on inpatient care, 35% outpatient, 7% dental, 17%
pharmacy dispensing, 2% hospital meals and living expenses, and 1.5%
medical care expenses and others.(Ministry of Health 2013, 2014) Health care expenditure in Japan was almost stable over the last two decades.
Table 1 presents the trend of health care expenditure in Japan.
Total expenditure on health as a proportion of GDP slightly increased from 8% in 2005 to 10% in 2013.
However, health spending was stable from 1995 to 2005 and 2010 to 2013. In 2013, around 82% of expenditure was from public services and 18% from private services. A similar proportion was observed in the United Kingdom.(Boyle) Public and private expenditure on health as a proportion of total health expenditure have been almost stable since 1995. Government expenditure on health as a proportion of total expenditure increased from 15%
in 1995 to 20% in 2013 with a 1%
increase in the rate every year. When risk pooling mechanisms are not well
designed, direct out-of-pocket (OOP) payments may incur financial catastrophe or push non-poor households into poverty. Many developing and developed countries are facing financial hardship due to high OOP payments. However, the share of OOP payments in total health expenditure in Japan declined from 15% in 2000 to 14% in 2013.
Government spending on health as a percentage of total national health expenditure across OECD countries since 1995 is shown in Table 3.2. The proportion of health expenditure paid by the public sector in Japan in 2013 was comparatively higher than many other high-income countries.
Government expenditure as a percentage of total national expenditure ranged from 47% (Canada and Austria) to 85% (Estonia and Netherlands) in 2013. The 2013 OECD median was 76%, relatively lower than Japan.
Table 3 shows healthcare expenditure as a proportion of GDP in selected OECD countries. The 2013 median healthcare expenditure in selected OECD countries as a percentage of
GDP was 9%. The total healthcare expending as a share of GDP has grown in all countries except Denmark, Finland, and Italy since 1995. In 2013 healthcare expenditure in most European countries accounted for 9-11% of GDP and only a handful of OECD countries like Canada, Germany, and Mexico exceeded 11%. A steady increase in health care expenditure was also noticeable in Japan from 7% of the GDP in 1995 to 9% in 2013.
Given the rapidly aging population, the burden of health care expenditure is expected to grow fast in Japan. Per capita health expenditures in Japan have increased from $1762.9 in 2000 to
$2356.6 in 2013 (Table 4). Recent per capita health expenditure is below the median OECD countries per capita of
$34045.2. In contrast, in the United Kingdom and the United States of America, per capita expenditure shows decreasing trends from 2010 to 2013. In 2013, the per capita expenditures in these two countries were $1061.1 and
$1677.6, below Japan`s. Among European countries, the per capita health expenditures increased very rapidly in Turkey from $3810.3 in 1995
to $9145.8 in 2013. The other OECD countries, which saw an increase in per capita health expenditures more than
$6000 were Israel, Iceland, and Denmark.
C2 Patterns of health care expenditure
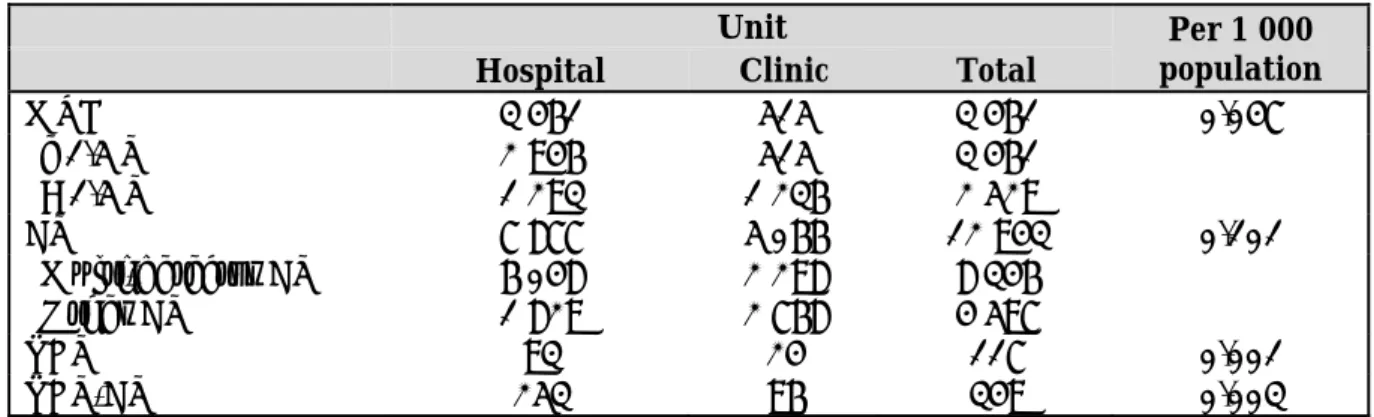
National health care expenditure by types of medical care from 1995 to 2011 is presented in Table 5. Hospital expenditure was substantially higher in inpatient care; however, general clinic expenditure was higher for outpatient health services. The proportion of medical, outpatient, and dental care expenditure has been slightly deceasing since 1995, while pharmaceutical expenditure rapidly increased. In 2011, pharmaceutical expenditure increased more than four times compared to 1995. In recent times, home visit health expenditure also increased substantially compared to 1995-2005.
Age-specific health care expenditure by type of health service is presented in Table 6. Overall, per capita expenditure on health was 278129 million yen, and little difference was
observed between inpatient (143754 million yen) and outpatient care (134376 million yen). Per capita medical expenditure increased rapidly with increased age. The highest medical expenditure for individuals was observed in those aged 65 years or over (159738 million yen) and the lowest in the age of 14 years or less (17544 million yen).
Disease-specific medical care expenditure by major types of health services is shown in Table 7. The three main categories of expenditure were the circulatory system (57926 million yen), neoplasms (36381 million yen), and respiratory system (21707 million yen). Inpatient expenditure was substantially higher compared to outpatient care.
The proportion of people covered by types of risk of pooling mechanisms from 1980 to 2011 is presented in Table 8. The health insurance coverage rate was 100% in Japan. The largest proportion (58%) of the population was covered by employee health insurance, including government-managed health insurance, society-managed health insurance and mutual aid societies.
Government-managed health insurance covered a larger proportion of the population (27%), followed by society-managed health insurance (23%), and mutual Aid Societies (7%).
National health insurance covered 30%
of the total population.
The trend in national health expenditure by financing sources since 1985 is shown in Table 9. The total proportion of national health expenditure drawn from taxation increased from 32% in 1995 to 38% in 2011; however, insurance premium contributions declined rapidly in this period, from 56% in 1995 to 48% in 2011. The proportion of payment drawn from patient cost sharing fluctuated during this period. The patient cost sharing amount was almost stable from 1985 (12.3%) to 1995 (11.9%), and increased from 2000 (13.4%) to 2005 (14.4%) before returning to levels similar to those seen in 1985. In developing and developed countries where public funding for health services is inadequate and risk pooling mechanisms in health financing are limited or unavailable, unexpected out-of-pocket (OOP) payments and
illness-related production or income loss can trigger asset depletion, indebtedness and reductions in essential consumption, leading sometimes to financial catastrophe.
(Chuma et al. 2007; Ezeoke et al. 2012;
Huffman et al. 2011; Kabir et al. 2000;
Leive and Xu 2008; McIntyre et al.
2006; Russell 2004; Steinhardt et al.
2009) On average 14% of health spending is paid directly by patients in Japan in 2011. The burden of OOP payments across OECD countries is presented in Figure 2. The burden of out-of-pocket health spending can be measured either by as ashare of total consumption expenditure or in total household income. On average in OECD countries, the OOP payment as a proportion of total household consumption was around 3%. The average share varied substantially across OECD countries in 2011, from its lowest value in France, the UK, Turkey, and the Netherlands (1.5%) to its highest in Chile, Mexico and Korea (4.6%). In Japan, 2.2% of consumption was spent on OOP health services, slightly lower than the OECD average.
The low burden of OOP payments in
Japan is due to sustainable health insurance polices with low co-payments and caps on maximum OOP payment size.(Ministry of Health 2013, 2014) The share of OOP spending on different health-related goods and services across selected OECD countries is presented in Figure 3. In most OECD countries, curative care and pharmaceutical goods or services are the two most important spending items for OOP payments and account for more than 70% of total health care expenditure. In Japan, Hungary, Iceland, Poland, Estonia, Canada and the Czech Republic, more than 40% of OOP payments are for pharmaceuticals.
However, in Belgium, Switzerland, New Zealand, Korea, household payments for curative care account for about 50%
or more of total household medical expenditure. OOP payments for pharmaceutical goods or services are substantially higher than curative care in Japan and many other OECDs countries including Hungary, France, Australia, Finland, Iceland, Netherlands, Poland, Estonia, Canada and the Czech Republic. Health expenditure related to dental care also
contributes a larger share in household medical spending. On average, OECD counties spend around 19% of OOP payments on dental care. The highest OOP payments related to dental care were in Spain (30%) and the lowest in Belgium, Hungary, and the Slovak Republic (8%) 2011. Around 12% of OOP payments went to therapy in OECD countries in 2011. In Japan this figure was only 8%
C-3: Payment mechanisms
Reimbursement under Japan’s national health insurance (NHI) system uses a contract-based purchaser/provider system. Under this system, providers contract with the government to follow NHI directives on billing and provision of services, in return for payment from the national insurance pool.
Practitioners agree to follow best practice rules set by the government in order to be paid under this system, and as a result very few practitioners operate independently from the national scheme. Selective contracting between insurers and providers is strictly regulated and therefore
remains uncommon, though legislation was relaxed in May 2003.
All claims made by providers are vetted and monitored by the government. In instances of fraud or abuse of the system, contracts with medical facilities are voided and individual practitioners may have their licenses revoked. For instance, in 2004 a total of 27 hospitals and clinics, 19 dental clinics and 2 pharmacies had their contracts terminated. (Pinilla et al.
2015)
By enabling the vetting of providers and setting of standardized fees, this contract allows the central government to exert great influence over the entire healthcare system: controlling costs, distributing human resources more evenly across the country, and maintaining equality in health outcomes at levels higher than many other OECD countries.
In 2003 a new system of reimbursement was introduced:
Diagnosis Procedure Combination (DPC). In contrast with the traditional fee-for-service system, DPC introduced a scaled per diem payment dependent diagnosis and procedures given.
Hospitalization is divided into three stages, with the first being reimbursed at a 15% higher rate which then decreases as length of stay increases up until a cutoff point after which hospitals may revert to pay-for-service.
Another unique feature of DPC is that pricing can vary according to hospital, partly in order to maintain historic levels of reimbursement.
However, the system is limited to hospital charges alone (e.g.
accommodation charges, nursing and laboratory costs) whilst doctors’ fees, including surgery, consultation, and rehabilitation, are reimbursed under the old retrospective payment model. In recent years the expansion and operation of the system has been limited by shortcomings in hospital information systems.
Despite these issues the DPC system has grown over the years. 360 hospitals were using the system in 2006, whilst in 2005 over 974, 163 inpatients were billed using DPC. Furthermore, hospitals using DPC have shown reductions in average length of stay amongst patients. Okamoto (2005)(WHO) reports that in the three
months after the initiation of DPC, 80 out of 82 hospitals experienced shorter average lengths of stay, with reductions increasing the longer the initial pre-DPC average length of stay was.
Reimbursement for medical staff and services is revised every two years through negotiations between state administrators, professional and hospital organizations, insurers, pharmaceutical companies, consumer rights groups, and other related parties.
This regular review allows the government to control costs as well as promote specific health policy through the price incentivization of certain treatments. The next review is due to be held in 2016.
To facilitate this process the Central Social Insurance Medical Care Committee conducts economic surveys to provide data for the revision of fees.
Findings from June 2005 showed that out of 550 privately owned clinics (run by a practicing doctor as dictated by law) the average turnover in the survey month was 2.27 million yen (approximately US$20 000 at that time). Dentists were relatively less well reimbursed, with the average monthly
salary of 642 dentists being 1.35 million yen.
Payment of staff is set at a uniform rate across Japan, with no distinction made as to whether someone works in a hospital or a clinic. The incorporation of some hospitals means that many doctors and other staff are paid a salary (and bonus) rather than the direct rate set by the government. Combined with the aforementioned uniform payment systems, there is often a disparity in pay between workers at clinics and hospitals due to higher overheads at the latter.
According to figures for April 2004 from the National Personnel Authority the average monthly salary for hospital doctors was 910,558 yen (derived from 2175 doctors, average age 37.9 years), 338 859 yen for nurses (9813 nurses, average age 34.3 years, and 1.56 million yen for hospital presidents (124 doctors, average age 58.4 years). The difference between nurses’ and doctors’
pay however is to an extent lessened by end of year bonuses which nurses, but not always doctors, receive.
D 結論
Total expenditure on health accounted for 10% of GDP in Japan in 2013, one percentage point above the OECD average of 9%. In nearly all OECD countries including Japan, the public sector is the main source of health funding. In 2013, 82% of health spending came from public sources, well above the average of 76% in OECD countries. Direct OOP payments contribute only 12% of total health financing. The health insurance coverage rate was nearly 100% in Japan, and the share of household consumption spent on OOP payments was only 2%, which is less than the OECD average (3%). Despite this success, the key challenges in Japan are population ageing and rapid increases in chronic illness, which see Japan facing a future of contracting public revenues, pressures on the healthcare workforce, and an increasing burden of social care and long-term treatment payments. Reforms to the financing system and greater efficiencies will be necessary to maintain a low-cost, equitable health system in the future.