JAIST Repository
https://dspace.jaist.ac.jp/Title
Aqueous Synthesis and Characterization of Ag and Ag-Au Nanoparticles: Addressing Challenges in Size, Monodispersity, and Structure
Author(s) Mott, Derrick; Thuy, Nguyen T. B.; Aoki, Yoshiya; Maenosono, Shinya
Citation
Philosophical Transactions of the Royal Society A: Mathematical, Physical and Engineering Sciences, 368(1927): 4275-4292
Issue Date 2010-09-28
Type Journal Article
Text version author
URL http://hdl.handle.net/10119/10314
Rights
Copyright (C) 2010 The Royal Society. Derrick Mott, Nguyen T. B. Thuy, Yoshiya Aoki and Shinya Maenosono, Philosophical Transactions of the Royal Society A: Mathematical, Physical and Engineering Sciences, 368(1927), 2010, 4275-4292, http://dx.doi.org/10.1098/rsta.2010.0120
Aqueous Synthesis and Characterization of Ag and Ag@Au
Nanoparticles: Addressing Challenges in Size, Monodispersity,
and Structure
Derrick Mott, Nguyen T. B. Thuy, Yoshiya Aoki and Shinya Maenosono*
*To whom correspondence should be addressed. Email: [email protected]
Japan Advanced Institute of Science and Technology, School of Materials Science, 1-1 Asahidai, Nomi, Ishikawa 923-1292, Japan
In this paper we demonstrate the synthesis of monodispersed silver nanoparticles (NPs) of controlled size (20.5 ± 3.3nm) in aqueous phase from a silver hydroxide precursor with sodium acrylate as dual reducing-capping agent. We then coat these NPs in a layer of gold with controllable thickness through a reduction-deposition process. The materials are characterized using several techniques including HR-TEM, UV-Vis, XRD, XPS, etc. The results show that we were able to synthesize not only monodispersed Ag NPs but also core@shell Ag@Au NPs with a discrete structure, which is significant because of the challenges associated with the creation of such materials, namely the propensity of metallic Ag to be oxidized by the presence of ionic Au. The NPs are of interest for use in a wide range of potential applications including bio-medical diagnostics and bio-molecular detection as well as many others.
1. Introduction
Silver nanoparticles (NPs) have traditionally received wide attention for their enhanced properties in a multitude of potential applications including sensing, microelectronics, catalysis, etc., as described by the studies of Wiley et al. (2007), Lu et al. (2006), Shon et al. (2004), and Pillai et al. (2004) as well as by many others. Silver metal has many desirable chemical and physical traits such as conductivity, catalytic activity, and abundance, but it is the optical properties of silver NPs that make it an exceptional candidate for use in bio-diagnostics and sensing, which has been illustrated by such researchers as Cao et al. (2001), Cui et al. (2006), and Lu et al. (2006). The exceptionally high extinction coefficient of Ag NPs associated with its very high enhancement ability in Raman spectroscopy has led to their use as sensing agents in several biological applications such as detection of proteins, amino acids, or DNA by several researchers including Cao et al. (2001) and Cui et al. (2006). Despite the promising properties displayed by Ag NPs though, there have been several difficult challenges to address, namely the ability to synthesize Ag NPs in aqueous phase with a desired size, shape, or monodispersity (Sharma et al. (2009)), and secondly, the ability to associate the resulting Ag particles with the desired biomolecules so that detection can be performed (Cao et al. (2001)).
Synthesis of Ag NPs has been accomplished through several different techniques including microemulsion by Sun et al. (2001), reverse micelles by Taleb et al. (2000), liquid-liquid by Cai
et al. (2004), double pulse method by Sandmann et al. (2000), sonochemical methods by Liu et al.
(2004), as well as several other techniques, including those by Wang et al. (2005), Sun et al. (2003), Cavicchioli et al. (2005), Cao et al. (2004), Ren et al. (2005), and Liu et al. (2005). In addition, the synthesis of Ag NPs has been performed in both organic and aqueous phase resulting in particles with not only different size and morphology, but also with different capping species and surface properties. In organic phase, Ag NPs have been synthesized by several researchers. He et al. (2001) synthesized Ag NPs capped by thiol molecules in the traditional 2-phase synthesis, Sun et al. (2005) utilized the thermal method, Wiley et al. (2005) employed the
polyol technique, and Lin et al. (2003) synthesized Ag NPs capped by oleic acid. These techniques could provide Ag NPs with good monodispersity and stability, but the drawback of these techniques is the small size of the resulting particles (which has low Raman enhancement capability) and the difficulty in transferring the resulting NPs to aqueous media for biological applications. In aqueous phase, Ag NPs have been successfully synthesized by Hussain et al. (2003) using sodium acrylate as a dual reducing/capping agent, however the particles showed limited monodispersity. In addition, aqueous Ag NPs have been synthesized using citrate by Pillai et al. (2004), sugar molecules by Panacek et al. (2006), poly(allylamine) by Sardar et al. (2007), gum acacia by Mohan et al. (2007), PVP by Hoppe et al. (2006), ethylenediamine and CTAB by Cui et al. (2006), as well as with Ag2O as silver precursor and hydrogen as reducing agent by Evanoff et al. (2005). Aqueous synthesis techniques for Ag NPs are advantageous for biological applications as the resulting particles can often be used directly, yet these techniques typically provide Ag particles of low monodispersity, or with a size that is difficult to control. In this paper we present a simple and straightforward technique for the synthesis of Ag NPs that have a very well defined size distribution and are well dispersed in aqueous media.
In terms of addressing the reactivity of silver nanoparticles with biomolecules, the metal exhibits a weaker affinity for those containing sulfur compared to gold, which has a very strong affinity for sulfur (and sulfur containing molecules) (Cao et al. (2001) and Cui et al. (2006)). In light of this, many researchers have attempted to couple Ag and Au NPs to make a functional material with the optical properties of silver and the sulfur-reactivity of gold. Gold and silver metals have many similar properties, including a closely matched lattice parameter (Cao et al. (2001)) which reduces lattice strain at the silver-gold interface and facilitates formation of a bimetallic structure. However, the reduction potential of Au is significantly higher than that of Ag, which means that exposing Ag metal to Au ions causes an etching of the Ag by Au, ultimately producing Au metal at the expense of oxidizing the Ag, which has been illustrated by Sun et al. (2002, 2004). Typically this approach produces either Ag-Au alloys, or hollow Au
cages. Many attempts have been made to coat Ag by Au including a seed-growth method by Srnova-Sloufova et al. (2000) and Cui et al. (2006), in aqueous phase by quick reduction of Au by sodium borohydride on Ag seeds by Cao et al. (2001), or by a phase transfer technique of Ag seeds to toluene for deposition of Au on the Ag particle surface by Yang et al. (2005). In addition, the ability of ionic Au to etch Ag metal has been taken advantage of to create Au cages or shells templated from the Ag particles as shown by Sun et al. (2002, 2004).
The approach we have taken to these challenges is a modification to the synthesis of Ag NPs in terms of synthetic conditions and reagents towards particles of controllable size and monodispersity. In terms of coating Ag particles with Au, we use a technique where additional reducing agent is added in tandem with Au precursor to minimize the etching of the Ag particles during the coating process. While it is possible that some degree of etching or alloying of Ag and Au take place, we show that it can be controlled by the amount of Au precursor added, the amount of additional reducing agent added, and the control of the remaining experimental conditions. In this way the coating of Ag NPs with a thin layer of Au becomes a promising avenue towards effective bio-probes.
2. Experimental
Chemicals: Silver nitrate, sodium acrylate, gold tetrachloroaurate trihydrate and common
solvents were obtained from Aldrich. Water was purified with a Millipore Direct-Q system (18.2MΩ). Dialysis membranes with molecular weight pore size of 10,000 daltons were obtained from Spectra/Por and were rinsed in pure water before use.
Synthesis of Ag NP Cores: Ag NPs were synthesized by first mixing 50ml of water with
1.25×10⁻⁵ moles of silver nitrate, and then adding 6.75×10⁻⁶ moles of sodium hydroxide, which results in a dilute yellow colored solution of silver hydroxide. This solution is purged with argon and is then brought to reflux. At reflux, 2.55×10⁻⁴ moles of sodium acrylate are added causing
the solution to turn completely clear. The solution is refluxed for 1 hour, over this time the solution color changes from clear to green-yellow to yellow-orange.
Purification of as-synthesized Ag NPs: Prior to deposition of Au on the Ag NP seeds, the
as-synthesized particles are purified to remove excess acrylate, silver, sodium, and other ions from the solution. Purification is performed by enveloping the particle solution inside of a cellulose dialysis membrane with pore size of 10,000 daltons and soaking in a distilled water bath. The water was changed every 12 hours for 48 hours.
Deposition of Au on the Ag Cores to form Ag@Au NPs: 50ml of the dialysized Ag
particles (7.28×10⁻¹¹M Ag NPs) are brought to reflux and 10ml of a gold tetrachloroaurate trihydrate solution (ranging from 6.25×10⁻⁷ to 3.13×10⁻⁶ moles according to the thickness of the Au shell desired) and 10ml of a sodium acrylate solution (from 5.10×10⁻⁵ to 2.55×10⁻⁴ moles) are added drop-wise simultaneously. The solution color changes depending on the amount of Au added. In general, as Au and sodium acrylate is added to the Ag particles, the color changes from yellow-amber to dark amber to grey to grey-purple and finally to purple.
Instrumentation and Measurements: An array of techniques including Transmission
Electron Microscopy (TEM), High Resolution TEM and Energy Dispersive Spectroscopy (HR-TEM, EDS), X-Ray Diffraction (XRD), X-Ray Photoelectron Spectroscopy (XPS) and Ultra-Violet Visible Spectroscopy (UV-Vis) were used to characterize the size, shape, composition and other properties of the NPs. TEM analysis was performed on an Hitachi H-7100 transmission electron microscope operated at 100kV. HR-TEM and EDS analysis was performed on an Hitachi H-9000NAR transmission electron microscope operated at 300kV. TEM and HR-TEM samples were prepared by dropping the suspended particles onto a carbon coated copper grid and drying overnight in air. XRD patterns were collected in reflection geometry using a Rigaku RINT2000 X-Ray diffractometer at room temperature with Cu Kα radiation (wavelength 1.542Å). XRD samples were prepared by salting the nanoparticles out of solution (with NaCl) and collecting the precipitate. The precipitate was rinsed in water and then dried before analysis.
XPS spectra were collected using a Physical Electronics ESCA 5600 multi-technique XPS system. Samples of suspended NPs were dropped onto conductive carbon paper and allowed to dry overnight. UV-Vis spectra were collected in the range of 300 to 1100nm using a Perkin-Elmer Lambda 35 UV-Vis spectrometer.
3. Results and Discussion
In general, our synthetic rout towards Ag@Au NPs consists of 2 main steps. First we synthesize the Ag cores in aqueous phase with an acrylate capping agent. In the first part of the results and discussion section we show our synthetic approach to monodispersed Ag particles and then discuss their formation. The second step of this research is the coating of Au on the Ag particle surface. In the second part of the results and discussion section we illustrate the coating of the Ag particles by Au and discuss the ability to control the thickness of the Au layer and the resulting morphology of the nanostructures. The overall technique of our synthetic approach is shown in Scheme 1. In this approach, first we used silver nitrate and sodium hydroxide to create a dilute solution of silver hydroxide. This solution was brought to reflux, whereupon sodium acrylate was added, initiating the formation of Ag NPs. The Ag particles formed over the course of one hour as evidenced by the appearance of a yellow-amber solution. After synthesis, the particles were purified by using dialysis to remove excess acrylate, silver ions, and other species. The purified solution was then heated to reflux, and varying amounts of gold and sodium acrylate were added to the solution causing Au to be deposited on the surface of the Ag NPs.
3.1. Synthesis of Monodispersed Ag NPs
In this section we discuss the synthesis of Ag NPs capped in the acrylate molecule from a silver hydroxide precursor. As described earlier, we combined aqueous silver nitrate with sodium hydroxide, creating a dilute silver hydroxide (Ag(OH)2−) solution with yellow color. Typically the addition of silver to an alkali hydroxide would form insoluble Ag2O, a black or brown material. However, in our technique, the relative concentration of silver is very low, allowing us to form the slightly soluble silver hydroxide. If we increase the concentration of silver in the preparation, a brown opaque suspension forms, indicative of Ag2O formation. This phenomenon is interesting, and is part of our continuing investigations. In any case, we believe that by using silver hydroxide as a precursor, the nucleation and growth of the Ag particles can be controlled to produce size monodispersed Ag NPs. This observation is supported by the fact that synthesizing the Ag particles from only silver nitrate resulted in much less uniform Ag particles in terms of size. In addition, Nishimura et al. (2010) has observed that the synthesis of copper NPs in aqueous phase benefitted by starting from a hydroxide precursor. After formation of the silver hydroxide precursor, the solution is completely purged with argon creating an inert reaction atmosphere, eliminating the interaction of oxygen and silver. This also increases the monodispersity of the Ag NPs which has been observed previously by Wang
et al. (2005). Next the solution is brought to reflux. Once at reflux, sodium acrylate is quickly
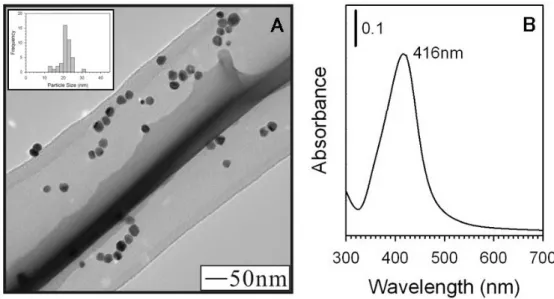
injected as a solution. The yellow color of the silver hydroxide solution quickly turns clear indicating displacement of the Ag(OH)2- complex by acrylate. As the solution continues to reflux, particle formation is evident within about 5 minutes as indicated by the presence of a yellow-green color. As the reaction progresses, the color deepens to a yellow-amber. The reaction is concluded after 60 minutes of reflux. Figure 1A shows the TEM image of the as-synthesized Ag NPs capped by the acrylate molecule. The particle size distribution is 20.5 ± 3.3nm (16% deviation), which represents a significant improvement in the monodispersity of these particles at this size over other preparation techniques, for example those prepared by
Hussain et al. (2003) which were polydisperse in the range of 18-40nm, or those prepared by Panacek et al. (2006), which were polydisperse in the range of 25-50nm. Also, we were able to achieve an increase in size over other Ag particles prepared by some traditional techniques, for example those prepared by Taleb et al. (1997) of 4.1 ± 0.5nm size, or those prepared by Lin
et al. (2003) of 10.9 ± 1.7nm size, while simultaneously keeping the particle monodispersity
high.
Figure 1. As-synthesized Ag NPs capped with the acrylate molecule, the inset to the image shows the size distribution of the Ag NPs (A). UV-Visible spectrum of the as-synthesized Ag NPs with peak maximum of 416nm (B).
The as-synthesized NP optical properties were studied by using UV-Visible spectroscopy. Figure 1B shows the resulting UV-Vis spectrum for as-synthesized Ag NPs. A well defined surface plasmon resonance (SPR) band is observed at 416nm, characteristic of Ag NPs. For comparison purposes we calculated the theoretical SPR peak maxima for 20nm Ag NPs with no capping agent using Mie Theory. The calculated maximum is at 389nm, which is slightly lower than our observed value, however this is likely due to the presence of the acrylate capping species in our NP sample, which causes a shift in the peak maxima to longer wavelength, which has been observed by Taleb et al. (1997) or it could be due to a difference in the particle morphology from that used in the model (for example, decahedral vs. round shaped
NPs), which has been illustrated by Wiley et al. (2007). Our observed SPR band position for the Ag NPs is also consistent with that observed by many others including Hussain et al. (2003) who observed a peak maxima of 432nm for polydispersed Ag NPs capped in acrylate molecules, or Shon et al. (2004) who observed a value of 425nm for 3.5 ± 1.0nm Ag NPs capped in thiol molecules.
The uniform size and intense SPR band of our Ag NPs made them ideal for determining their extinction coefficient. To achieve this we determined the mass of Ag particles formed in a single synthesis using Thermal Gravimetric Analysis (Supplementary Information Figure S1). Given the size of the particles and their total mass, we calculated the Ag NP concentration to be 7.28×10⁻¹¹M and their extinction coefficient to be 2.11×10¹⁰M−1cm−1. This value is consistent with what others have measured, including a value of 4.75×10⁹M−1cm−1 shown by Link et al. (1999) for 20nm Ag NPs. Our value reflects the unique characteristics of our NPs, including aqueous medium and capping shell identity. We also found that our synthetic yield of Ag particles from silver precursor was 62%.
The challenges in synthesizing aqueous Ag NPs stem from the affinity of silver for oxygen, and the challenge in controlling the rate of the nucleation and subsequent growth of Ag particles, which typically results in Ag NPs of very large size distribution and non controllable size, as shown by Wang et al. (2005). The use of a silver hydroxide precursor was observed to result in much more monodispersed Ag NPs than if silver nitrate alone had been used. Silver hydroxide is insoluble in water, which typically would make it non-ideal for use as a precursor to NP formation. However, in our synthesis, the silver hydroxide complex is very dilute, which results in a transparent yellow solution of the material. After reflux of the silver hydroxide solution, sodium acrylate is added, which causes an immediate clearing of the solution from its yellow color. This is an indication that the hydroxide in the complex has been displaced by acrylate, forming an equilibrium between the silver hydroxide and the silver acrylate complexes. It is this equilibrium that we believe gives rise to the more monodispersed Ag particles. As illustrated by
Evanoff et al. (2005), a slightly soluble Ag complex can give rise to highly monodispersed Ag NPs as the supply of Ag during NP formation is kept at a constant rate. In a synthesis where all of the Ag is available from the start of the reaction, as the particles form and grow in size the Ag is used up changing its concentration and the kinetics of the reaction, which results in non-monodispersed NPs. In our synthesis, the silver hydroxide serves as a regulatory source of Ag, resulting in very uniform Ag NPs.
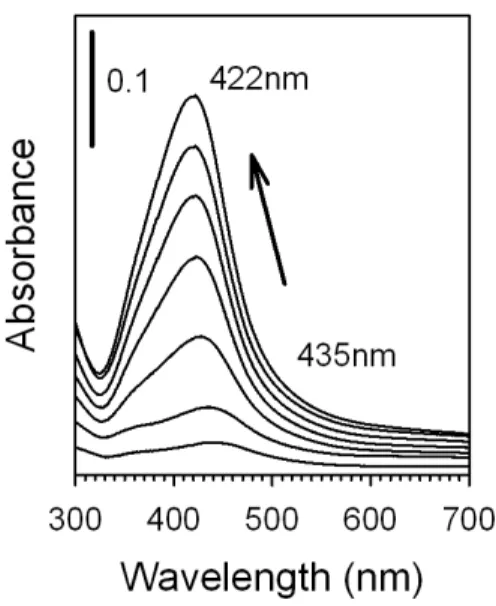
To gain an understanding of the formation of the Ag NPs, we followed the synthesis using UV-Visible spectroscopy. In this experiment, we collected 1ml samples from the reaction solution periodically throughout the synthesis, these 1ml samples were put into plastic cuvettes and diluted to a final volume of 3ml in water. The UV-Vis spectra were then collected. Silver nitrate in water shows no absorbance in the UV-Vis region of the electromagnetic spectrum, while that for silver hydroxide shows a weak and broad band at 650nm, which completely disappears upon addition of acrylate at reflux. Figure 2 shows the resulting UV-Vis spectra taken during Ag NP synthesis. The TEM images were also collected during the course of the reaction (Supplementary Information Figure S2). The formation of Ag NPs is observed starting from around 5 minutes of reflux time, as evidenced by the formation of an SPR band at 435nm. As time progresses, this band increases in intensity, indicating the formation of more Ag NPs in the solution, while the SPR band slowly shifts to a final position of 422nm. It is interesting to note that the SPR band position starts off at a higher wavelength and gradually decreases throughout the reaction. A similar effect has been observed by Loncaric et al. (2010) in which heating induced a size increase in Ag particles deposited on a glass substrate. The blue shift in the SPR band of these particles was attributed to changes in the particle shape during the size growth, changes in the interparticle distance, and a general change in the optical properties for small Ag particles as compared to large Ag particles resulting from the shorter mean free path of electrons for small particles. For our own particles, the shape of the small particles vs. the larger Ag particles is likely the source of the blue shift in SPR band as the
synthesis progresses, consistent with the formation of small NPs and their gradual growth to larger NPs. In addition, a small shoulder in the SPR band can be observed around 360nm or so, which seems to decrease in relative intensity as compared to the parent peak over time. This small band can also be attributed to shape sensitive growth as it is likely that the small Ag particles start out as a distinct geometrical shape such as decahedral, which grows into a more round shape over the course of the synthesis. In addition, by plotting the absorbance change in the peak maxima as a function of reaction time, the formation rate of the Ag NPs was revealed (Supplementary Information Figure S3). Note that the final peak maximum for these Ag NPs is 422nm, which is higher than that observed in Figure 1B (416nm). This phenomenon occurs because of the physical action of removing 1ml aliquots of reaction solution periodically throughout the synthesis to collect the UV-Vis spectra. The reduced reaction volume slightly changes the kinetics of NP formation and hence the peak maxima. Despite this, the experiment still serves as a useful tool to assess the particle formation mechanism and kinetics.
Figure 2. UV-Visible spectra following the formation of Ag NPs during the course of the reaction. The arrow indicates the evolution and shift of the SPR band.
After the initial synthesis of the Ag NPs, there is a large excess of acrylate molecule and other precursors left in solution with the Ag NPs. Excess sodium, chlorine, and acrylate molecules (a 21× excess in the synthesis) must all be removed before coating with Au. To prepare the particles for further processing or coating with Au, they are first purified by using a dialysis procedure. The particles are put into a dialysis membrane with 10,000 dalton molecular weight pore size. The membrane is submerged in distilled water for approximately 48 hours, with changing of the water about every 12 hours. This procedure effectively removed excess reactants in preparation for further processing of the Ag NPs without the need for centrifugation, or the observation of a change in particle size or morphology.
3.2. Deposition of Au Shell to Create Ag@Au NPs
In this section of the results and discussion, we coat the Ag particles prepared in the earlier section with a layer of Au of varying thickness. This coating is achieved in what is essentially a seeded growth reaction. Briefly, first the Ag NPs are brought to reflux, then dilute aqueous gold and sodium acrylate solutions are added simultaneously, dropwise, causing the Au to reduce at the Ag NP surface, causing a coating of Au to be formed. The primary challenge in this reaction is the propensity of Ag to be oxidized as Au is reduced during the coating. Such an occurrence can lead to either hollow Au particles as shown by Sun et al. (2002), or alloyed Au and Ag NPs which has been illustrated by Sun et al. (2004). In our own reaction, we believe that alloying or etching of the Ag NPs can be minimized through control of the concentration of gold being added, the rate that it is added, and by addition of the sodium acrylate capping and reducing agent. Here, the role of sodium acrylate is to cause the Au to become reduced before the Ag can be oxidized.
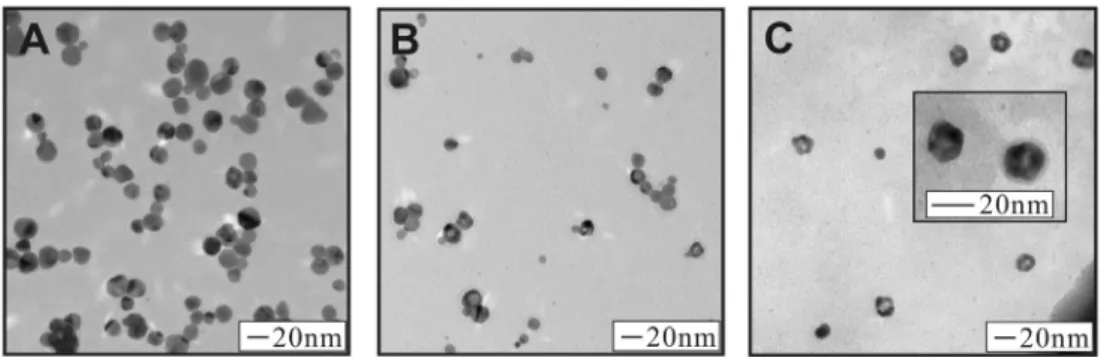
Figure 3 shows a series of TEM images of Ag@Au NPs synthesized using the method described above. For each sample, the amount of gold and sodium acrylate added was incrementally increased. Figure 3A shows a sample of Ag@Au NPs synthesized by adding
6.25×10⁻⁷ moles of Au and 1.38×10⁻⁴ moles of sodium acrylate (corresponding to 5% Au in terms of atomic composition). Inspection of the TEM image reveals particles with a uniform spherical morphology and in general, slightly darker color than the as-synthesized Ag NPs. This is likely a result of the addition of a thin layer of Au on the surface of the Ag particles. The size distribution of these particles is 17.5 ± 3.7nm. Figure 3B shows a sample of Ag@Au NPs synthesized by adding 1.88×10⁻⁶ moles of Au and 1.38×10⁻⁴ moles of sodium acrylate (corresponding to 15% Au in terms of atomic composition). The TEM image shows several particles with a spherical morphology, but now several particles are observed that have a lighter spherical center and darker outside ring. The observation of this dark outside and light center is inconsistent among different particles in the sample, some particles display no darker ring and light center at all, or some particles display simply a light spot near the periphery of the NP. We attribute this observation to the formation of an incomplete Au shell on the Ag particle surface. In effect, the round holes that are observed on the particles in the TEM image are a gap or hole in the Au shell, allowing us to see the Ag core inside the particle. This phenomenon has been observed previously by Liu et al. (2008), and could arise because of the difference in surface free energy on different faces of the silver particle, or because of the etching ability of gold. Indeed, some particles display multiple gaps in the Au shell at the particle surface resulting in a unique morphology for the NPs (see Supplementary Information Figures S4 and S5 for additional TEM images). The size distribution of these NPs is 16.3 ± 2.7nm. In addition, a few NPs are observed in the TEM image with much smaller size than the parent Ag NPs (~9nm), which could be attributed to the non-specific formation of Au NPs without coating on the Ag surface. The presence of these small particles was not observed in techniques such as UV-Vis, probably because of their low concentration as compared to the coated particles. Finally, Figure 3C shows a sample of Ag@Au NPs synthesized by adding 3.13×10⁻⁶ moles of Au and 1.38×10⁻⁴ moles of sodium acrylate (corresponding to 25% Au in terms of atomic composition). The TEM image reveals many particles with a light center and thick dark outside. Now the particles seem to have
adopted roughly hexagonal or pentagonal shapes, likely reflecting the tendency of Ag nanocrystals to be oriented in the twinned structure, templating the growth of Au at their surface. The size distribution of these particles is 17.5 ± 5.1nm. Among these three samples the particle sizes are generally smaller than the precursor Ag NP seeds (size of 20.5 ± 3.3nm). We attribute this size decrease to a small degree of etching of the silver surface at the initial reaction stage as the gold layer is deposited (2Ag0(s) + Au3+(aq) Æ 2Ag+(aq) + Au+(aq) and/or Ag0(s) + Au+(aq) Æ Ag+(aq) + Au0(s)). As the reaction progresses, the acrylate reducing agent plays a more significant role in reducing the gold as it is deposited on the particle surface, thereby preventing the entire silver core from being etched away.
Figure 3. TEM images for Ag@Au NPs. Atomic feeding ratio of: 5% Au (A), 15% Au (B), and 25% Au (C).
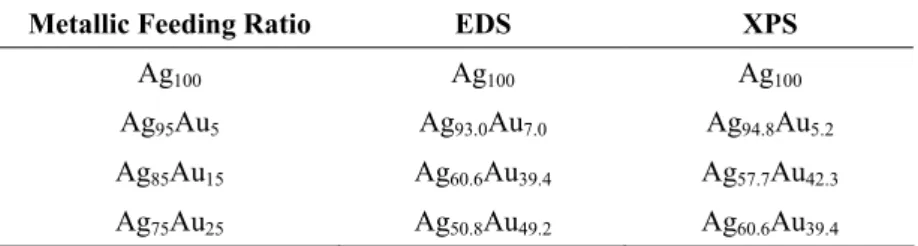
The composition of these NPs was analyzed using both EDS and XPS techniques. Figure 4 shows the XPS spectra taken for each Ag and Ag@Au NP sample for both the Ag 3d and the Au 4f regions. Table 1 shows the atomic feeding ratio for each sample as well as the composition as determined by EDS and XPS. The primary difference between the EDS and XPS techniques is that EDS could be used to determine the composition of several different particles individually, then an average could be taken of the composition, while for XPS a relatively large analysis area results in simultaneous analysis of several particles. For the NPs synthesized with 5% feeding ratio of Au, the composition is consistent among the metallic feeding ratio and both EDS and
XPS techniques. However, for the sample prepared with atomic feeding ratio of 15% Au, both EDS and XPS show a heightened amount of Au in the final sample (both ~40% Au), this is likely an effect of attenuation of the beam for EDS and XPS techniques, which have finite penetration depths of the sample, resulting in higher sensitivity to surface species, in this case Au at the surface of the core@shell structure. Finally the sample prepared with atomic feeding ratio of 25% Au also shows a heightened amount of Au in the determined composition for both EDS and XPS techniques, however there is a slight discrepancy between the compositions determined by XPS and EDS. This could arise from inhomogeneity in the prepared samples, or because of a difference in the relative penetration depths of each instrumental technique. The observation of the general decrease in the amount of Ag and the increase in the amount of Au is consistent with a core@shell structure with Ag on the inside of the particle and Au on the outside. It is important to note that for the case of addition of 25% Au by atomic feeding ratio, this amount of Au is sufficient to completely etch away all of the Ag metal, however we still detect the presence of Ag in our NP system. This observation reinforces our assertion that acrylate works to suppress the oxidation of Ag by Au and is key in forming Ag@Au structures instead of hollow Au shells.
Figure 4. XPS spectra for the Ag and Ag@Au NPs. A1: Ag3d area for Ag NPs, A2: Ag3d area for Ag@Au NPs with metallic feeding ratio of 5% Au, A3: Ag3d area for Ag@Au NPs with metallic feeding ratio of 15% Au, and A4: Ag3d area for Ag@Au NPs with metallic feeding ratio of 25% Au. B1: Au4f area for Ag@Au NPs with metallic feeding ratio of 5% Au, B2: Au4f area
for Ag@Au NPs with metallic feeding ratio of 15% Au, and B3: Au4f area for Ag@Au NPs with metallic feeding ratio of 25% Au.
Table 1. Comparison of Metallic Feeding Ratio and EDS/XPS Determined Composition of Ag@Au NPs
Metallic Feeding Ratio EDS XPS
Ag100 Ag100 Ag100
Ag95Au5 Ag93.0Au7.0 Ag94.8Au5.2
Ag85Au15 Ag60.6Au39.4 Ag57.7Au42.3
Ag75Au25 Ag50.8Au49.2 Ag60.6Au39.4
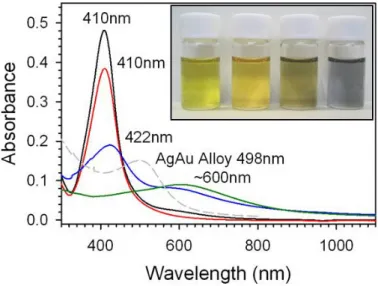
We also collected photographs and UV-Vis spectra for the samples of Ag@Au NPs, to study the unique optical properties for these materials. The inset to Figure 5 shows a photograph for Ag and Ag@Au NPs with Au content increasing from left to right for each sample in the image (Atomic feeding ratio 0, 5, 15, and 25% respectively). The Ag particles are a yellow color. The Ag@Au particles with 5% addition of Au are a similar yellow color with a barely perceptible amber tone in the sample. Next, the Ag@Au particles with 15% addition of Au are a grayish-brown color. Finally the Ag@Au particles with 25% addition of Au are a purple color. It is important to note that these samples (including the Ag NP seed solution) were all stable for several months of storage at ambient conditions with no signs of precipitation or changes in the coloring of the solution. Figure 5 shows the UV-Vis spectra collected for each sample of Ag and Ag@Au NPs. The black spectrum is that for the as-synthesized Ag NPs with SPR peak maximum of 410nm. The red spectrum is that for the Ag@Au NPs with 5% addition of Au. This spectrum also has a peak maximum of 410nm, illustrating the retention of the NP size after coating with a small amount of Au. However, now the SPR band intensity has decreased, illustrating the suppression of the SPR band by the coating with Au. The blue spectrum is that for the Ag@Au NPs with 15% addition of Au. This spectrum now has two main bands. The primary band at 422nm has shifted to higher wavelength than that for Ag particles, which could indicate the formation of an alloy at the interface of Au and Ag in the NP. This phenomenon is expected
based on the close lattice matching and a study performed by Shibata et al. (2002) which found that Ag and Au spontaneously form an alloy at the interface (within ~2nm) of the two metals at room temperature as a function of the size of the NP. In addition, this bands intensity is drastically decreased from that of the earlier samples. A new band has also formed around 600nm, which is indicative of the increasing amount of Au in the sample being coated on the surface of the Ag particles. The green spectrum is for the Ag@Au NPs with 25% Au added, the original Ag peak is now completely suppressed, and a long wavelength band has formed around 610nm. This long wavelength band for Au is significantly shifted to higher wavelength in the UV-Vis spectrum than is typically observed for solid Au NPs (~525nm). This observation is consistent with what has been observed by other researchers including Sun et al. (2002, 2004) who synthesized completely hollow Au nanoshells templated from Ag NPs. The red-shifted SPR band of these Au shells was found to depend highly on the thickness of the Au shell (with thicker shells being blue-shifted) and the refractive index of the liquid medium (with higher refractive index causing a red-shift in the SPR peak). In our own study, the red-shift of the SPR band for Au is a result of the Au shell formation over the Ag core, in this case the SPR band from the Au shell becomes red-shifted from the solid Au particle peak, however the presence of the solid Ag core limits the extent of this red-shift (in general a core with higher refractive index would cause a blue-shift). Finally the grey dashed line spectrum is for a sample of NPs in which we purposely formed an alloy. For this sample we added equal amounts of Au and Ag in an identical procedure to the synthesis of Ag NPs, resulting in alloyed AgAu nanoparticles. The characteristics of this spectrum are different from the other spectra, illustrating the unique optical properties of the Ag@Au NPs. The alloyed AgAu NPs show a peak maximum at 498nm, which is between that for typical Ag and Au monometallic NPs (Ag: ~410nm, Au: ~525nm). In addition, the alloy NP sample shows only one peak, whereas the Ag@Au samples show two distinct peaks, the characteristics of which are dependent on the amount of Au added in the coating procedure.
Figure 5. UV-Vis spectra for Ag and Ag@Au NPs prepared with increasing Au content, as-synthesized Ag NPs (black spectrum), 5% Au atomic feeding ratio (red), 15% Au atomic feeding ratio (blue), 25% Au atomic feeding ratio (green), and a AgAu NP alloy (grey dashed-line). The inset shows the respective photographs of the Ag and Ag@Au NPs.
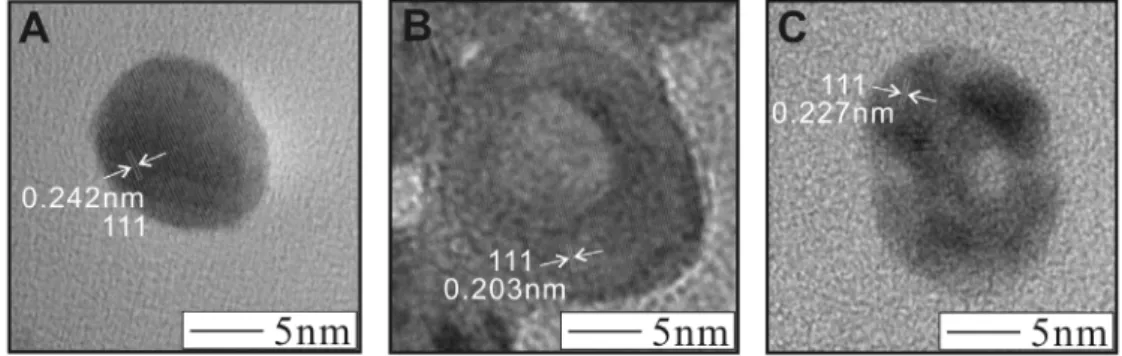
High resolution TEM analysis was used to study the crystalline properties and atomic structure of the Ag@Au NPs. Figure 6 shows HR-TEM images collected for each sample of Ag@Au. Figure 6A shows the high resolution image of a single particle of Ag@Au with atomic feeding ratio of 5% Au. In this image the lattice planes are clearly observed, showing the single crystalline nature of the material. In addition, we used the visualization of the lattice fringes to calculate the interlayer spacing. For this sample we calculated an interlayer spacing of 0.242nm, which corresponds closely to the (111) lattice plane spacing for both Ag (0.236nm) and Au (0.235nm). The interlayer distance for the (111) planes of Ag and Au are very similar, which helps in forming the Ag@Au core-shell structure, yet the measured interlayer distance is slightly higher than the reference values, which could be a result of the nanoscale size of the particles, or disordering of the atoms at the NP surface. Figure 6B shows the HR-TEM image of a single particle of Ag@Au prepared with atomic feeding ratio of 15% Au. In this image we can still clearly observe the lattice planes, but now we see a lighter center for the NP surrounded by a darker outside ring. We calculated the interlayer spacing both in the lighter center area, and also the outer darker area, yet the interlayer spacing was consistent between both areas. The
calculated interlayer distance was 0.203nm which corresponds to the (111) plane for Au or Ag. This value is slightly lower than the reference values for the interlayer distance of Au and Ag (111) planes of symmetry. We attribute this to a slight disordering of the atoms at the nanoscale surface. Figure 6C shows the HR-TEM image of a single NP of Ag@Au prepared with atomic feeding ratio of 25% Au. In this image the lattice fringes can still be observed, but now they seem to be non-uniform in direction, with lattice planes pointing in several different directions within the crystal. A central lighter area can be observed in this sample with a darker, non-uniformly colored outside area. The measured interlayer spacing was 0.227nm, which corresponds to the (111) lattice plane for Au or Ag. The measured value is slightly depressed as compared to the reference values for interlayer spacing of (111) planes for Ag or Au, but has increased over the previous sample. We attribute this to an increase in the Au content of the NP, causing a more ordered lattice for the particle, which results in an increase in the interlayer spacing. Based on these results, it is likely that a small amount of Au added into the surface of the Ag particle causes a small degree of disordering of the surface atoms in the NP, despite the close lattice spacings for Ag and Au. As more Au is added into the particle surface, the lattice becomes progressively more disordered, until a relatively thick Au shell has formed, at which point the lattice becomes more ordered again, which is consistent with the observations in these HR-TEM images.
Figure 6. HR-TEM images for Ag@Au NPs synthesized with atomic feeding ratio of 5% Au (A), 15% Au (B), and 25% Au (C).
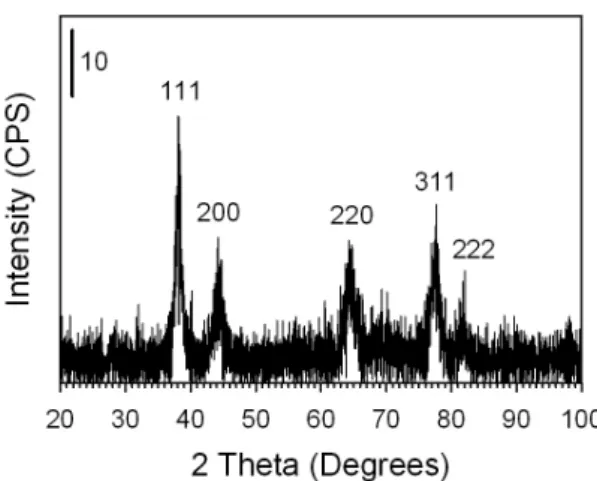
In order to address the crystalline nature of the nanomaterials we performed XRD analysis on the Ag@Au NPs that were prepared with atomic feeding ratio of 25% Au. Figure 7 shows the XRD spectrum collected for the Ag@Au NPs. There are several lattice planes observed including (111) (2θ=38.16 degree), (200) (2θ=44.34), (220) (2θ=64.50), (311) (2θ=77.50), and (222) (2θ=81.66), which all correspond closely to the reference lattice planes for Ag and Au. The interlayer distances for Ag and Au are quite close with a discrepancy too small to be distinguished through traditional XRD analysis. However, this data can be used to determine the particle grain size through the Scherrer equation (
τ
=Kλ
Bcosθ
, where τ is the mean grain size, K is the shape factor [0.9], λ is the X-ray wavelength [1.54Å], B is the full width at half maximum, and θ is the Bragg angle). Using this equation and the (111) peak of our Ag@Au NPs, we calculated a mean particle size of 18.8nm, which corresponds very closely with the TEM determined value of 17.5 ± 5.1nm. This data confirms that our Ag@Au NPs are single crystals, and that the coating of the Au on the Ag particles did not result in small individual crystals of Au separate from the Ag crystals.Figure 7. XRD spectrum for Ag@Au NPs prepared using atomic feeding ratio of 25% Au. In order to gain a diagnostic assessment of the evolution of the optical properties for the Ag@Au NPs during synthesis, as well as the role that the acrylate reducing and capping species
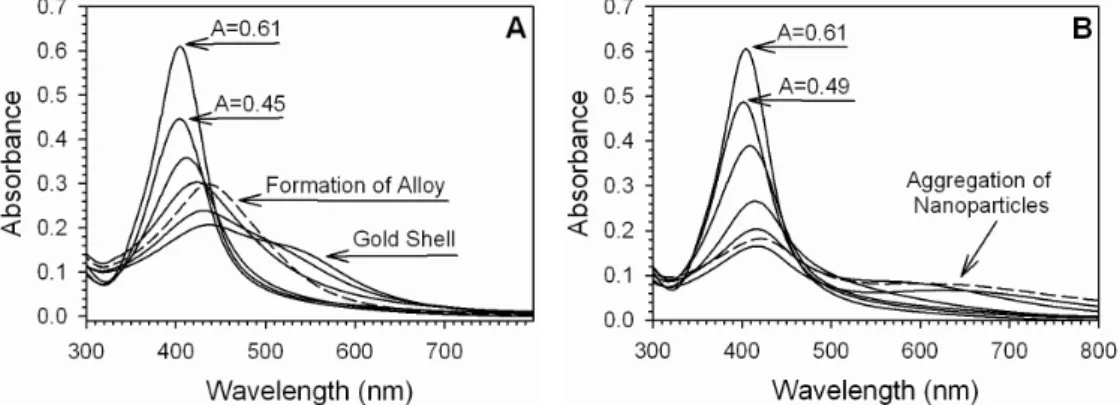
plays, we performed an in-situ collection of Ag@Au NPs during the coating experiment for a dilute addition of Au to Ag NPs. Here, we performed two simultaneous experiments under identical conditions. In the first experiment (Figure 8A), a predetermined amount of Au and acrylate were added to Ag NPs as they were refluxed, then a 1ml sample was extracted for UV-Vis and TEM analysis. In the second experiment (Figure 8B), an identical amount of Au was added, but no acrylate was introduced (reaction volume was kept consistent by adding water in the place of the acrylate solution). Figure 8 shows the UV-Vis spectra collected for the addition of Au and sodium acrylate to Ag NPs and for the addition of Au to Ag NPs during reflux. The most intense spectrum is that for the as-synthesized Ag particles. Next, 2.04×10⁻⁷ moles of Au are added (along with 3.85×10⁻⁵ moles of acrylate for Figure 8A). In Figure 8A, the peak position has remained constant but the intensity of the peak has decreased as a result of coating of the Ag particles with Au to an absorbance of 0.45. For Figure 8B though, the SPR band has decreased in intensity less than for the case of Figure 8A, to a value of 0.49, and also the peak has shifted to slightly lower wavelength. This observation is consistent with the etching of Ag by Au as a decrease in the Ag particle size causes a blue shift in the SPR band. The SPR band also did not decrease as much as for the case of adding acrylate because the Au etched the Ag surface away, but did not form an SPR dampening Au shell on the Ag surface. This observation illustrates the role that acrylate places in reducing Au at the surface of the particle and preserving the Ag core. Addition of another 2.04×10⁻⁷ moles of Au (and 3.85×10⁻⁵ moles of acrylate for Figure 8A) causes the peak intensities to decrease even more and the peak to shift towards higher wavelength. Continued additions (a total of five) of Au and acrylate as above causes the SPR band to continue to decrease in intensity and shift towards higher wavelength. Eventually a new peak forms at extended wavelength which is characteristic for Au. In Figure 8A, this extended SPR band did not continue to shift as far as for the earlier cases of synthesizing Ag@Au NPs, as the amount of Au used in this experiment was less. But for Figure 8B, a highly extended band forms, likely a result of forming hollowed Au shells, or from aggregation of the nanomaterials.
The final dashed line spectrum shows the result of refluxing the particles for an extended amount of time after the final addition of Au and acrylate (20 minutes). In Figure 8A, the SPR band in the Ag region grows in intensity, and the Au shoulder disappears, likely a result of alloy formation in the particle induced by the temperature of the reaction and the extended reaction time. For Figure 8B, the extended SPR band remains as the formation of hollowed Au shells or aggregation is irreversible. These observations reveal the further role of acrylate as a protecting agent, preventing aggregation and protecting the NPs from non-uniform growth at the surface (see Supplementary Information Figures S6 and S7 for the corresponding TEM images of the extracted samples). An experiment in which an increased amount of gold and sodium acrylate was added was also performed, which showed an enhanced alloy formation and more pronounced extended stretching bands in the UV-Vis spectra. Both the UV-Vis and corresponding TEM images are shown in Supplementary Information Figures S8 and S9, respectively.
Figure 8. A: UV-Vis spectra collected for the dilute addition of Au and acrylate to Ag NPs in an
in-situ coating experiment. B: UV-Visible spectra collected for the dilute addition of Au to Ag
NPs in an in-situ coating experiment which excluded the use of sodium acrylate. The solid line spectra represent samples taken periodically throughout the coating reaction. The dashed line spectra represent the sample taken after an extended 20 minutes reaction time.
4. Conclusions
In conclusion, we have demonstrated the synthesis of Ag NPs in aqueous phase capped in acrylate monolayers with a size of 20.5 ± 3.3nm. The Ag NP size and monodispersity benefitted by starting with a silver hydroxide precursor, which has not been shown before. These Ag NPs
were then coated with a Au shell of variable thickness. The etching of the Ag by Au was restricted by simultaneous addition of sodium acrylate as a reducing and encapsulation agent. The resulting nanostructures were shown to be primarily Ag cores with distinct Au shells, the formation of either hollow Au shells or alloyed materials was not observed. Despite the fact that definitive elucidation of a true Ag@Au nanostructure has historically been difficult, namely because of the close lattice spacing for the materials and the much higher density of Au than for Ag, the aggregate of characterization techniques in this study points to the formation of true Ag@Au NPs. These materials are expected to find use as probes for the detection of bio-molecular interactions such as those between complementary stranded DNA, or antibody-antigen interactions, among others. The tenability of the surface plasmon resonance band based on the thickness of the Au shell provides an effective rout for tuning the optical activity of the biological nano-probes. Such work is ongoing and is part of our future interests and studies.
Acknowledgements
Derrick Mott gratefully acknowledges support by the Japan Society for the Promotion of Science (JSPS) fellowship. We thank Dr. Jinwang Li for his assistance in the use of TGA instrumentation, Nobuaki Ito for assistance in the use of XPS instrumentation, and Koichi Higashimine for assistance in the use of TEM and HR-TEM instrumentation.
Supplementary Information
Aqueous Synthesis and Characterization of Ag and Ag@Au
Nanoparticles: Addressing Challenges in Size, Monodispersity,
and Structure
Derrick Mott, Nguyen T. B. Thuy, Yoshiya Aoki and Shinya Maenosono*
*To whom correspondence should be addressed. Email: [email protected]
Japan Advanced Institute of Science and Technology, School of Materials Science, 1-1 Asahidai, Nomi, Ishikawa 923-1292, Japan
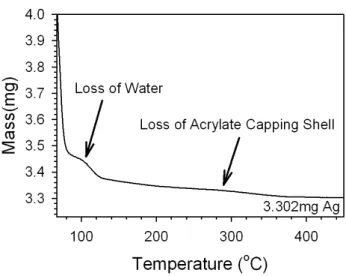
Figure S1. TGA performed for Ag NPs. The synthesis was scaled up by a factor of 4 to produce a reliable mass of NPs in the analysis. The NPs were precipitated by salting out, the precipitate was collected and rinsed in water, then ethanol before analysis with TGA. The sample was heated at a rate of 10°C/min from 25°C to 600°C. The final sample mass was 3.302mg of silver, which was used to calculate the synthetic yield as well as the extinction coefficient. The low temperature mass loss reflects evaporation of ethanol used to clean the NPs.
A B C
D E F
G
Figure S2. TEM images of Ag NPs taken throughout their synthesis. A: 5 minutes reaction time, B: 10 minutes reaction time, C: 20 minutes reaction time, D: 30 minutes reaction time, E: 40 minutes reaction time, F: 50 minutes reaction time, G: 60 minutes reaction time.
Assessment of the rate of formation of silver nanoparticles
A diagnostic assessment of the kinetic rate of formation of Ag NPs could be achieved by plotting the peak maxima vs. time of reaction (from Figure 3). We found that the absorbance changed linearly as a function of time in the synthesis indicating the constant kinetic rate of formation of particles. The kinetic rate of formation could be expressed in the formula y=9.484×10⁻⁵x
where y is the absorbance of the particles and x is the time of synthesis in seconds. At the end of this experiment, the reaction had not reached completion in terms of consumption of Ag precursor, as evidenced by the continued increase in SPR band for this sample, and the fact that the synthetic yield is about 62% in terms of conversion of Ag precursor to Ag particles.
Figure S3. Plot of the increase in SPR band intensity at 420nm as a function of time during the synthesis of Ag NPs. The red line represents the linear regression of the data. In this case a linear regression is found as the reaction time was not sufficient to completely consume the Ag precursor. The inset linear equations are those for both minutes and seconds of reaction time.
Figure S4. Additional HR-TEM images for Ag@Au NPs synthesized with atomic feeding ratio of 15% Au showing NPs with gaps or holes in the Au shell of the nanostructures.
A B C
Figure S5. HR-TEM study for an Ag@Au NP synthesized with atomic feeding ratio of 15% Au. By applying an intense electron beam to a single particle, the core@shell morphology could be observed through the rupture of the Au shell, and the bursting (boiling) of the Ag core contained inside. In A, the Ag@Au NP at the lower left of the image has a small hole in the Au shell. In image B, application of a moderate strength electron beam causes the Au shell to start to peel back from the hole in the particle surface. The formation of a diamond shape in the shell is indicative of splitting of the Au shell. Finally in image C, application of an intense electron beam has caused the Au shell to rupture completely, the collapsed Au shell is now observed as the dark ring. In addition the light material surrounding the remains of the Au shell is the Ag metal that has melted under the intense beam and has seeped to the area surrounding the particle. Such an observation is an excellent visual diagnostic for assessing the core@shell structure.
UV-Vis and TEM Monitoring of the Coating of Silver with Gold
Figure S6 shows the TEM images collected for dilute in-situ addition of Au and acrylate to Ag NPs in the coating experiment. These TEM images correspond to the UV-Vis spectra collected in Figure 8A. Figure S6A shows the as-synthesized Ag NPs used in the experiment. Figure S6B, C, and D show the TEM images of the particles with increasing additions of Au (each addition is 2.04×10⁻⁷ moles of Au). The TEM images for addition of more than 6.11×10⁻⁷ moles of Au is not shown because the simultaneous addition of sodium acrylate causes the TEM image to become obscured at higher concentrations.
A B C
D
Figure S6. TEM images collected for the in-situ addition of Au to Ag NPs in the coating experiment for dilute addition of Au and sodium acrylate. As-synthesized Ag NPs (A), addition of 2.04×10⁻⁷ moles of Au (B), 4.07×10⁻⁷ (C), and 6.11×10⁻⁷ (D).
Figure S7 shows the TEM images collected for the dilute coating of Ag NPs with Au. These TEM images correspond to the UV-Vis spectra taken in Figure 8B. In this experiment,
sodium acrylate was excluded, which allowed the collection of TEM images for each sample because of the lower concentration of organic material (which lead to clearer images). Close observation of the TEM images reveals that the particles eventually formed very light centers with a thin outer layer with darker color, as for those observed in Figure S7E, these dark outer layers seem to get thicker as more Au is added to the solution as observed in Figure S7F.
A B C
D E F
G
Figure S7. TEM images collected for the dilute addition of Au to Ag NPs in an in-situ coating experiment with the exclusion of sodium acrylate. As-synthesized Ag NPs (A), addition of 2.04×10⁻⁷ moles of Au (B), 4.07×10⁻⁷ (C), 6.11×10⁻⁷ (D), 8.15×10⁻⁷ (E), 1.02×10⁻⁶ (F), and an extended reaction time after the final addition of Au, 20 minutes (G).
We followed the gradual coating of Ag NPs with Au over time, and with increasing content of Au in the crystal by sampling the reaction solution periodically. In this experiment we brought the Ag NPs to reflux, then added a predetermined amount of Au and acrylate (both in separate solutions), then we extracted samples from the refluxing solution to analyze with UV-Vis and TEM. Figure S8 shows the UV-UV-Visible spectra collected for the gradual coating of Ag NPs with a relatively high concentration of Au. We first observed the well defined SPR band for the as-synthesized Ag NPs. Next 2.23×10⁻⁷ moles of Au are added (in a 0.5ml solution) causing the SPR band to slightly decrease in intensity and shift to slightly lower wavelength. Next another addition of 2.23×10⁻⁷ moles of Au are added (in a 0.5ml solution) which causes the SPR band to decrease even more in intensity and now shift to higher wavelength. After this 4.46×10⁻⁷ moles of Au were added (in a 1ml solution) which caused the SPR band to further decrease in intensity, shift to higher wavelength, and also increase in peak width.
Figure S8. UV-Visible spectra taken for samples of Ag@Au with increasing amounts of Au added.
The addition of Au and acrylate solutions and sampling of the reacting mixture was repeated until a total of 4.46×10⁻⁶ moles of Au had been added (contained in 10ml solutions). In general we observed the further shifting of the SPR band to higher wavelength and the development of a new
peak at around 625nm or so. With the continued addition of Au solution, this new peak grew in intensity and eventually began to shift back towards lower wavelength. It is likely that the large amount of Au added in this experiment caused the Ag particles to become partial alloys, and eventually become coated in a very thick layer of Au, as evidenced by the emergence of the new peak at higher wavelength, and the shift towards lower wavelength at very high concentrations of Au.
In Figure S9 we show the TEM images collected for the coating of Ag NPs by Au. These TEM images correspond to the UV-Vis spectra collected in Figure S8. Figure S9A shows the TEM image of the as-synthesized Ag NPs, then Au solution is added in the in-situ coating of Ag NPs with Au. Figure S9B and S9C show a slight increase in particle size distribution, with the particle morphology remaining constant. Figures S9D to S9I show particles with a lighter center and darker colored outside of the particles, and as more Au solution is added, the overall particle size seems to increase. (Additional TEM images for samples prepared with more Au were not collected because the simultaneous addition of sodium acrylate in the reaction eventually causes the TEM image to be completely obscured by the organic material).
A B C
D E F
G H I Figure S9. TEM images collected for Ag particles coated with varying amounts of Au in an
in-situ collection reaction. As-synthesized Ag NPs (A), 2.23×10⁻⁷ moles Au added (B), 4.46×10⁻⁷ (C), 8.92×10⁻⁷ (D), 1.34×10⁻⁶ (E), 1.78×10⁻⁶ (F), 2.23×10⁻⁶ (G), 2.68×10⁻⁶ (H), and 3.12×10⁻⁶ (I).
References
Cai, M. M., Chem, J. L. & Zhou, J. 2004 Reduction and morphology of silver nanoparticles via liquid-liquid method. Appl. Surf. Sci. 226, 422-426. (DOI: 10.1016/j.apsusc.2003.10.046) Cao, M. H. Wang, Y. H. Guo, C. X. Qi, Y. J. & Hu, W. 2004 Preparation of ultrahigh-aspect-ratio
hydroxyapatite nanofibers in reverse micelles under hydrothermal conditions. Langmuir 20, 4784-4786. (DOI: 10.1021/la0498197)
Cao, Y-W. Jin, R. & Mirkin, C. A. 2001 DNA-modified core-shell Ag/Au nanoparticles. J. Am.
Chem. Soc. 123, 7961-7962. (DOI: 10.1021/ja011342n)
Cavicchioli, M., Varanda, L. C., Massabni, A. C. & Melnikov, P. 2005 Silver nanoparticles synthesized by thermal reduction of a silver(I)-aspartame complex in inert atmosphere.
Mater. Lett. 59, 3585-3589. (DOI: 10.1016/j.matlet.2005.07.001)
Cui, Y., Ren, B., Yao, J-L., Gu, R-A. & Tian, Z-Q. 2006 Synthesis of AgcoreAushell bimetallic nanoparticles for immunoassay based on surface-enhanced Raman spectroscopy. J. Phys.
Chem. B 110, 4002-4006. (DOI: 10.1021/jp056203x)
Evanoff, D. D. & Chumanov, G. 2005 Synthesis and optical properties of silver nanoparticles and arrays. ChemPhysChem 6, 1221-1231. (DOI: 10.1002/cphc.200500113)
He, S., Yao, J., Jiang, P., Shi, D., Zhang, H., Xie, S., Pang, S. & Gao, H. 2001 Formation of silver nanoparticles and self-assembled two-dimensional ordered superlattice. Langmuir 17, 1571-1575. (DOI: 10.1021/la001239w)
Hoppe, C. E., Lazzari, M., Pardinas-Blanco, I. & Lopez-Quintela, M. A. 2006 One-step synthesis of gold and silver hydrosols using poly(N-vinyl-2-pyrrolidone) as a reducing agent.
Langmuir 22, 7027-7034. (DOI: 10.1021/la060885d)
Hussain, I., Brust, M., Papworth, A. J. & Cooper, A. I. 2003 Preparation of acrylate-stabilized gold and silver hydrosols and gold-polymer composite films. Langmuir 19, 4831-4835. (DOI: 10.1021/la020710d)
Lin, X. Z., Teng, X. & Yang, H. 2003 Direct synthesis of narrowly dispersed silver nanoparticles using a single-source precursor. Langmuir 19, 10081-10085. (DOI: 10.1021/la035185c) Link, S., Wang, Z. L. & El-Sayed, M. A. 1999 Alloy formation of gold-silver nanoparticles and
the dependence of the plasmon absorption on their composition. J. Phys. Chem. B 103, 3529-3533. (DOI: 10.1021/jp990387w)
Liu, J. K., Wu, Q. S. & Ding, Y. P. 2005 Self-assembly and fluorescent modification of hydroxyapatite nanoribbon spherulites. Eur. J. Inorg. Chem. 20, 4145-4149. (DOI: 10.1002/ejic.200500207)
Liu, J-K., Yang, X-H. & Tian, X-G. 2008 Preparation of silver/hydroxyapatite nanocomposite spheres. Powder Technol. 184, 21-24. (DOI: 10.1016/j.powtec.2007.07.034)
Liu, Y-C. & Lin, L-H. 2004 New pathway for the synthesis of ultrafine silver nanoparticles from bulk silver substrates in aqueous solutions by sonochemical methods. Electrochem. Commun. 6, 1163-1168. (DOI: 10.1016/j.elecom.2004.09.010)
Loncaric, M., Sancho-Parramon, J., Pavlovic, M., Zorc, H., Dubcek, P., Turkovic, A., Bernstorff, S., Jakopic, G. & Haase, A. 2010 Optical and structural characterization of silver islands films on glass substrates. Vacuum 84, 188-192. (DOI: 10.1016/j.vacuum.2009.04.014) Lu, L., Kobayashi, A., Tawa, K. & Ozaki, Y. 2006 Silver nanoplates with special shapes:
Controlled synthesis and their surface plasmon resonance and surface-enhanced Raman scattering properties. Chem. Mater. 18, 4894-4901. (DOI: 10.1021/cm0615875) Mohan, Y. M., Raju, K. M., Sambasivudu, K., Singh, S. & Sreedhar, B. 2007 Preparation of
acacia-stabilized silver nanoparticles: A green approach. J. Appl. Polym. Sci. 106, 3375-3381. (DOI: 10.1002/app.26979)
Nishimura, S., Takagaki, A., Maenosono, S. & Ebitani, K. 2010 In situ time-resolved XAFS study on the formation mechanism of Cu nanoparticles using Poly(N-vinyl-2-pyrrolidone) as a capping agent. Langmuir ASAP Article. (DOI: 10.1021/la904248z)
Panacek, A., Kvitek, L., Prucek, R., Kolar, M., Vecerova, R., Pizurova, N., Sharma, V. K., Nevenka, T. & Zboril, R. 2006 Silver colloid nanoparticles: Synthesis, characterization, and their antibacterial activity. J. Phys. Chem. B 110, 16284-16253. (DOI: 10.1021/jp063826h) Pillai, Z. S. & Kamat, P. V. 2004 What factors control the size and shape of silver nanoparticles
in the citrate ion reduction method? J. Phys. Chem. B 108, 945-951. (DOI: 10.1021/jp037018r)
Ren, X. L., Meng, X. W., Chen, D., Tang, F. Q. & Jiao, J. 2005 Using silver nanoparticle to enhance current response in biosensor.Biosens. Bioelectron. 21, 433-437. (DOI:
10.1016/j.bios.2004.08.052)
Sandmann, G., Dietz, H. & Plieth, W. 2000 Preparation of silver nanoparticles on ITO surfaces by a double-pulse method. J. Electroanal. Chem. 491, 78-86. (DOI:10.1016/S0022-0728(00)00306-5)
Sardar, R., Park, J-W. & Shumaker-Parry, J. S. 2007 Polymer-induced synthesis of stable gold and silver nanoparticles and subsequent ligand exchange in water. Langmuir 23, 11883-11889. (DOI: 10.1021/la702359g)
Sharma, V. K., Yngard, R. A. & Lin, Y. 2009 Silver nanoparticles: Green synthesis and their antimicrobial activites. Adv. Colloid Interf. Sci. 145, 83-96. (DOI:
10.1016/j.cis.2008.09.002)
Shibata, T., Bunker, B. A., Zhang, Z., Meisel, D., Vardeman, C. F. & Gezelter, J. D. 2002 Size-dependent spontaneous alloying of Au-Ag nanoparticles. J. Am. Chem. Soc. 124, 11989-11996. (DOI: 10.1021/ja26764r)
Shon, Y-S. & Cutler, E. 2004 Aqueous synthesis of alkanethiolate-protected Ag nanoparticles using bunte salts. Langmuir 20, 6626-6630. (DOI: 10.1021/la049417z)
Srnova-Sloufova, I., Lednicky, F., Gemperle, A. & Gemperlova, J. 2000 Core-shell (Ag)Au bimetallic nanoparticles: Analysis of transmission electron microscopy images.Langmuir 16,
9928-9935. (DOI: 10.1021/la0009588)
Sun, L., Zhang, Z. J. & Dang, H. X. 2003 A novel method for preparation of silver nanoparticles.
Mater. Lett. 57, 3874-3879. (DOI: 10.1016/S0167-577X(03)00232-5)
Sun, X. P. & Luo, Y. L. 2005 Preparation and size control of silver nanoparticles by a thermal method.Mater. Lett. 59, 3847-3850. (DOI: 10.1016/j.matlet.2005.07.021)
Sun, Y. & Xia, Y. 2002 Increased sensitivity of surface Plasmon resonance of gold nanoshells compared to that of gold solid colloids in response to environmental changes. Anal. Chem. 74, 5297-5305. (DOI: 10.1021/ac0258352)
Sun, Y. & Xia, Y. 2004 Mechanistic study on the replacement reaction between silver
nanostructures and chloroauric acid in aqueous medium.J. Am. Chem. Soc. 126, 3892-3901.
(DOI: 10.1021/ja039734c)
Sun, Y. P., Atorngitjawat, P. & Meziani, M. J. 2001 Preparation of silver nanoparticles via rapid expansion of water in carbon dioxide microemulsion into reductant solution.Langmuir 17,
5707-5710. (DOI: 10.1021/la0103057)
Taleb, A., Petit, C. & Pileni, M. P. 1997 Synthesis of highly monodisperse silver nanoparticles from AOT reverse micelles: A way to 2D and 3D self-organization.Chem. Mater. 9,
950-959. (DOI: 10.1021/cm960513y)
Taleb, A., Gusev, A. O., Silly, F., Charra, F. & Pileni, M. P. 2000 Local photon emission of self-assembled metal nanoparticles. Appl. Surf. Sci. 162/163, 553-558. (DOI:10.1016/S0169-4332(00)00503-1)
Wang, D. B., Song, C. X., Hu, Z. S. & Zhou, X. D. 2005 Synthesis of silver nanoparticles with flake-like shapes.Mater. Lett. 59, 1760-1763. (DOI: 10.1016/j.matlet.2005.01.061)
Wiley, B., Sun, Y. & Xia, Y. 2005 Polyol synthesis of silver nanostructures: Control of product morphology with Fe(II) or Fe(III) species.Langmuir 21, 8078-8080. (DOI:
10.1021/la050887i)
Wiley, B., Sun, Y. & Xia, Y. 2007 Synthesis of silver wanostructures with controlled shapes and properties. Acc. Chem. Res. 40, 1067-1076. (DOI: 10.1021/ar7000974)
Yang, J., Lee, J. Y. & Too, H-P. 2005 Core-shell Ag-Au nanoparticles from replacement reaction in organic medium.J. Phys. Chem. B 109, 19208-19212. (DOI: 10.1021/jp052242x)
Figure Captions:
Scheme 1: Reaction Rout for the Synthesis of Ag NPs and their Coating with Au.
Table 1. Comparison of Metallic Feeding Ratio and EDS/XPS Determined Composition of Ag@Au NPs
Figure 1. As-synthesized Ag NPs capped with the acrylate molecule, the inset to the image shows the size distribution of the Ag NPs (A). UV-Visible spectrum of the as-synthesized Ag NPs with peak maximum of 416nm (B).
Figure 2. UV-Visible spectra following the formation of Ag NPs during the course of the reaction. The arrow indicates the evolution and shift of the SPR band.
Figure 3. TEM images for Ag@Au NPs. Atomic feeding ratio of: 5% Au (A), 15% Au (B), and 25% Au (C).
Figure 4. XPS spectra for the Ag and Ag@Au NPs. A1: Ag3d area for Ag NPs, A2: Ag3d area for Ag@Au NPs with metallic feeding ratio of 5% Au, A3: Ag3d area for Ag@Au NPs with metallic feeding ratio of 15% Au, and A4: Ag3d area for Ag@Au NPs with metallic feeding ratio of 25% Au. B1: Au4f area for Ag@Au NPs with metallic feeding ratio of 5% Au, B2: Au4f area for Ag@Au NPs with metallic feeding ratio of 15% Au, and B3: Au4f area for Ag@Au NPs with metallic feeding ratio of 25% Au.
Figure 5. UV-Vis spectra for Ag and Ag@Au NPs prepared with increasing Au content, as-synthesized Ag NPs (black spectrum), 5% Au atomic feeding ratio (red), 15% Au atomic feeding ratio (blue), 25% Au atomic feeding ratio (green), and a AgAu NP alloy (grey dashed-line). The inset shows the respective photographs of the Ag and Ag@Au NPs.
Figure 6. HR-TEM images for Ag@Au NPs synthesized with atomic feeding ratio of 5% Au (A), 15% Au (B), and 25% Au (C).
Figure 7. XRD spectrum for Ag@Au NPs prepared using atomic feeding ratio of 25% Au.
Figure 8. A: UV-Vis spectra collected for the dilute addition of Au and acrylate to Ag NPs in an
in-situ coating experiment. B: UV-Visible spectra collected for the dilute addition of Au to Ag
NPs in an in-situ coating experiment which excluded the use of sodium acrylate. The solid line spectra represent samples taken periodically throughout the coating reaction. The dashed line spectra represent the sample taken after an extended 20 minutes reaction time.