1254 IEEE TRANSACTIONS ON PATTERN ANALYSIS AND MACHINE INTELLIGENCE, VOL. 20, NO. 11, NOVEMBER 1998
Short Papers
A Model of Saliency-Based Visual Attention
for Rapid Scene Analysis
Laurent Itti, Christof Koch, and Ernst Niebur
Abstract—A visual attention system, inspired by the behavior and the
neuronal architecture of the early primate visual system, is presented. Multiscale image features are combined into a single topographical saliency map. A dynamical neural network then selects attended locations in order of decreasing saliency. The system breaks down the complex problem of scene understanding by rapidly selecting, in a computationally efficient manner, conspicuous locations to be analyzed in detail.
Index Terms—Visual attention, scene analysis, feature extraction,
target detection, visual search.
———————— ! ———————— 1 INTRODUCTION
PRIMATES have a remarkable ability to interpret complex scenes in
real time, despite the limited speed of the neuronal hardware avail-able for such tasks. Intermediate and higher visual processes appear to select a subset of the available sensory information before further processing [1], most likely to reduce the complexity of scene analysis [2]. This selection appears to be implemented in the form of a spa-tially circumscribed region of the visual field, the so-called “focus of attention,” which scans the scene both in a rapid, bottom-up, sali-ency-driven, and task-independent manner as well as in a slower, top-down, volition-controlled, and task-dependent manner [2].
Models of attention include “dynamic routing” models, in which information from only a small region of the visual field can progress through the cortical visual hierarchy. The attended region is selected through dynamic modifications of cortical connectivity or through the establishment of specific temporal patterns of ac-tivity, under both top-down (task-dependent) and bottom-up (scene-dependent) control [3], [2], [1].
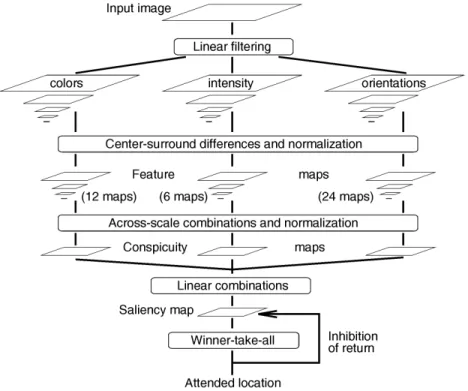
The model used here (Fig. 1) builds on a second biologically-plausible architecture, proposed by Koch and Ullman [4] and at the basis of several models [5], [6]. It is related to the so-called “feature integration theory,” explaining human visual search strategies [7]. Visual input is first decomposed into a set of topo-graphic feature maps. Different spatial locations then compete for saliency within each map, such that only locations which locally stand out from their surround can persist. All feature maps feed, in a purely bottom-up manner, into a master “saliency map,” which topographically codes for local conspicuity over the entire visual scene. In primates, such a map is believed to be located in the posterior parietal cortex [8] as well as in the various visual maps in the pulvinar nuclei of the thalamus [9]. The model’s saliency map is endowed with internal dynamics which generate attentional shifts. This model consequently represents a complete account of
bottom-up saliency and does not require any top-down guidance to shift attention. This framework provides a massively parallel method for the fast selection of a small number of interesting im-age locations to be analyzed by more complex and time-consuming object-recognition processes. Extending this approach in “guided-search,” feedback from higher cortical areas (e.g., knowledge about targets to be found) was used to weight the im-portance of different features [10], such that only those with high weights could reach higher processing levels.
2 MODEL
Input is provided in the form of static color images, usually digit-ized at 640 ¥ 480 resolution. Nine spatial scales are created using dyadic Gaussian pyramids [11], which progressively low-pass filter and subsample the input image, yielding horizontal and ver-tical image-reduction factors ranging from 1:1 (scale zero) to 1:256 (scale eight) in eight octaves.
Each feature is computed by a set of linear “center-surround” operations akin to visual receptive fields (Fig. 1): Typical visual neurons are most sensitive in a small region of the visual space (the center), while stimuli presented in a broader, weaker antago-nistic region concentric with the center (the surround) inhibit the neuronal response. Such an architecture, sensitive to local spatial discontinuities, is particularly well-suited to detecting locations which stand out from their surround and is a general computa-tional principle in the retina, lateral geniculate nucleus, and pri-mary visual cortex [12]. Center-surround is implemented in the model as the difference between fine and coarse scales: The center is a pixel at scale c Œ {2, 3, 4}, and the surround is the corresponding pixel at scale s = c + d, with d Œ {3, 4}. The across-scale difference between two maps, denoted “!” below, is obtained by interpolation to the finer scale and point-by-point subtraction. Using several scales not only for c but also for d = s - c yields truly multiscale feature extraction, by including different size ratios between the center and surround regions (contrary to previously used fixed ratios [5]).
2.1 Extraction of Early Visual Features
With r, g, and b being the red, green, and blue channels of the in-put image, an intensity image I is obtained as I = (r + g + b)/3. I is
0162-8828/98/$10.00 © 1998 IEEE !!!!!!!!!!!!!!!!
•!L. Itti and C. Koch are with the Computation and Neural Systems Pro-gram, California Institute of Technology—139-74, Pasadena, CA 91125.
!
E-mail: {itti, koch}@klab.caltech.edu.
•!E. Niebur is with the Johns Hopkins University, Krieger Mind/Brain Insti-tute, Baltimore, MD 21218. E-mail: [email protected].
Manuscript received 5 Feb. 1997; revised 10 Aug. 1998. Recommended for accep-tance by D. Geiger.
For information on obtaining reprints of this article, please send e-mail to: [email protected], and reference IEEECS Log Number 107349.
1254
IEEE TRANSACTIONS ON PATTERN ANALYSIS AND MACHINE INTELLIGENCE, VOL. 20, NO. 11, NOVEMBER 1998
Short Papers
A Model of Saliency-Based Visual Attention
for Rapid Scene Analysis
Laurent Itti, Christof Koch, and Ernst Niebur
Abstract—A visual attention system, inspired by the behavior and the
neuronal architecture of the early primate visual system, is presented.
Multiscale image features are combined into a single topographical
saliency map. A dynamical neural network then selects attended
locations in order of decreasing saliency. The system breaks down the
complex problem of scene understanding by rapidly selecting, in a
computationally efficient manner, conspicuous locations to be analyzed
in detail.
Index Terms—Visual attention, scene analysis, feature extraction,
target detection, visual search.
————————
!
————————
1 I
NTRODUCTION
P
RIMATES
have a remarkable ability to interpret complex scenes in
real time, despite the limited speed of the neuronal hardware
avail-able for such tasks. Intermediate and higher visual processes appear
to select a subset of the available sensory information before further
processing [1], most likely to reduce the complexity of scene analysis
[2]. This selection appears to be implemented in the form of a
spa-tially circumscribed region of the visual field, the so-called “focus of
attention,” which scans the scene both in a rapid, bottom-up,
sali-ency-driven, and task-independent manner as well as in a slower,
top-down, volition-controlled, and task-dependent manner [2].
Models of attention include “dynamic routing” models, in
which information from only a small region of the visual field can
progress through the cortical visual hierarchy. The attended region
is selected through dynamic modifications of cortical connectivity
or through the establishment of specific temporal patterns of
ac-tivity, under both top-down (task-dependent) and bottom-up
(scene-dependent) control [3], [2], [1].
The model used here (Fig. 1) builds on a second
biologically-plausible architecture, proposed by Koch and Ullman [4] and at
the basis of several models [5], [6]. It is related to the so-called
“feature integration theory,” explaining human visual search
strategies [7]. Visual input is first decomposed into a set of
topo-graphic feature maps. Different spatial locations then compete for
saliency within each map, such that only locations which locally
stand out from their surround can persist. All feature maps feed, in
a purely bottom-up manner, into a master “saliency map,” which
topographically codes for local conspicuity over the entire visual
scene. In primates, such a map is believed to be located in the
posterior parietal cortex [8] as well as in the various visual maps in
the pulvinar nuclei of the thalamus [9]. The model’s saliency map
is endowed with internal dynamics which generate attentional
shifts. This model consequently represents a complete account of
bottom-up saliency and does not require any top-down guidance
to shift attention. This framework provides a massively parallel
method for the fast selection of a small number of interesting
im-age locations to be analyzed by more complex and
time-consuming object-recognition processes. Extending this approach
in “guided-search,” feedback from higher cortical areas (e.g.,
knowledge about targets to be found) was used to weight the
im-portance of different features [10], such that only those with high
weights could reach higher processing levels.
2 M
ODEL
Input is provided in the form of static color images, usually
digit-ized at 640
¥ 480 resolution. Nine spatial scales are created using
dyadic Gaussian pyramids [11], which progressively low-pass
filter and subsample the input image, yielding horizontal and
ver-tical image-reduction factors ranging from 1:1 (scale zero) to 1:256
(scale eight) in eight octaves.
Each feature is computed by a set of linear “center-surround”
operations akin to visual receptive fields (Fig. 1): Typical visual
neurons are most sensitive in a small region of the visual space
(the center), while stimuli presented in a broader, weaker
antago-nistic region concentric with the center (the surround) inhibit the
neuronal response. Such an architecture, sensitive to local spatial
discontinuities, is particularly well-suited to detecting locations
which stand out from their surround and is a general
computa-tional principle in the retina, lateral geniculate nucleus, and
pri-mary visual cortex [12]. Center-surround is implemented in the
model as the difference between fine and coarse scales: The center
is a pixel at scale c Π{2, 3, 4}, and the surround is the corresponding
pixel at scale s = c +
d, with d Π{3, 4}. The across-scale difference
between two maps, denoted “!” below, is obtained by interpolation
to the finer scale and point-by-point subtraction. Using several scales
not only for c but also for
d = s - c yields truly multiscale feature
extraction, by including different size ratios between the center and
surround regions (contrary to previously used fixed ratios [5]).
2.1 Extraction of Early Visual Features
With r, g, and b being the red, green, and blue channels of the
in-put image, an intensity image I is obtained as I = (r + g + b)/3. I is
0162-8828/98/$10.00 © 1998 IEEE
!!!!!!!!!!!!!!!!
•!
L. Itti and C. Koch are with the Computation and Neural Systems
Pro-gram, California Institute of Technology—139-74, Pasadena, CA 91125.
!
E-mail:
{itti, koch}@klab.caltech.edu
.
•!
E. Niebur is with the Johns Hopkins University, Krieger Mind/Brain
Insti-tute, Baltimore, MD 21218. E-mail: [email protected].
Manuscript received 5 Feb. 1997; revised 10 Aug. 1998. Recommended for
accep-tance by D. Geiger.
For information on obtaining reprints of this article, please send e-mail to:
[email protected], and reference IEEECS Log Number 107349.
Fig. 1. General architecture of the model.
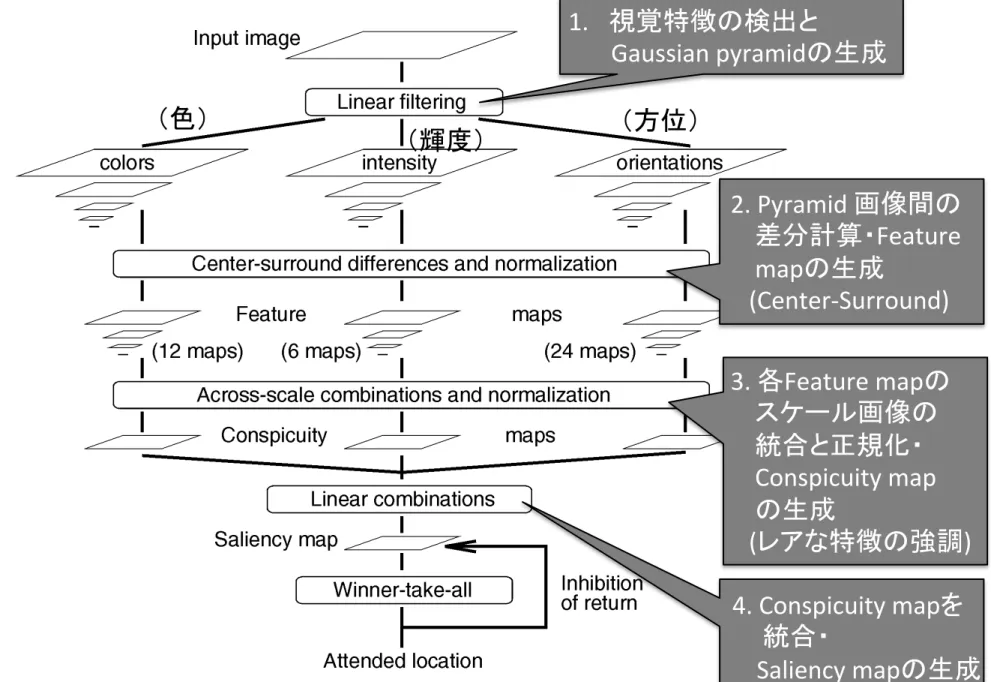
処理の流れ
1. 視覚特徴の検出と
Gaussian pyramidの生成
2. Pyramid 画像間の
差分計算・Feature
mapの生成
(Center-‐Surround)
3. 各Feature mapの
スケール画像の
統合と正規化・
Conspicuity map
の生成
(レアな特徴の強調)
(色)
(輝度)
(方位)
4. Conspicuity mapを
統合・
Saliency mapの生成
1254 IEEE TRANSACTIONS ON PATTERN ANALYSIS AND MACHINE INTELLIGENCE, VOL. 20, NO. 11, NOVEMBER 1998
Short Papers
A Model of Saliency-Based Visual Attention
for Rapid Scene Analysis
Laurent Itti, Christof Koch, and Ernst Niebur
Abstract—A visual attention system, inspired by the behavior and the neuronal architecture of the early primate visual system, is presented. Multiscale image features are combined into a single topographical saliency map. A dynamical neural network then selects attended locations in order of decreasing saliency. The system breaks down the complex problem of scene understanding by rapidly selecting, in a computationally efficient manner, conspicuous locations to be analyzed in detail.
Index Terms—Visual attention, scene analysis, feature extraction, target detection, visual search.
———————— ! ————————
1 I
NTRODUCTIONPRIMATES have a remarkable ability to interpret complex scenes in real time, despite the limited speed of the neuronal hardware avail-able for such tasks. Intermediate and higher visual processes appear to select a subset of the available sensory information before further processing [1], most likely to reduce the complexity of scene analysis [2]. This selection appears to be implemented in the form of a spa-tially circumscribed region of the visual field, the so-called “focus of attention,” which scans the scene both in a rapid, bottom-up, sali-ency-driven, and task-independent manner as well as in a slower, top-down, volition-controlled, and task-dependent manner [2].
Models of attention include “dynamic routing” models, in which information from only a small region of the visual field can progress through the cortical visual hierarchy. The attended region is selected through dynamic modifications of cortical connectivity or through the establishment of specific temporal patterns of ac-tivity, under both top-down (task-dependent) and bottom-up (scene-dependent) control [3], [2], [1].
The model used here (Fig. 1) builds on a second biologically-plausible architecture, proposed by Koch and Ullman [4] and at the basis of several models [5], [6]. It is related to the so-called “feature integration theory,” explaining human visual search strategies [7]. Visual input is first decomposed into a set of topo-graphic feature maps. Different spatial locations then compete for saliency within each map, such that only locations which locally stand out from their surround can persist. All feature maps feed, in a purely bottom-up manner, into a master “saliency map,” which topographically codes for local conspicuity over the entire visual scene. In primates, such a map is believed to be located in the posterior parietal cortex [8] as well as in the various visual maps in the pulvinar nuclei of the thalamus [9]. The model’s saliency map is endowed with internal dynamics which generate attentional shifts. This model consequently represents a complete account of
bottom-up saliency and does not require any top-down guidance to shift attention. This framework provides a massively parallel method for the fast selection of a small number of interesting im-age locations to be analyzed by more complex and time-consuming object-recognition processes. Extending this approach in “guided-search,” feedback from higher cortical areas (e.g., knowledge about targets to be found) was used to weight the im-portance of different features [10], such that only those with high weights could reach higher processing levels.
2 M
ODELInput is provided in the form of static color images, usually
digit-ized at 640 ¥ 480 resolution. Nine spatial scales are created using
dyadic Gaussian pyramids [11], which progressively low-pass filter and subsample the input image, yielding horizontal and ver-tical image-reduction factors ranging from 1:1 (scale zero) to 1:256 (scale eight) in eight octaves.
Each feature is computed by a set of linear “center-surround” operations akin to visual receptive fields (Fig. 1): Typical visual neurons are most sensitive in a small region of the visual space (the center), while stimuli presented in a broader, weaker antago-nistic region concentric with the center (the surround) inhibit the neuronal response. Such an architecture, sensitive to local spatial discontinuities, is particularly well-suited to detecting locations which stand out from their surround and is a general computa-tional principle in the retina, lateral geniculate nucleus, and pri-mary visual cortex [12]. Center-surround is implemented in the model as the difference between fine and coarse scales: The center is a pixel at scale c Œ {2, 3, 4}, and the surround is the corresponding pixel at scale s = c + d, with d Œ {3, 4}. The across-scale difference between two maps, denoted “!” below, is obtained by interpolation to the finer scale and point-by-point subtraction. Using several scales not only for c but also for d = s - c yields truly multiscale feature extraction, by including different size ratios between the center and surround regions (contrary to previously used fixed ratios [5]).
2.1 Extraction of Early Visual Features
With r, g, and b being the red, green, and blue channels of the in-put image, an intensity image I is obtained as I = (r + g + b)/3. I is
0162-8828/98/$10.00 © 1998 IEEE !!!!!!!!!!!!!!!!
•!L. Itti and C. Koch are with the Computation and Neural Systems Pro-gram, California Institute of Technology—139-74, Pasadena, CA 91125.
!
E-mail: {itti, koch}@klab.caltech.edu.
•!E. Niebur is with the Johns Hopkins University, Krieger Mind/Brain
Insti-tute, Baltimore, MD 21218. E-mail: [email protected].
Manuscript received 5 Feb. 1997; revised 10 Aug. 1998. Recommended for accep-tance by D. Geiger.
For information on obtaining reprints of this article, please send e-mail to: [email protected], and reference IEEECS Log Number 107349.
Fig. 1. General architecture of the model.
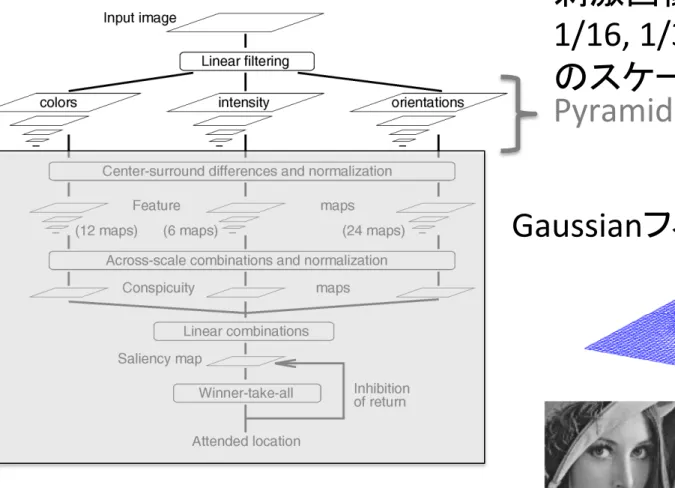
1. 視覚特徴の検出とGaussian pyramidの生成
刺激画像を、
1/1, ½., ¼, 1/8,
1/16, 1/32, 1/64, 1/128, 1/256
のスケールに変更
(pyramid)
Pyramid
Gaussianフィルタを画像に掛ける。
(hFp://squeak.qp.land.to:8080/wiki/index.php?Squeak
%2FSampleCode%2FTinyImageProcessing%2FGaussianより)
Gaussianフィルタによる画像処理→
輪郭や境界がぼかされる
1254 IEEE TRANSACTIONS ON PATTERN ANALYSIS AND MACHINE INTELLIGENCE, VOL. 20, NO. 11, NOVEMBER 1998
Short Papers
A Model of Saliency-Based Visual Attention
for Rapid Scene Analysis
Laurent Itti, Christof Koch, and Ernst Niebur
Abstract—A visual attention system, inspired by the behavior and the neuronal architecture of the early primate visual system, is presented. Multiscale image features are combined into a single topographical saliency map. A dynamical neural network then selects attended locations in order of decreasing saliency. The system breaks down the complex problem of scene understanding by rapidly selecting, in a computationally efficient manner, conspicuous locations to be analyzed in detail.
Index Terms—Visual attention, scene analysis, feature extraction, target detection, visual search.
———————— ! ————————
1 I
NTRODUCTIONPRIMATES have a remarkable ability to interpret complex scenes in real time, despite the limited speed of the neuronal hardware avail-able for such tasks. Intermediate and higher visual processes appear to select a subset of the available sensory information before further processing [1], most likely to reduce the complexity of scene analysis [2]. This selection appears to be implemented in the form of a spa-tially circumscribed region of the visual field, the so-called “focus of attention,” which scans the scene both in a rapid, bottom-up, sali-ency-driven, and task-independent manner as well as in a slower, top-down, volition-controlled, and task-dependent manner [2].
Models of attention include “dynamic routing” models, in which information from only a small region of the visual field can progress through the cortical visual hierarchy. The attended region is selected through dynamic modifications of cortical connectivity or through the establishment of specific temporal patterns of ac-tivity, under both top-down (task-dependent) and bottom-up (scene-dependent) control [3], [2], [1].
The model used here (Fig. 1) builds on a second biologically-plausible architecture, proposed by Koch and Ullman [4] and at the basis of several models [5], [6]. It is related to the so-called “feature integration theory,” explaining human visual search strategies [7]. Visual input is first decomposed into a set of topo-graphic feature maps. Different spatial locations then compete for saliency within each map, such that only locations which locally stand out from their surround can persist. All feature maps feed, in a purely bottom-up manner, into a master “saliency map,” which topographically codes for local conspicuity over the entire visual scene. In primates, such a map is believed to be located in the posterior parietal cortex [8] as well as in the various visual maps in the pulvinar nuclei of the thalamus [9]. The model’s saliency map is endowed with internal dynamics which generate attentional shifts. This model consequently represents a complete account of
bottom-up saliency and does not require any top-down guidance to shift attention. This framework provides a massively parallel method for the fast selection of a small number of interesting im-age locations to be analyzed by more complex and time-consuming object-recognition processes. Extending this approach in “guided-search,” feedback from higher cortical areas (e.g., knowledge about targets to be found) was used to weight the im-portance of different features [10], such that only those with high weights could reach higher processing levels.
2 M
ODELInput is provided in the form of static color images, usually
digit-ized at 640 ¥ 480 resolution. Nine spatial scales are created using
dyadic Gaussian pyramids [11], which progressively low-pass filter and subsample the input image, yielding horizontal and ver-tical image-reduction factors ranging from 1:1 (scale zero) to 1:256 (scale eight) in eight octaves.
Each feature is computed by a set of linear “center-surround” operations akin to visual receptive fields (Fig. 1): Typical visual neurons are most sensitive in a small region of the visual space (the center), while stimuli presented in a broader, weaker antago-nistic region concentric with the center (the surround) inhibit the neuronal response. Such an architecture, sensitive to local spatial discontinuities, is particularly well-suited to detecting locations which stand out from their surround and is a general computa-tional principle in the retina, lateral geniculate nucleus, and pri-mary visual cortex [12]. Center-surround is implemented in the model as the difference between fine and coarse scales: The center is a pixel at scale c Œ {2, 3, 4}, and the surround is the corresponding pixel at scale s = c + d, with d Œ {3, 4}. The across-scale difference between two maps, denoted “!” below, is obtained by interpolation to the finer scale and point-by-point subtraction. Using several scales not only for c but also for d = s - c yields truly multiscale feature extraction, by including different size ratios between the center and surround regions (contrary to previously used fixed ratios [5]).
2.1 Extraction of Early Visual Features
With r, g, and b being the red, green, and blue channels of the in-put image, an intensity image I is obtained as I = (r + g + b)/3. I is
0162-8828/98/$10.00 © 1998 IEEE !!!!!!!!!!!!!!!!
•!L. Itti and C. Koch are with the Computation and Neural Systems Pro-gram, California Institute of Technology—139-74, Pasadena, CA 91125.
!
E-mail: {itti, koch}@klab.caltech.edu.
•!E. Niebur is with the Johns Hopkins University, Krieger Mind/Brain
Insti-tute, Baltimore, MD 21218. E-mail: [email protected].
Manuscript received 5 Feb. 1997; revised 10 Aug. 1998. Recommended for accep-tance by D. Geiger.
For information on obtaining reprints of this article, please send e-mail to: [email protected], and reference IEEECS Log Number 107349.
Fig. 1. General architecture of the model.
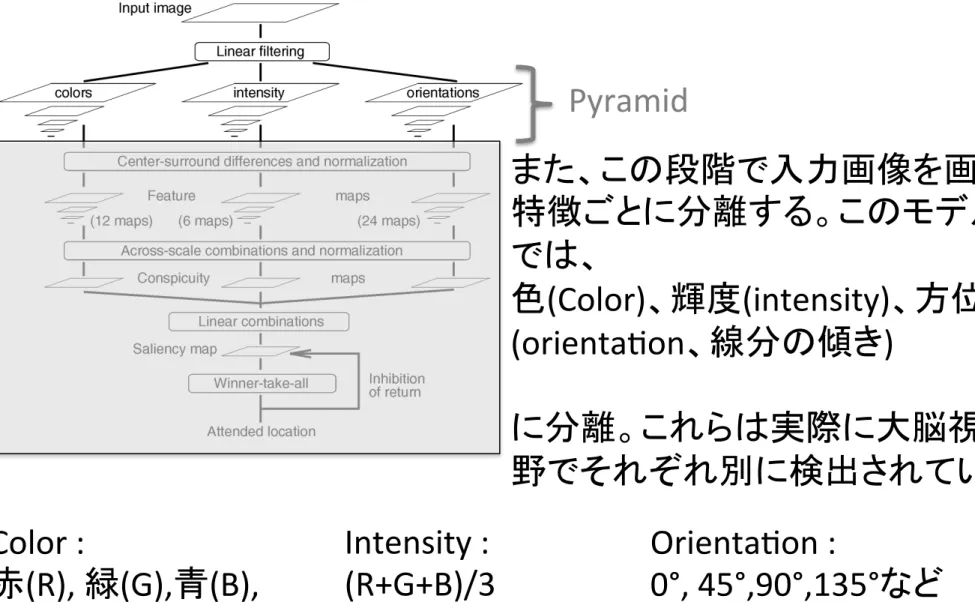
1. 視覚特徴の検出とGaussian pyramidの生成
Pyramid
また、この段階で入力画像を画像
特徴ごとに分離する。このモデル
では、
色
(Color)、輝度(intensity)、方位
(orientaSon、線分の傾き)
に分離。これらは実際に大脳視覚
野でそれぞれ別に検出されている。
Color :
赤
(R), 緑(G),青(B),
黄
(Y)
Intensity :
(R+G+B)/3
OrientaSon :
0°, 45°,90°,135°など
1254 IEEE TRANSACTIONS ON PATTERN ANALYSIS AND MACHINE INTELLIGENCE, VOL. 20, NO. 11, NOVEMBER 1998
Short Papers
A Model of Saliency-Based Visual Attention
for Rapid Scene Analysis
Laurent Itti, Christof Koch, and Ernst Niebur
Abstract—A visual attention system, inspired by the behavior and the neuronal architecture of the early primate visual system, is presented. Multiscale image features are combined into a single topographical saliency map. A dynamical neural network then selects attended locations in order of decreasing saliency. The system breaks down the complex problem of scene understanding by rapidly selecting, in a computationally efficient manner, conspicuous locations to be analyzed in detail.
Index Terms—Visual attention, scene analysis, feature extraction, target detection, visual search.
———————— ! ————————
1 I
NTRODUCTIONPRIMATES have a remarkable ability to interpret complex scenes in real time, despite the limited speed of the neuronal hardware avail-able for such tasks. Intermediate and higher visual processes appear to select a subset of the available sensory information before further processing [1], most likely to reduce the complexity of scene analysis [2]. This selection appears to be implemented in the form of a spa-tially circumscribed region of the visual field, the so-called “focus of attention,” which scans the scene both in a rapid, bottom-up, sali-ency-driven, and task-independent manner as well as in a slower, top-down, volition-controlled, and task-dependent manner [2].
Models of attention include “dynamic routing” models, in which information from only a small region of the visual field can progress through the cortical visual hierarchy. The attended region is selected through dynamic modifications of cortical connectivity or through the establishment of specific temporal patterns of ac-tivity, under both top-down (task-dependent) and bottom-up (scene-dependent) control [3], [2], [1].
The model used here (Fig. 1) builds on a second biologically-plausible architecture, proposed by Koch and Ullman [4] and at the basis of several models [5], [6]. It is related to the so-called “feature integration theory,” explaining human visual search strategies [7]. Visual input is first decomposed into a set of topo-graphic feature maps. Different spatial locations then compete for saliency within each map, such that only locations which locally stand out from their surround can persist. All feature maps feed, in a purely bottom-up manner, into a master “saliency map,” which topographically codes for local conspicuity over the entire visual scene. In primates, such a map is believed to be located in the posterior parietal cortex [8] as well as in the various visual maps in the pulvinar nuclei of the thalamus [9]. The model’s saliency map is endowed with internal dynamics which generate attentional shifts. This model consequently represents a complete account of
bottom-up saliency and does not require any top-down guidance to shift attention. This framework provides a massively parallel method for the fast selection of a small number of interesting im-age locations to be analyzed by more complex and time-consuming object-recognition processes. Extending this approach in “guided-search,” feedback from higher cortical areas (e.g., knowledge about targets to be found) was used to weight the im-portance of different features [10], such that only those with high weights could reach higher processing levels.
2 M
ODELInput is provided in the form of static color images, usually
digit-ized at 640 ¥ 480 resolution. Nine spatial scales are created using
dyadic Gaussian pyramids [11], which progressively low-pass filter and subsample the input image, yielding horizontal and ver-tical image-reduction factors ranging from 1:1 (scale zero) to 1:256 (scale eight) in eight octaves.
Each feature is computed by a set of linear “center-surround” operations akin to visual receptive fields (Fig. 1): Typical visual neurons are most sensitive in a small region of the visual space (the center), while stimuli presented in a broader, weaker antago-nistic region concentric with the center (the surround) inhibit the neuronal response. Such an architecture, sensitive to local spatial discontinuities, is particularly well-suited to detecting locations which stand out from their surround and is a general computa-tional principle in the retina, lateral geniculate nucleus, and pri-mary visual cortex [12]. Center-surround is implemented in the model as the difference between fine and coarse scales: The center is a pixel at scale c Œ {2, 3, 4}, and the surround is the corresponding pixel at scale s = c + d, with d Œ {3, 4}. The across-scale difference between two maps, denoted “!” below, is obtained by interpolation to the finer scale and point-by-point subtraction. Using several scales not only for c but also for d = s - c yields truly multiscale feature extraction, by including different size ratios between the center and surround regions (contrary to previously used fixed ratios [5]).
2.1 Extraction of Early Visual Features
With r, g, and b being the red, green, and blue channels of the in-put image, an intensity image I is obtained as I = (r + g + b)/3. I is
0162-8828/98/$10.00 © 1998 IEEE !!!!!!!!!!!!!!!!
•!L. Itti and C. Koch are with the Computation and Neural Systems Pro-gram, California Institute of Technology—139-74, Pasadena, CA 91125.
!
E-mail: {itti, koch}@klab.caltech.edu.
•!E. Niebur is with the Johns Hopkins University, Krieger Mind/Brain
Insti-tute, Baltimore, MD 21218. E-mail: [email protected].
Manuscript received 5 Feb. 1997; revised 10 Aug. 1998. Recommended for accep-tance by D. Geiger.
For information on obtaining reprints of this article, please send e-mail to: [email protected], and reference IEEECS Log Number 107349.
Fig. 1. General architecture of the model.
2. Pyramid 画像間の差分計算・Feature mapの生成(Center-‐Surround)
網膜
や
初期視覚野
の情報処理
をモデル化。ここでは、同じ特
徴の
Pyramid画像間の差分を取
る。
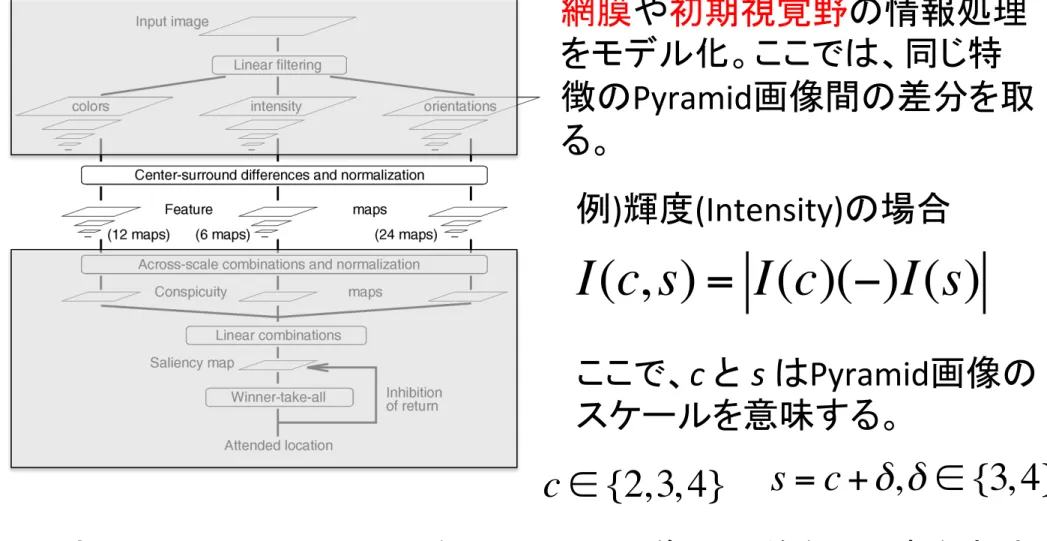
I(c, s) = I(c)(−)I(s)
例
)輝度(Intensity)の場合
ここで、
c と s はPyramid画像の
スケールを意味する。
c ∈ {2, 3, 4}
s = c +
δ
,
δ
∈ {3, 4}
上式の
(ー)はスケールの異なるpyramid画像間の差を取る事を意味
する。
2. Pyramid 画像間の差分計算・Feature mapの生成(Center-‐Surround)
スケールの異なる
L. Itti, C. Koch/Vision Researchpyramid画像間の差を取る事の意味は?
40 (2000) 1489–15061494
Fig. 2. (a) Gaussian pixel widths for the nine scales used in the model. Scale !=0 corresponds to the original image, and each subsequent scale is coarser by a factor 2. Two examples of the six center-surround receptive field types are shown, for scale pairs 2–5 and 4–8. (b) Illustration of the spatial competition for salience implemented within each of the 42 feature maps. Each map receives input from the linear filtering and center-surround stages. At each step of the process, the convolution of the map by a large Difference-of-Gaussians (DoG) kernel is added to the current contents of the map. This additional input coarsely models short-range excitatory processes and long-range inhibitory interactions between neighboring visual locations. The map is half-wave rectified, such that negative values are eliminated, hence making the iterative process non-linear. Ten iterations of the process are carried out before the output of each feature map is used in building the saliency map.
Each feature map is subjected to ten iterations of the
process described in Eq. (2). The choice of the number
of iterations is somewhat arbitrary: In the limit of an
infinite number of iterations, any non-empty map will
converge towards a single peak (except for a few
unre-alistic, singular configurations), hence constituting only
a poor representation of the scene. With few iterations
however, spatial competition is weak and inefficient.
Two examples of the time evolution of this process are
shown in Fig. 3, and illustrate that using on the order
of ten iterations yields adequate distinction between the
two example images shown. As expected, feature
maps with initially numerous peaks of similar
ampli-tude are suppressed by the interactions, while maps
with one or a few initially stronger peaks become
enhanced. It is interesting to note that this
within-fea-ture spatial competition scheme resembles a
‘winner-take-all’ network with localized inhibitory spread,
which allows for a sparse distribution of winners across
the visual scene (see Horiuchi, Morris, Koch &
De-Weerth, 1997 for a 1-D real-time implementation in
Analog-VLSI).
After normalization, the feature maps for intensity,
color, and orientation are summed across scales into
three separate ‘conspicuity maps’, one for intensity, one
for color and one for orientation (Fig. 1b). Each
con-spicuity map is then subjected to another ten iterations
of Eq. (2). The motivation for the creation of three
separate channels and their individual normalization is
the hypothesis that similar features compete strongly
スケール0(源画に対する Gaussianフィルタのサイズ スケール1 (1/2) スケール2 (1/4) スケール3 (1/8) スケール4 (1/16) スケール5 (1/32) スケール6 (1/64) スケール7 (1/128) スケール8 (1/256)
同じ
Gaussianフィルタを使用しても、
画像の大きさによって影響が与えら
れる範囲が大きく異なる。
大きいサイズの画像
(スケール0や1)
に適用すると、フィルタリング効果は
局所的。
小さいサイズの画像
(スケール6な
ど
)には、その効果が広い範囲に及
ぶ。
2. Pyramid 画像間の差分計算・Feature mapの生成(Center-‐Surround)
スケールの異なる
L. Itti, C. Koch/Vision Researchpyramid画像間の差を取る事の意味は?
40 (2000) 1489–15061494
Fig. 2. (a) Gaussian pixel widths for the nine scales used in the model. Scale !=0 corresponds to the original image, and each subsequent scale is coarser by a factor 2. Two examples of the six center-surround receptive field types are shown, for scale pairs 2–5 and 4–8. (b) Illustration of the spatial competition for salience implemented within each of the 42 feature maps. Each map receives input from the linear filtering and center-surround stages. At each step of the process, the convolution of the map by a large Difference-of-Gaussians (DoG) kernel is added to the current contents of the map. This additional input coarsely models short-range excitatory processes and long-range inhibitory interactions between neighboring visual locations. The map is half-wave rectified, such that negative values are eliminated, hence making the iterative process non-linear. Ten iterations of the process are carried out before the output of each feature map is used in building the saliency map.
Each feature map is subjected to ten iterations of the
process described in Eq. (2). The choice of the number
of iterations is somewhat arbitrary: In the limit of an
infinite number of iterations, any non-empty map will
converge towards a single peak (except for a few
unre-alistic, singular configurations), hence constituting only
a poor representation of the scene. With few iterations
however, spatial competition is weak and inefficient.
Two examples of the time evolution of this process are
shown in Fig. 3, and illustrate that using on the order
of ten iterations yields adequate distinction between the
two example images shown. As expected, feature
maps with initially numerous peaks of similar
ampli-tude are suppressed by the interactions, while maps
with one or a few initially stronger peaks become
enhanced. It is interesting to note that this
within-fea-ture spatial competition scheme resembles a
‘winner-take-all’ network with localized inhibitory spread,
which allows for a sparse distribution of winners across
the visual scene (see Horiuchi, Morris, Koch &
De-Weerth, 1997 for a 1-D real-time implementation in
Analog-VLSI).
After normalization, the feature maps for intensity,
color, and orientation are summed across scales into
three separate ‘conspicuity maps’, one for intensity, one
for color and one for orientation (Fig. 1b). Each
con-spicuity map is then subjected to another ten iterations
of Eq. (2). The motivation for the creation of three
separate channels and their individual normalization is
the hypothesis that similar features compete strongly
スケール0(源画に対する Gaussianフィルタのサイズ スケール1 (1/2) スケール2 (1/4) スケール3 (1/8) スケール4 (1/16) スケール5 (1/32) スケール6 (1/64) スケール7 (1/128) スケール8 (1/256)
(I\ and Koch, Vision Research (2000)より)
L. Itti, C. Koch / Vision Research 40 (2000) 1489–1506 1494
Fig. 2. (a) Gaussian pixel widths for the nine scales used in the model. Scale !=0 corresponds to the original image, and each subsequent scale is coarser by a factor 2. Two examples of the six center-surround receptive field types are shown, for scale pairs 2–5 and 4–8. (b) Illustration of the spatial competition for salience implemented within each of the 42 feature maps. Each map receives input from the linear filtering and center-surround stages. At each step of the process, the convolution of the map by a large Difference-of-Gaussians (DoG) kernel is added to the current contents of the map. This additional input coarsely models short-range excitatory processes and long-range inhibitory interactions between neighboring visual locations. The map is half-wave rectified, such that negative values are eliminated, hence making the iterative process non-linear. Ten iterations of the process are carried out before the output of each feature map is used in building the saliency map.
Each feature map is subjected to ten iterations of the
process described in Eq. (2). The choice of the number
of iterations is somewhat arbitrary: In the limit of an
infinite number of iterations, any non-empty map will
converge towards a single peak (except for a few
unre-alistic, singular configurations), hence constituting only
a poor representation of the scene. With few iterations
however, spatial competition is weak and inefficient.
Two examples of the time evolution of this process are
shown in Fig. 3, and illustrate that using on the order
of ten iterations yields adequate distinction between the
two example images shown. As expected, feature
maps with initially numerous peaks of similar
ampli-tude are suppressed by the interactions, while maps
with one or a few initially stronger peaks become
enhanced. It is interesting to note that this
within-fea-ture spatial competition scheme resembles a
‘winner-take-all’ network with localized inhibitory spread,
which allows for a sparse distribution of winners across
the visual scene (see Horiuchi, Morris, Koch &
De-Weerth, 1997 for a 1-D real-time implementation in
Analog-VLSI).
After normalization, the feature maps for intensity,
color, and orientation are summed across scales into
three separate ‘conspicuity maps’, one for intensity, one
for color and one for orientation (Fig. 1b). Each
con-spicuity map is then subjected to another ten iterations
of Eq. (2). The motivation for the creation of three
separate channels and their individual normalization is
the hypothesis that similar features compete strongly
L. Itti, C. Koch/Vision Research 40 (2000) 1489–1506
1494
Fig. 2. (a) Gaussian pixel widths for the nine scales used in the model. Scale !=0 corresponds to the original image, and each subsequent scale is coarser by a factor 2. Two examples of the six center-surround receptive field types are shown, for scale pairs 2–5 and 4–8. (b) Illustration of the spatial competition for salience implemented within each of the 42 feature maps. Each map receives input from the linear filtering and center-surround stages. At each step of the process, the convolution of the map by a large Difference-of-Gaussians (DoG) kernel is added to the current contents of the map. This additional input coarsely models short-range excitatory processes and long-range inhibitory interactions between neighboring visual locations. The map is half-wave rectified, such that negative values are eliminated, hence making the iterative process non-linear. Ten iterations of the process are carried out before the output of each feature map is used in building the saliency map.
Each feature map is subjected to ten iterations of the process described in Eq. (2). The choice of the number of iterations is somewhat arbitrary: In the limit of an infinite number of iterations, any non-empty map will converge towards a single peak (except for a few unre-alistic, singular configurations), hence constituting only a poor representation of the scene. With few iterations however, spatial competition is weak and inefficient. Two examples of the time evolution of this process are shown in Fig. 3, and illustrate that using on the order of ten iterations yields adequate distinction between the two example images shown. As expected, feature maps with initially numerous peaks of similar ampli-tude are suppressed by the interactions, while maps with one or a few initially stronger peaks become
enhanced. It is interesting to note that this within-fea-ture spatial competition scheme resembles a ‘winner-take-all’ network with localized inhibitory spread, which allows for a sparse distribution of winners across the visual scene (see Horiuchi, Morris, Koch & De-Weerth, 1997 for a 1-D real-time implementation in Analog-VLSI).
After normalization, the feature maps for intensity, color, and orientation are summed across scales into three separate ‘conspicuity maps’, one for intensity, one for color and one for orientation (Fig. 1b). Each con-spicuity map is then subjected to another ten iterations of Eq. (2). The motivation for the creation of three separate channels and their individual normalization is the hypothesis that similar features compete strongly
スケール2(-‐)スケール5
スケール4(-‐)スケール8
スケールの異なる
Pyramid画像間の差を取る事で、若干語弊はある
が「フィルタの中心を強調し、周囲から抑制される」状況となる。
この処理を
Difference of Gaussian (DOG)と呼ぶ。また、この処理は
ラ
プラシアンフィルタ
に良く似ている。
2. Pyramid 画像間の差分計算・Feature mapの生成(Center-‐Surround)
スケールの異なる
pyramid画像間の差を取る事の意味は?
◯ラプラシアンフィルタによる画像処理
hFp://hir.skr.jp/mt/cat10/cat11/より
つまり、
Pyramid画像間の差分を取る事で、画像の
輪郭
や
コントラスト
の検出処理を行っている。
この輪郭・コントラスト検出機能は、網膜細胞の反応特性と良く似て
いる。
ちょっと脱線
ラプラシアンフィルタを使う事で、
Hermann Grid錯視を説明できる。
物理的に描かれていない黒い点
らしき物が、縦線と横線の交差点
に見える。
ラプラシアンフィルタを使うと、より多くの抑
制効果が交差点にある事が分かる。
(hFp://www.michaelbach.de/ot/lum_herGrid/より)
1254 IEEE TRANSACTIONS ON PATTERN ANALYSIS AND MACHINE INTELLIGENCE, VOL. 20, NO. 11, NOVEMBER 1998
Short Papers
A Model of Saliency-Based Visual Attention
for Rapid Scene Analysis
Laurent Itti, Christof Koch, and Ernst Niebur
Abstract—A visual attention system, inspired by the behavior and the neuronal architecture of the early primate visual system, is presented. Multiscale image features are combined into a single topographical saliency map. A dynamical neural network then selects attended locations in order of decreasing saliency. The system breaks down the complex problem of scene understanding by rapidly selecting, in a computationally efficient manner, conspicuous locations to be analyzed in detail.
Index Terms—Visual attention, scene analysis, feature extraction, target detection, visual search.
———————— ! ————————
1 I
NTRODUCTIONPRIMATES have a remarkable ability to interpret complex scenes in real time, despite the limited speed of the neuronal hardware avail-able for such tasks. Intermediate and higher visual processes appear to select a subset of the available sensory information before further processing [1], most likely to reduce the complexity of scene analysis [2]. This selection appears to be implemented in the form of a spa-tially circumscribed region of the visual field, the so-called “focus of attention,” which scans the scene both in a rapid, bottom-up, sali-ency-driven, and task-independent manner as well as in a slower, top-down, volition-controlled, and task-dependent manner [2].
Models of attention include “dynamic routing” models, in which information from only a small region of the visual field can progress through the cortical visual hierarchy. The attended region is selected through dynamic modifications of cortical connectivity or through the establishment of specific temporal patterns of ac-tivity, under both top-down (task-dependent) and bottom-up (scene-dependent) control [3], [2], [1].
The model used here (Fig. 1) builds on a second biologically-plausible architecture, proposed by Koch and Ullman [4] and at the basis of several models [5], [6]. It is related to the so-called “feature integration theory,” explaining human visual search strategies [7]. Visual input is first decomposed into a set of topo-graphic feature maps. Different spatial locations then compete for saliency within each map, such that only locations which locally stand out from their surround can persist. All feature maps feed, in a purely bottom-up manner, into a master “saliency map,” which topographically codes for local conspicuity over the entire visual scene. In primates, such a map is believed to be located in the posterior parietal cortex [8] as well as in the various visual maps in the pulvinar nuclei of the thalamus [9]. The model’s saliency map is endowed with internal dynamics which generate attentional shifts. This model consequently represents a complete account of
bottom-up saliency and does not require any top-down guidance to shift attention. This framework provides a massively parallel method for the fast selection of a small number of interesting im-age locations to be analyzed by more complex and time-consuming object-recognition processes. Extending this approach in “guided-search,” feedback from higher cortical areas (e.g., knowledge about targets to be found) was used to weight the im-portance of different features [10], such that only those with high weights could reach higher processing levels.
2 M
ODELInput is provided in the form of static color images, usually
digit-ized at 640 ¥ 480 resolution. Nine spatial scales are created using
dyadic Gaussian pyramids [11], which progressively low-pass filter and subsample the input image, yielding horizontal and ver-tical image-reduction factors ranging from 1:1 (scale zero) to 1:256 (scale eight) in eight octaves.
Each feature is computed by a set of linear “center-surround” operations akin to visual receptive fields (Fig. 1): Typical visual neurons are most sensitive in a small region of the visual space (the center), while stimuli presented in a broader, weaker antago-nistic region concentric with the center (the surround) inhibit the neuronal response. Such an architecture, sensitive to local spatial discontinuities, is particularly well-suited to detecting locations which stand out from their surround and is a general computa-tional principle in the retina, lateral geniculate nucleus, and pri-mary visual cortex [12]. Center-surround is implemented in the model as the difference between fine and coarse scales: The center is a pixel at scale c Œ {2, 3, 4}, and the surround is the corresponding pixel at scale s = c + d, with d Œ {3, 4}. The across-scale difference between two maps, denoted “!” below, is obtained by interpolation to the finer scale and point-by-point subtraction. Using several scales not only for c but also for d = s - c yields truly multiscale feature extraction, by including different size ratios between the center and surround regions (contrary to previously used fixed ratios [5]).
2.1 Extraction of Early Visual Features
With r, g, and b being the red, green, and blue channels of the in-put image, an intensity image I is obtained as I = (r + g + b)/3. I is
0162-8828/98/$10.00 © 1998 IEEE !!!!!!!!!!!!!!!!
•!L. Itti and C. Koch are with the Computation and Neural Systems Pro-gram, California Institute of Technology—139-74, Pasadena, CA 91125.
!
E-mail: {itti, koch}@klab.caltech.edu.
•!E. Niebur is with the Johns Hopkins University, Krieger Mind/Brain
Insti-tute, Baltimore, MD 21218. E-mail: [email protected].
Manuscript received 5 Feb. 1997; revised 10 Aug. 1998. Recommended for accep-tance by D. Geiger.
For information on obtaining reprints of this article, please send e-mail to: [email protected], and reference IEEECS Log Number 107349.
Fig. 1. General architecture of the model.
2. Pyramid 画像間の差分計算・Feature mapの生成(Center-‐Surround)
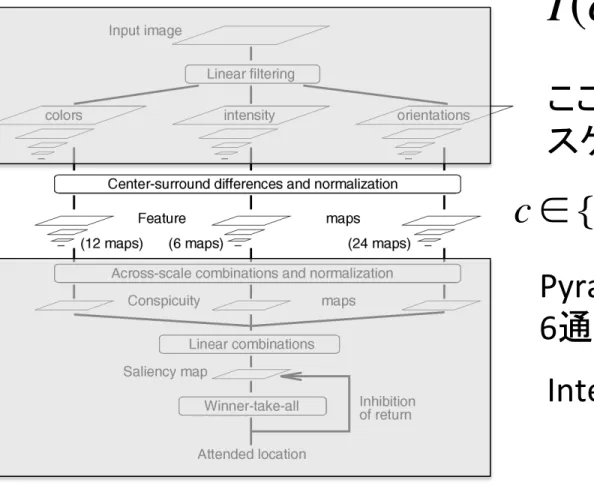
I(c, s) = I(c)(−)I(s)
ここで、
c と s はPyramid画像の
スケールを意味する。
c ∈ {2, 3, 4}
s = c +
δ
,
δ
∈ {3, 4}
Pyramid画像の組み合わせは、
6通り。
Intensityに対しては6 maps
Colorに対してはred-‐green, blue-‐yellowの2種類とPyramidの組み合
わせで
12通り。
OrientaSonに対しては0°, 45°, 90°, 135°の4種類とPyramidの組み合
わせで
24通り。
1254 IEEE TRANSACTIONS ON PATTERN ANALYSIS AND MACHINE INTELLIGENCE, VOL. 20, NO. 11, NOVEMBER 1998
Short Papers
A Model of Saliency-Based Visual Attention
for Rapid Scene Analysis
Laurent Itti, Christof Koch, and Ernst Niebur
Abstract—A visual attention system, inspired by the behavior and the neuronal architecture of the early primate visual system, is presented. Multiscale image features are combined into a single topographical saliency map. A dynamical neural network then selects attended locations in order of decreasing saliency. The system breaks down the complex problem of scene understanding by rapidly selecting, in a computationally efficient manner, conspicuous locations to be analyzed in detail.
Index Terms—Visual attention, scene analysis, feature extraction, target detection, visual search.
———————— ! ————————
1 I
NTRODUCTIONPRIMATES have a remarkable ability to interpret complex scenes in real time, despite the limited speed of the neuronal hardware avail-able for such tasks. Intermediate and higher visual processes appear to select a subset of the available sensory information before further processing [1], most likely to reduce the complexity of scene analysis [2]. This selection appears to be implemented in the form of a spa-tially circumscribed region of the visual field, the so-called “focus of attention,” which scans the scene both in a rapid, bottom-up, sali-ency-driven, and task-independent manner as well as in a slower, top-down, volition-controlled, and task-dependent manner [2].
Models of attention include “dynamic routing” models, in which information from only a small region of the visual field can progress through the cortical visual hierarchy. The attended region is selected through dynamic modifications of cortical connectivity or through the establishment of specific temporal patterns of ac-tivity, under both top-down (task-dependent) and bottom-up (scene-dependent) control [3], [2], [1].
The model used here (Fig. 1) builds on a second biologically-plausible architecture, proposed by Koch and Ullman [4] and at the basis of several models [5], [6]. It is related to the so-called “feature integration theory,” explaining human visual search strategies [7]. Visual input is first decomposed into a set of topo-graphic feature maps. Different spatial locations then compete for saliency within each map, such that only locations which locally stand out from their surround can persist. All feature maps feed, in a purely bottom-up manner, into a master “saliency map,” which topographically codes for local conspicuity over the entire visual scene. In primates, such a map is believed to be located in the posterior parietal cortex [8] as well as in the various visual maps in the pulvinar nuclei of the thalamus [9]. The model’s saliency map is endowed with internal dynamics which generate attentional shifts. This model consequently represents a complete account of
bottom-up saliency and does not require any top-down guidance to shift attention. This framework provides a massively parallel method for the fast selection of a small number of interesting im-age locations to be analyzed by more complex and time-consuming object-recognition processes. Extending this approach in “guided-search,” feedback from higher cortical areas (e.g., knowledge about targets to be found) was used to weight the im-portance of different features [10], such that only those with high weights could reach higher processing levels.
2 M
ODELInput is provided in the form of static color images, usually
digit-ized at 640 ¥ 480 resolution. Nine spatial scales are created using
dyadic Gaussian pyramids [11], which progressively low-pass filter and subsample the input image, yielding horizontal and ver-tical image-reduction factors ranging from 1:1 (scale zero) to 1:256 (scale eight) in eight octaves.
Each feature is computed by a set of linear “center-surround” operations akin to visual receptive fields (Fig. 1): Typical visual neurons are most sensitive in a small region of the visual space (the center), while stimuli presented in a broader, weaker antago-nistic region concentric with the center (the surround) inhibit the neuronal response. Such an architecture, sensitive to local spatial discontinuities, is particularly well-suited to detecting locations which stand out from their surround and is a general computa-tional principle in the retina, lateral geniculate nucleus, and pri-mary visual cortex [12]. Center-surround is implemented in the model as the difference between fine and coarse scales: The center is a pixel at scale c Œ {2, 3, 4}, and the surround is the corresponding pixel at scale s = c + d, with d Œ {3, 4}. The across-scale difference between two maps, denoted “!” below, is obtained by interpolation to the finer scale and point-by-point subtraction. Using several scales not only for c but also for d = s - c yields truly multiscale feature extraction, by including different size ratios between the center and surround regions (contrary to previously used fixed ratios [5]).
2.1 Extraction of Early Visual Features
With r, g, and b being the red, green, and blue channels of the in-put image, an intensity image I is obtained as I = (r + g + b)/3. I is
0162-8828/98/$10.00 © 1998 IEEE !!!!!!!!!!!!!!!!
•!L. Itti and C. Koch are with the Computation and Neural Systems Pro-gram, California Institute of Technology—139-74, Pasadena, CA 91125.
!
E-mail: {itti, koch}@klab.caltech.edu.
•!E. Niebur is with the Johns Hopkins University, Krieger Mind/Brain
Insti-tute, Baltimore, MD 21218. E-mail: [email protected].
Manuscript received 5 Feb. 1997; revised 10 Aug. 1998. Recommended for accep-tance by D. Geiger.
For information on obtaining reprints of this article, please send e-mail to: [email protected], and reference IEEECS Log Number 107349.
Fig. 1. General architecture of the model.
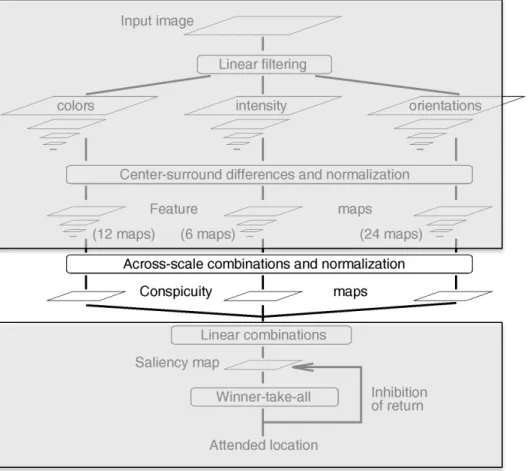
3. 各Feature mapのスケール画像の統合と正規化・Conspicuity map
の生成(レアな特徴の強調)
各特徴マップに対して正規化処
理を行い、スケールの異なる
Pyramid画像を統合。
(Conspicuity mapの生成)
1. マップ上の値が固定範囲[0…M]とな
るように正規化する。
2. 最大値Mを取る位置を検出。それ
以外の局所的な最大値の平均値
mを
計算する。
3. 全ての値に(M-‐m)
2を掛ける。
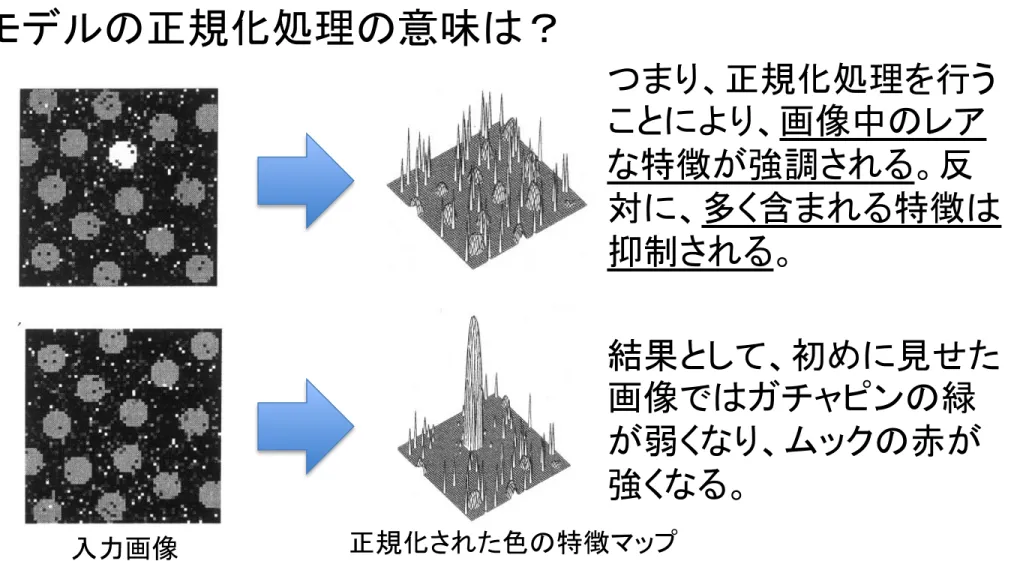
モデルの正規処理
3. 各Feature mapのスケール画像の統合と正規化・Conspicuity map
の生成(レアな特徴の強調)
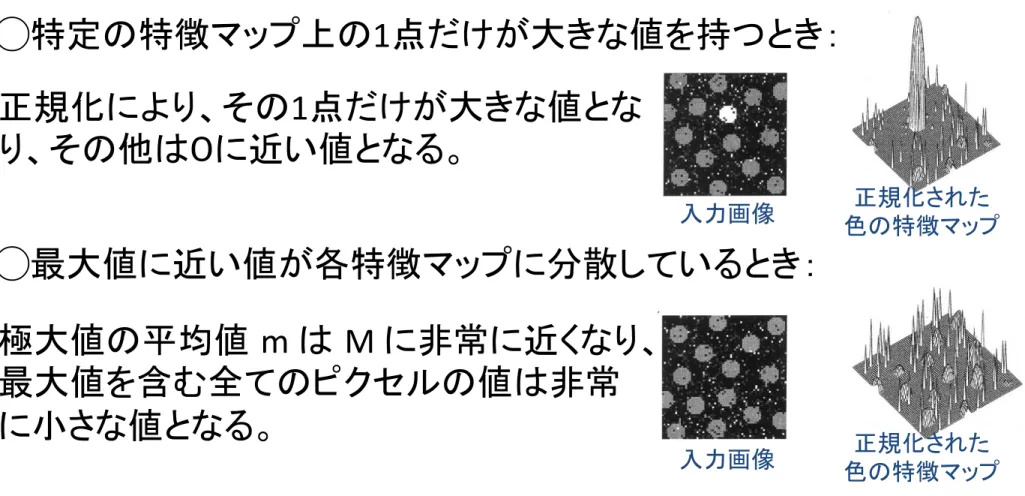
モデルの正規化処理の意味は?
◯特定の特徴マップ上の
1点だけが大きな値を持つとき:
正規化により、その
1点だけが大きな値とな
り、その他は0に近い値となる。
◯最大値に近い値が各特徴マップに分散しているとき:
極大値の平均値
m は M に非常に近くなり、
最大値を含む全てのピクセルの値は非常
に小さな値となる。
L. Itti, C. Koch/Vision Research40 (2000) 1489–1506 1495
for salience, while different modalities contribute inde-pendently to the saliency map. Although we are not aware of any supporting experimental evidence for this hypothesis, this additional step has the computational advantage of further enforcing that only a spatially sparse distribution of strong activity peaks is present within each visual feature type, before combination of all three types into the scalar saliency map.
2.3. The saliency map
After the within-feature competitive process has taken place in each conspicuity map, these maps are linearly summed into the unique saliency map, which resides at scale 4 (reduction factor 1:16 compared to the original image). At any given time, the maximum of the saliency map corresponds to the most salient stimulus
Fig. 3. (a) Iterative spatial competition for salience in a single feature map with one strongly activated location surrounded by several weaker ones. After a few iterations, the initial maximum has gained further strength while at the same time suppressing weaker activation regions. (b) Iterative spatial competition for salience in a single feature map containing numerous strongly activated locations. All peaks inhibit each other more-or-less equally, resulting in the entire map being suppressed.
L. Itti, C. Koch / Vision Research 40 (2000) 1489–1506 1495
for salience, while different modalities contribute inde-pendently to the saliency map. Although we are not aware of any supporting experimental evidence for this hypothesis, this additional step has the computational advantage of further enforcing that only a spatially sparse distribution of strong activity peaks is present within each visual feature type, before combination of all three types into the scalar saliency map.
2.3. The saliency map
After the within-feature competitive process has taken place in each conspicuity map, these maps are linearly summed into the unique saliency map, which resides at scale 4 (reduction factor 1:16 compared to the original image). At any given time, the maximum of the saliency map corresponds to the most salient stimulus
Fig. 3. (a) Iterative spatial competition for salience in a single feature map with one strongly activated location surrounded by several weaker ones. After a few iterations, the initial maximum has gained further strength while at the same time suppressing weaker activation regions. (b) Iterative spatial competition for salience in a single feature map containing numerous strongly activated locations. All peaks inhibit each other more-or-less equally, resulting in the entire map being suppressed.
L. Itti, C. Koch/Vision Research40 (2000) 1489–1506 1495
for salience, while different modalities contribute inde-pendently to the saliency map. Although we are not aware of any supporting experimental evidence for this hypothesis, this additional step has the computational advantage of further enforcing that only a spatially sparse distribution of strong activity peaks is present within each visual feature type, before combination of all three types into the scalar saliency map.
2.3. The saliency map
After the within-feature competitive process has taken place in each conspicuity map, these maps are linearly summed into the unique saliency map, which resides at scale 4 (reduction factor 1:16 compared to the original image). At any given time, the maximum of the saliency map corresponds to the most salient stimulus
Fig. 3. (a) Iterative spatial competition for salience in a single feature map with one strongly activated location surrounded by several weaker ones. After a few iterations, the initial maximum has gained further strength while at the same time suppressing weaker activation regions. (b) Iterative spatial competition for salience in a single feature map containing numerous strongly activated locations. All peaks inhibit each other more-or-less equally, resulting in the entire map being suppressed.
L. Itti, C. Koch / Vision Research 40 (2000) 1489–1506 1495
for salience, while different modalities contribute
inde-pendently to the saliency map. Although we are not
aware of any supporting experimental evidence for this
hypothesis, this additional step has the computational
advantage of further enforcing that only a spatially
sparse distribution of strong activity peaks is present
within each visual feature type, before combination of
all three types into the scalar saliency map.
2.3. The saliency map
After the within-feature competitive process has
taken place in each conspicuity map, these maps are
linearly summed into the unique saliency map, which
resides at scale 4 (reduction factor 1:16 compared to the
original image). At any given time, the maximum of the
saliency map corresponds to the most salient stimulus
Fig. 3. (a) Iterative spatial competition for salience in a single feature map with one strongly activated location surrounded by several weaker ones. After a few iterations, the initial maximum has gained further strength while at the same time suppressing weaker activation regions. (b) Iterative spatial competition for salience in a single feature map containing numerous strongly activated locations. All peaks inhibit each other more-or-less equally, resulting in the entire map being suppressed.