Toshiyuki Nakagaki∗ and Makoto Iima, Tetsuo Ueda, Yasumasa Nishiura Research Institute for Electronic Science, Hokkaido University, Sapporo, 060-0812, JAPAN
Tetsu Saigusa
Creative Research Initiative SOUSEI, Hokkaido University Atsushi Tero
School of Engineering, Hokkaido University, Sapporo 060-8628, Japan Ryo Kobayashi
Department of Mathematics and Life Sciences, Hiroshima University, Higashi-Hiroshima 739-8626, Japan Kenneth Showalter
C. Eugene Bennett Department of Chemistry, West Virginia University, Morgantown,
West Virginia 26506-6045, USA
(Dated: May 2, 2007)
When two food-sources are presented to the slime mold Physarum in the dark, a thick tube for absorbing nutrients is formed that connects the food-sources through the shortest route. When the light-avoiding organism is partially illuminated, however, the tube connecting the food-sources follows a different route. Defining risk as the experimentally measurable rate of light-avoiding movement, the minimum-risk path is exhibited by the organism, determined by integrating along the path. A model for an adaptive tube network is presented that is in good agreement with the experimental observations.
PACS numbers: 87.17.Aa, 47.70.Fw, 87.18.Pj
I. INTRODUCTION
The plasmodium of Physarum polycephalum is an amoeba-like organism with a body made up of a tubular network through which nutrients, signals and body mass are transported. Studies of this organism have shown that it is able to determine the shortest path through a maze as well as “solve” other geometric puzzles [1, 2, 3, 4, 5]. In a maze, a starved organism forms a tube that connects food sources (FS) placed at the two exits of the maze via the shortest path, while nearly the entire pro-toplasm of the amoeba gathers over the two FS. The or-ganism meets its physiological requirements in adopting this shape by absorbing nutrients from the FS as rapidly as possible while maintaining sufficient connectivity to permit intracellular communication. Since the geometri-cal features of the plasmodium stem from satisfying its physiological requirements, the organism is ideally suited for studying optimization behavior of cells. Such behav-ior in a primitive organism of this kind may also offer insights into the evolutionary origins of biological infor-mation processing.
∗Electronic address: [email protected]; Also at Cre-ative Research InitiCre-ative SOUSEI, Hokkaido University, Sapporo, 001-0821, JAPAN
Here we give the plasmodium a new type of task in-volving optimization behavior. Two separate FS are pre-sented to the organism, which is illuminated by an inho-mogeneous light field. Because the plasmodium is photo-phobic, tubes connecting the FS do not follow the simple shortest paths but form according to the illumination in-homogeneity. We report on the behavior of the organism under these conditions and discuss its physiological sig-nificance. We also propose a mathematical model for the cell dynamics and present a computational algorithm for its problem solving.
II. ORGANISM AND METHODS
We studied the plasmodium of Physarum polycephalum in our experiments. Sclerotia, the resting stage of
Physarum, were soaked in water on a 1% agar gel (25 × 35 cm2) in the dark (25oC). The plasmodium regen-erated from the sclerotia in ca. one-half day, which was then used in the experiments.
A circular plastic film (6 cm diameter) was prepared with a rectangular area (1 × 2 cm2) removed from the center. The film was placed onto a 1% agar gel, leav-ing the rectangular area of the gel uncovered. A few pieces (0.5 × 1 cm2) of the regenerated plasmodium were placed in the rectangular area, and the preparation was placed in the dark for a few hours. The organism readily
IR
WL
PL
FL
FL
VC
a
b
WL
PL
x
1x
2x
4t
0t
1t
2t
3t
4x
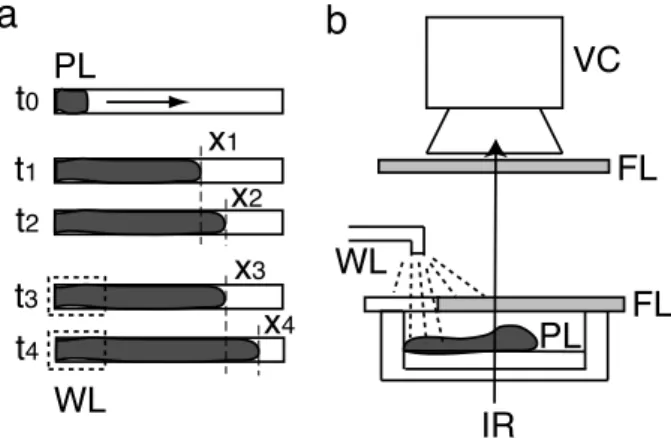
3FIG. 1: Schematic illustration of the procedure for measuring relative levels of risk in photo-avoidance behavior. (a) Top view of the organism that extends linearly. The organism (grey) extends from left to right in the time sequences from
t0 to t4. The rate of extension was increased by illumination
of the posterior end of the organism, indicated by the dashed outline. PL: plasmodium, Xi: position of the plasmodium tip. (b) Side view of the experimental setup. VC (video cam-era for video image analysis), FL (filter to eliminate visible light), WL (cold white light to stimulate the posterior of the plasmodium), IR (infrared light to observe the plasmodium).
spread over the rectangular area and very rarely entered regions of the gel covered by the film. Food sources (FS), consisting of agar blocks containing powdered oat flakes (oat wt/agar solution = 0.1 g/ml), were presented at two sites, the upper left and the lower right hand corners. A part of the rectangular region was then illuminated with cold white light (Luminar, Hayashi Co., Japan). The il-lumination gives rise to the intracellular production of reactive oxygen, which is avoided by the organism [6]. The morphology of the plasmodium was observed for ca. one-half day. As a control, the plasmodium was either uniformly illuminated (bright control) or not illuminated (dark control).
We next estimated the level of risk resulting from the illumination field. A plasmodium was placed at the end of the narrow channel of 1% agar gel (0.5 × 5 cm2), as shown in Fig. 1(a) (t = t0). After a few hours, the plas-modium had extended to ca. 3 cm along the channel (t = t1). We measured the rate of body mass transport from the rear (left-hand side) to the front (right-hand side) of the plasmodium by video image analysis [8], in which the organism was viewed from below by infrared imaging. The light intensity at each pixel of the image reflects the cell thickness. The posterior region of the or-ganism (20% - 30%) was illuminated with white light, and the infrared light intensity of this region was measured before and during the illumination as a function of time. An increase in intensity was found during white light il-lumination such that the ratio α1= (αlight)/(αdark) > 1, where αlightand αdark are the rates of intensity increase in the presence and absence, respectively, of white light
il-lumination. This intensity increase is an indication of the risk experienced by the region of the organism when illu-minated by white light, and we therefore refer to the ratio
α1as the relative risk. Hence, the level of risk of the illu-minated field was relative to that of the dark field, which was set at 1. A second estimation of risk was carried out in which we measured the tip position x of the extending plasmodium and calculated its extension velocity over a period of 20 min before and during illumination, defined as V0= (x2− x1)/(t2− t1) and V = (x4− x3)/(t4− t3), respectively (see Fig. 1a). Because the organism tends to avoid light, V was larger than V0. This velocity is therefore also related to the level of risk experienced by the organism. Hence, we defined a second relative level of risk, α2, as V /V0.
III. CONNECTION PATH WITH MINIMUM
RISK
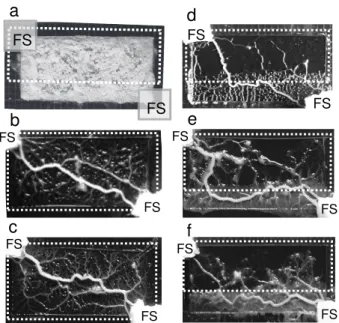
At the beginning of the experiment the organism ini-tially had a sheet-like morphology and a rectangular shape. Two FS were placed diagonally opposite one an-other, and an area of the rectangular organism was then illuminated with cold white light, indicated by the dashed outline in Fig. 2(a). The organism moved toward the FS and also formed several thick tubes that connected the FS. Eventually, only one main tube remained, as shown in Fig. 2(d-f). Figure 2(d) shows a typical path, where a shift is exhibited at the boundary between the dark and illuminated fields. The path length in the illumi-nated field was shorter and the path length in the dark field was longer than the corresponding path in the ho-mogeneous field, shown in Fig. 2(b-c). The connecting path varied from experiment to experiment; however, a statistical trace of the paths averaged over several exper-iments showed the path to consist of two straight lines, meeting at a point on the boundary between the dark and illuminated fields, as shown in Fig. 3. The point of intersection shifted to the left along the boundary as the illumination intensity was increased. The path length in the illuminated field therefore decreased progressively as the toxic effects of the light increased. This implies that the risk of damage to the organism was reduced at the expense of an increase in the total length of the path. The implications of this are considered next.
In order to consider the physiological significance of the path, the minimum-risk path between the FS was calculated using the two relative levels of risk, α1 and
α2, as shown by the dotted and dashed lines in Fig. 3. Measured values of α1 and α2 were used for these com-parisons. The minimum-risk path is defined as the path in which the risk is a minimum according to
Z path
αids, (1)
where ds is an elementary line segment and αi is the risk, which is a function of position. Since the
connect-a
b
c
d
e
f
FS FS FS FS FS FS FS FS FS FS FS FSFIG. 2: Photographs of the connecting paths between two food sources (FS). (a) The rectangular sheet-like morphology of the organism immediately before the presentation of two FS and illumination of the region indicated by the dashed white lines. (b-c) Examples of connecting paths in the con-trol experiment in which the field was uniformly illuminated. A thick tube was formed in a straight line (with some devi-ations) between the FS. (d-f) Typical connecting paths in a nonuniformly illuminated field (95 K lx). Path length was re-duced in the illuminated field, although the total path length increased. Note that fluctuations in the path are exhibited from experiment to experiment.
ing path in the dark control (uniformly dark conditions) was not significantly different from that in the bright con-trol (uniformly bright conditions), the key parameter is not the absolute value of α but the ratio of α in the dark and bright fields. The minimum-risk paths are in good agreement with the measured path in strong light condi-tions, Fig. 3(d-f), while there are larger but acceptable deviations in weak light conditions, Fig. 3(b-c). We con-clude that Physarum is able to locate the minimum-risk path in an inhomogeneus risk field. Note that we assume the value of α is uniform in each region of uniform light intensity, and we neglect possible secondary influences on α such as boundary effects. From a mathematical point of view, minimizing the functional (1) is a varia-tional problem, which is typically solved by using Euler’s equation for the necessary conditions for the extremum of the functional. This method is based on a process of picking the best candidate from all possible paths. The plasmodium, however, does not use an algorithm of this kind. Since the mechanism by which the plasmodium solves the problem is an interesting example of a biolog-ical computation, we propose a mathematbiolog-ical model for this process.
a
d
75K lxe
b
c
control 95K lx 35K lx 15K lx 55K lxf
FIG. 3: Comparison between the measured connection path and the two routes based on minimum risk estimates. Mean paths, averaged over ca. 10 experiments, are shown by the filled circles (with error bars) at light intensities of 0 lx (a), 15,000 lx (b), 35,000 lx (c), 55,000 lx (d), 75,000 lx (e) and 95,000 lx (f). Each point indicates the tube position on the vertical axis at the corresponding horizontal position. The dotted and dashed lines indicate the minimum-risk paths cal-culated according to the relative rate of decrease in thickness,
α1, and the relative migration velocity, α2, respectively. The α values were (α1, α2)=(1.14, 1.03), (1.61, 1.04), (1.50, 1.40),
(2.07, 1.49) and (2.14, 1.62) at 15 Klx, 35 Klx, 55Klx, 75 Klx and 95 Klx, respectively. (The fluctuations in the α1 values
are likely due to the difficulty of preparing each organism in exactly the same state.)
IV. MATHEMATICAL MODEL FOR TUBE
SELECTION
Let us begin with the morphogenesis of the tubular structure of Physarum plasmodium: the mechanism for the tube appearance and disappearance. Cytological ex-periments indicate that protoplasmic shuttle streaming plays a key role in tube formation [9]. Tubes become thicker and thinner as the flow rate increases and de-creases, respectively. Tube thickness therefore adapts to flow rate. The converse process of tube collapse is also involved: cell thickness (or diameter of the plasmodial tube) decreases with time as the organism moves toward the FS. This thickness decrease is accelerated in the illu-minated part of the organism. Thus, the tube structure changes according to a balance of these mutually antag-onistic processes.
Let us suppose the initial sheet-like structure of the plasmodium to be a randomly meshed lattice of tubes, in which edge Mij connects nodes Ni and Nj, as shown in Fig. 4(a). Two special nodes, N1 and N2, correspond to the food sources. One of the food source nodes (N1) always acts as a flux source and the other (N2) acts as a flux sink.
The variable Qij is the flux through Mij from Ni to
Nj. Assuming approximate Poiseuille flow, the flux Qij is given by Qij =Dij Lij(pi− pj), Dij = πr4 ij 8ξ , (2) where piis the pressure at node Ni, Lij is a length of the edge Mij, Dij is its conductivity, and ξ and rij are the viscosity coefficient and radius of the tube, respectively. By considering the conservation law of flux at each node, we have
X i
Qij= 0 (j 6= 1, 2). (3)
For the source node N1 and the sink node N2, X i Qi1+ I0= 0, X i Qi2− I0= 0, (4)
where I0 is the flux flowing into the source node and out of the sink node. It should be noted that I0is a constant in our model. In order to describe the dynamics of tube thickness, it is assumed that the conductivity Dijchanges in time according to the flux (|Qij|),
d
dtDij = f (|Qij|) − aDij,
where f (Q) is an increasing function and f (0) = 0. This relation implies that the conductivity tends to vanish ex-ponentially according to the second term −aDij, while it is enhanced by the flux along an edge according to the first term f (|Qij|). The tube lengths, Lij, remain con-stant throughout the adaptation process, and changes in the conductance therefore result in changes in tube ra-dius. Note that a is a kinetic constant in the process of tube thinning. We adopt here the functional form
f (Q) = |Q|; the adaptation equation for tube thickness
is then expressed simply by
d
dtDij = |Qij| − aDij. (5)
The network Poisson equation for the pressure, derived from Eqs. (2), (3) and (4) is
X i Dij Lij(pi− pj) = −I0 for j = 1, I0 for j = 2, 0 otherwise. (6) By setting p2 = 0 as the basic pressure level, all of the
pi can be determined by solving Eq. (6), in which each
Qij= DLijij(pi− pj) is also obtained.
It should be noted that the variable Dij evolves follow-ing the adaptation Eq. (5), while the variables such as pi,
Qij are determined by solving the network Poisson Eq. (6) characterized by the values of Dij at each moment. (See [10, 11] for mathematical details of the model.) Here
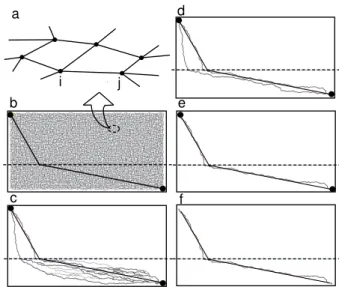
d e f b i j a c
FIG. 4: Simulation of path formation. (a) Schematic illus-tration of the mathematical model. The tube network of
Physarum is represented by a random mesh lattice. Between
junctions i and j the tube has fixed length Lij, variable radius
rij, and the conductance Dij∝ r4ij. All tubes initially have a similar small value of rijwith random fluctuations around the mean value. (b-e) Results of simulation. A constant current flows into the source in the upper left corner and out of the sink on the lower right. Some paths including the minimum-risk path appear at an intermediate stage (c, d) and finally only the risk path remains (e). (f) The minimum-risk path obtained by a conventional pathfinding algorithm, Dijkstra’s algorithm [12], where the length of a lattice edge was scaled by the relative level of risk. Above the dashed line
a = 2 (corresponding to the illuminated region) and below
the dashed line a = 1. The simulations utilized 10000 nodes in order to generate a sufficiently fine meshwork. No change in the qualitative behavior was found when the number of nodes was increased.
we focus on the effects of parameter a on the model be-havior in order to develop an understanding of the effects of inhomogeneity in the experimental system. We next consider the relationship of the process of tube thinning (second term in Eq. (5)) to the experimentally measured
α1. Equation (5) can also be expressed in terms of the thickness of tube Rij in the form dRij
dT = −aRij, where
Dij = (πrij4)/(8ξ), rij = Rij/2 and t = 4T , if the pro-cess of tube-thickening |Qij| is neglected. The constant a expresses how rapidly the thickness decreases and is
related to the experimentally measured α1. In the sim-ulation, the constant a was therefore set to adark = 1 in the dark field and to alight= α1or α2for the illuminated field.
The evolution of the network is shown in Fig. 4(b-e). In the intermediate stage, some paths, including the minimum path, appear to compete with each other. This competition continues for a period of time, and the minimum-risk or a-minimum path is finally selected. The model therefore captures the mechanistic features of pathfinding by the organism as experimentally observed
in the plasmodium.
The final connecting path in the simulation was de-termined by the ratio alight/adark, corresponding to α1. Hence, the control parameter for pathfinding is the same in the experiment and the model simulation. Moreover, the simulation results for the final connecting path were robust to the assumption of Poiseuille flow D ∝ R4; the qualitative behavior is insensitive to the exponent (4, 3 or 2) and only affects the time constant for convergence to the final path. (Note that dR
dt ∝ R when D ∝ Rn is substituted into Eq. (5).)
For the sake of simplicity we assumed a constant flux
I0; however, the behavior is much the same if the flux is replaced by I0sin 2πωt. This is consistent with the experimental observation that protoplasmic sol flows pe-riodically back and forth between the two FS. An impor-tant requirement for pathfinding is sufficient flow of sol through the tubes. Since the total amount of sol in the organism is conserved, shuttle streaming of sol is neces-sary for achieving flow. Protoplasmic shuttle streaming thus plays an essential role in pathfinding.
Each tube evolves in parallel over time according to the local dynamics, which may be regarded as a form of parallel computation. The model equations lead to the optimal solution much like the experimentally observed optimization in the plasmodium. The conserved quan-tity, the total flux I0, plays an essential role in the global optimization in the model.
V. DISCUSSION
We note that the minimum-risk path exhibited by the
Physarum plasmodium and in our adaptive-tube network
model has geometric features much like the path of light in two materials with differing refractive indices. While the path of light according to Snell’s Law depends on the speed of light in different materials, the minimum-risk path results from an optimization process in which tube thickness depends on competing processes that are influenced by the photo-avoidance response of the plas-modium.
The plasmodium of the primitive organism, the gi-ant amoeba Physarum, is able to find the minimum-risk path in a spatially inhomogeneous field of risk. Thus the amoeba has the capacity for information processing in optimizing its physiological requirements. The model proposed here is based on positive feedback affecting the process of protoplasmic streaming. It should be noted that each tube in the network changes its thickness in re-sponse to protoplasmic flow within it. Hence, the global evolution of the tube network arises from local tube dy-namics. The simplicity of such dynamics offers insights into the optimization behavior of the plasmodium. We also note that the evolution of the tube network shares features in common with Hebbian learning found in neu-ronal networks [13], as the tubes grow or shrink and dis-appear based on their level of activity.
Acknowledgments
This research was supported by Grant-in-aid for Sci-entific Research NO. 18650054, 18654022 of the Japan Society for the Promotion of Science. K.S. acknowledges financial support from the National Science Foundation (CHE-0415392).
[1] T. Nakagaki, H. Yamada and A. T´oth, Nature 407, 470 (2000).
[2] T. Nakagaki, H. Yamada and A. T´oth, Biophys. Chem. 92, 47 (2001).
[3] T. Nakagaki, Res. Microbiol. 152, 767 (2001).
[4] T. Nakagaki, H. Yamada and M. Hara, Biophys. Chem. 107, 1 (2004).
[5] T. Nakagaki, R. Kobayashi, Y. Nishiura and T. Ueda,
Proc. R. Soc. Lond. B 271, 2305 (2004).
[6] T. Ueda, Y. Mori, T. Nakagaki and Y. Kobatake,
Pho-tochem. Photobiol. 48, 705 (1988).
[7] T. Ueda , T. Nakagaki and Y. Kobatake, Protoplasma Supplement 1, 51 (1988).
[8] T. Nakagaki, H. Yamada and T. Ueda, Biophys. Chem. 82, 23 (1999).
[9] T. Nakagaki, H. Yamada and T. Ueda, Biophys. Chem. 84, 195 (2000).
[10] A. Tero, R. Kobayashi and T. Nakagaki, J. Theor. Biol. 244, 553 (2007).
[11] A. Tero, R. Kobayashi and T. Nakagaki, Physica A363, 115 (2006).
[12] W. Dijkstra, Numer. Math. 1, 269 (1959).
[13] D.O. Hebb, The Organization of Behavior (Wiley, New York 1949).