【論
文
】
UDC 624
.
014.
2
;624
.
075
.
2 691.
714 62−
462
R
本 建 築 学 会構 造 系 論 文輾 告集 第4Z5
号・
1991
年7
月Journal
ofStruct
.
Constr
、
Engng
、
AIJ
,
No
、
425
,
Juty
,
1991LIMIT
OF
AXIAL
FORCE
RATIO
FOR
DEGRADING
STEEL
BEAM
−
COLUMNS
INVOLVING
LOCAL
.
BUCKLING
局部
座
屈
に よ り
耐力低 下
を 生
じ る
鋼柱
の
軸 力 比
制
限
Yasuhire
UCHIDA
*and
Shosufle
MORIIVO
* *内
田
保 博 ,森 野 捷 輔
Amethod
for
evaluatingthe
seismic safety ofdegrading
steel
beam−
columnsfalling
in
local
−
buckling
under repeatedbending
moment wasprQposed
in
this
study,
based
on
the
convergencecondition
for
the
centroidal strain andindicators
representingthe
rate of strain accumulation andthe
rate of moment capacitydeterioration
.
The
proposed
method was usedto
investigate
li
皿its
of
the
axialforce
ratiofor
the
squarehollow
steelbeam−
columns
in
whichthe
width−
thickness
ratio ofplate
elements
,
curvature amplitude andyield
strain vary asparameters
.
KegWOizlS
:steeibeam
−
column
,
iocal
buckling
,
α蕩α1
force
ratio,
strain accumutation, strength 讒
一
t
θr:oratl(m鋼 柱
,局 部 座 屈
,軸 力比
,
ひず
み の累積
,
耐 力
低 下1
.
lntroduction
When
the
steelstructure
is
subjected
to
the
fiuctuating
horizontal
force
brought
by
strong earthquakes,
the
beam
−
column
oftendegrades
due
to
the
local
buckling
, andthe
strain
accumulation
occurs.
The
strength
deterioration
ofthe
beam
−
column
significantly
correlates withthe
strain
accumulationof
the
cross
section
.
The
accumulation
of
centroidalstrain
or
axial
deformation
of
compactsteel
beam
−
columns
under repeatedbending
has
been
investigated
by
many
researchers
,
such
asTakanashii
] ,Suzuki2
),
Sakamoto3
],Mukudai
⇔ ,Makinos
],
Matsui6・
’,
Yamada7
)・
s ),
Imai9
】,
SaishoiD
)and
Igarashi1
】〕.
The
effect
of
axiaHorce
ratioand
width
−
thickness
ratioon
plastic
deformation
capacityfor
steel
beam
−
columns
was studiedby
Kato
職 13 】and
Mitani14
).
When
athin
walled
beam
−
column
is
subjectedto
alternately
repeateduniaxial
or
biaxial
bending
moment
in
which
Iocal
buckling
occurs
,itmay
reach
a steady stateand
the
hysteretic
moment.
curvature
relation
converges
after
a
certain
.
numberof
the
load
cycles
.
On
the
other
hand
,
the
centroidalstrain
maykeep
increasing
with agradual
deteriQration
ofthe
bending
moment
capaCityin
another
beam −
column.
The
boundary
ofthese
two
behaviors
maybe
relatedto
parameters
such asaxial
force
ratio
,
width
−
thickness
ratio ofthe
plate
element
,
and curvatureamplitude
,
in
a
complex
manner.
This
paper
presents
a
method
to
evaluatethe
seismic
resistance
capacity ofa
given
memberat
the
ultimate
stageunder
the
repeated
loading
condition
,
inclllding
a membersubjected
to
biaxial
bellding
,
andproposes
expressions
ofthe
limits
of
the
axial
force
in
terms
ofthe
width
−
thickness
ratiQof
the
plate
elementsbased
on
the
convergence
conditionof
the
axial
strain andthe
rate ofthe
strainaccumulation
本 論 文は
,
文 献 17 }−
2D を ま と め た も のて.
あ るu*
Assoc
.
Prof
.
,
Dep
亡.
ofArchitecture
,
Faculty
ofEngineering
,
Kagoshima
Univ
.
,
Dr
.
Eng
.
**Prof
.
,
Dept
.
ofArchitecture
,
Faculty
ofEnginee
血g
,
Mie
Univ
.
,
Dr
.
Eng
鹿 児 島大 学工学部建築 学 科
助 教 授
・
工博三重 大 学工学 部建 築 学 科
教 授
・
工博一
57
− .
一
Architectural Institute of Japan
NII-Electronic Library Service
ArchitecturalInstitute of Japan2.
Cyclic
Behavior
of
Beam-Columns
with
Square
Hollow
Section
2.1
Mathematical
Model
Figure
1
shows
the
model of a squarehollow
section,
which
is
divided
into
a number of elementsfor
the
numerical
treatment,
The
following
dimensions
are
given
to
the
model:
b=d==48
mm, andt=
3.
2
mm.
The
number
of
elementsn
is
taken
equalto
11.
The
model
is
subjected
to
a constant axialforce
whose ratio
p
to
the
yield
axial
force
P.
is
equalto
O.
1
orO.
5,
and
alternately・repeated
biaxial
bending
with
nondimensional curvaturee5.
=di.d!e.
cos
e+
¢.blE.sin
e,
as
shown
in
Fig.
2,
where
the
yield
stiain e.=O.14
%.
The
value
of
curvature
amplitude
is
taken
equalto
3
anddirection
of
the
curvature
vectorg==O
or if4.The
hysteretic
relationbetween
stressa
and
strain
e
considered
in
this
study
is
shown
in
Fig,
3
where
s=ala,,
e=EIE,,
withthe
tension
being
taken
positive.
a,denotes
theyield
stress. u-e relationhere
includes
the
effect
oflocal
buckling
in
a
macroscopic
way.
Therefore,
it
is'not
the
stress-strain Telationfor
an
infinitesimal
element.
o and ehere
aredefined
as
the
axial
force
divided
by
area
andthe
change
of
Length
divided
by
the
original
length
for
abar
element,The
stress-strain
reiationis
composed ofthree
relations:
linear
relationfor
elasticloading
and
unloading
;
strain
hardening
type
linear
plastic
relationfor
tensile
loading
;
and
d'egrading
type
non-linearpiastic
relatien
for
compressive
loading,
whichis
derived
by
replacing
a
locally-buckled
plate
by
a
number
of
buckled
bars
in
compregsioni5'.Nondimensional
stress-strain
relations.f},{e)
andg.(e)
represen'ting
the
stress-strain
,relations
in
the
plastic
rangeare
specified
in
terms
of
the
strain efthe
i-th
element asfollows:
-f}'(e')==lf::l)--e,+i)l:li'l:l''''''''''''''''''
''
'
''''''H'
''
'H-'''''''''`i)
g.(ei)=#(e,-1)+1・・-・・・・・・・・-・・・・・・・・・・・・・・-・・・・・・・・・・・・・・・・・・・・・・・・・・・・・・・・・・-・-・・・--・・-・・・・・・・・・・---・-・・・・(2)
f(e,>=-
4
A'E2(e,)+1
+2
AE<ei)-'----'''-''''''''''''''''''''''''''''''''''''''""'''''''''''''-'''''r
(
3
)
E(ei)=
-2(e,-eH)Ey-(ei-eB}2ei
A-h(d!t)
where
?,=maximum
strain
that
the
i-th
element
has
experiencedin
the
past;u#strain
hardening
coefficient;
eb=E,le.;
eR=criticalstrain
at
which
the
local
buckling
occurs
;
dlt=width-thickness
ratio
of
the
plate
element;and
h=a
parameter
introduced
to
compensatethe
error
involved
in
the
formula
derived
by
treating
the
plate
buckling
as
the
bar
buckling.
T・he
yalueof
e.
is
determined
from
the
test
results
of
the
local
buckling
oftubular
beam-columnsi6),;
eB=-2.78(t12
d)21E..
The
present
analysis
omits
the
casethat
en<-1,
i.e.,
the
plate
element
buckles
elastically.
The
value
of
h
is
assumed
to
varylinearly
along
the
side ofthe
model
section
from
O
atthe
corner(
i--1)
to
O.
15
at
the
center
(i--n+11Z).
The
stress-strain
relation
ofthe
plate
elementplays
a
key
rolin
determining
whetherthe
accumulation
of strain occurs
or
not,
which
is
one
ofthe
criteriafor
the
evaluation
of, earthquakeresistance
cdpacity,
Therefore,
a
realistic
model of stress-$trainrelatien
must
be
employed,
but
it
is
difficult
atpresent,
because
of
the
lack
of
experimental
data.
Although
the
stress
deterioration
withthe
Ioad
repetition
and
2d
g2yJfi+1)/2212E"
itt
E.1)12
x
Fig.1
Model
section58
-¢
y--.'''''',`
`3'xNM
-31-dih-str-
i3
¢ x''-i]it-3Fig.2
Curvature
history
se・
9p(e)
tan"iv
1-..za.g
'
::L'
eB1//1-111
11 e/dF.tlllp't
f'(e)'li
P
-1
the
stiffnessdegradation
due
to
the
resisualdeformation
are
not
taken
inte
account
in
the
present
model,this
model mayby
reasonabiein
viewof
the
analogy
with
the
behavior
of
a
bar
subjectedto
the
repeatedaxial
loading.
2.2
Results
of
Numerical
Analysis
The
model
given
in
2.
1
are
treated
numerically onthe
assumptionthat
plane
sections
before
bencling
remains
plane
after
bending,
and
the
shear
deformation
can
be
neglected.
Results
ofthe
numericalanalysis
of
the
model
section
in
Fig.
1
subjectedto
alternately repeatedbending
are
shown
in
Figs,
4(a)
through
4(d).
The
nondimensional
bending
moment
m
and centroidal straine,
are
defined
as
follows
:
1O
1.oM
H-'r
-4
-・-4
'O.6
O.2
-O,2-O.6
-1
{a)
p
=-O.
r(b)
p
=-O
O.8m
-4
4
¢ r---O.8'
O.8m
-4
4
¢-.4-o.
.o1.,
e.
ee
1.oM
O.6
O.2・-O.2
-O.6
g
16
11
'211'
-1.0.1,
1.0
O.6O.2
-O.2-O.6
-1
Cc)
p=
-o.
1
.5'o
8
1
C=
450
m ,C=oe
Om
O.6
O.2
4
¢ r-O.2(d)
p
=Fig.4
Cycl
-O.6
-1.0-O.5,
C
=ic
behavior
20/r
r14eeo
4seof
moclelin
Fig.1
eo eo59
-Architectural Institute of Japan
NII-Electronic Library Service
ArchitecturalInstitute of Japanm==MleIM.cos
e+M.IM.sine;
Ml,,
M,=bending
momentsabout
x-
and
y-axis,
・respectively;M.==
full
plastic
moment
aboutx-axis;e,=e,/E.;and
E,=strain atthe
centroid.
'
,・
It
is
noted
from
Fig.
4
that
the
plastic
strain
at
the
centroid
convergesto
a
certain
value
whenthe
axialforce
ratio
is
small,
but
otherwiseit
seems
to
diverge.
The
question
whether
or
notthe
deterioration
ofbending
moment
capacity
withthe
increase
in
the
load
cycles stopsis
strongly
relatedto
convergenceor
divergence
ofthe
centroidalstrain.
The
accumulation
of
the
centroidal
strain
and
the
reduction.ofthe
rnoment
capacity
of
the
model
with
e=・450
are
both
smallerthan
those
for
the
model witheFOe,
whenp
=-o.
1,
and
the
strain
accumulationis
slower
in
the
former
case.On
the
otherhand,
whenp=
-O.
5,
the
centroidal straindoes
not
converge
in
either
case, andthe
computatio.n
is
terminated
when
the
stress
at
the
extreme
fiber
in
the
tension
side
becomes
zero.3.
Convergence
Condition
for
the
Centroidal
Strain
of
a
Beam-Column
3.1
Analytical
Model
.
In
order
to
investigate
,the
problem
of
strain
qccumulation
in
abeam-coluinn'
subjecteclto
uniaxialbending,
consider
a rectangularcross
section
2
b
×2
d
as
shown
in
Fig,
5,
in
whichthe
curvature¢
.=ZF
occurs
as
a
result
of
initial
bending.
Then,
alternately
repeatedbending
Ml,
is
subsequently
applied
with
the
curvature
amplitude
di..
Figure
6
shows
the
curvature
history,
in
whichthe
numeralsdenote
the
turning
points
ofthe
repeatedloading.
The
nondimensional
curvatureip"
and
the
axial
strain
e"
atthe
turning
point
n
aregiven
as
follows:
ipn=6+
¢
.en==e:+vipn・-・・・・・・・・・・・・・---・-・・・・・・・・・・・・・・・・-・----・-・・・・・-・-・・・・・-・--・・・・・・-・--・-・・-・・・・(4,
5)
whererp=yld
;
¢
=di.1
O.o
;
O.o=e,ld
;
and
the
supersc'ript
n
indicates
the
values atthe
turning
point
n,
The
present
study
treats
the
following
case
only
:
The
strain
of
extreme
compressionfiber
goes
into
the
degrading
stress
region
of
the
compression.'
3.2
Convergence
Condition
Suppose
nowthe
straindistribution
in
the
cross
section
changes
from
the
one atthe
turning
point
n
to
the
other atthe
turning
point
(n+112),
as shownby
solid
and
dashed
lines
in
Fig.
7(a),
respectively,with
the
assumption
that
the
centroidal strainat
the
point
n
is
in
the
inelastic
rangein
compression,i,
e.
,e7<-1,
The
curvature
change
is
equal
to
2
ip.
and
the
strainincrement
at
the
centroid
is
Ae,,
If
the
nondimensionalstress-strain
relationis
given
a
priori
as shownin
Fig,
3,
the
stress
distribution
in
2d
y
y
mx
-2b
Fig.5
Model
section%-"-1---2.-.n----¢
T-"L.J
5
¢d---1232
n+12cyceFig.6
Loading
conditione
nn
eo n-.tf2hOrsN.ll"egn+.,
1r,.4'N-s'
tt-slX/n+i
sTen.
y(a)
Fig.7
Stress
, 1.tl
ncompl
(b)
and straindistributions
n
-60-the
section
becomes
as
shown
in
Fig.
7(b).
The
strainincrement
Ae,
is
determined
asa
function
ofe:,
¢
.and
the
axial
force
ratiop
from
the
equiiibrium
condition
ofthe
axialforce
on
the
section.
It
is
attempted
here
to
obtain
an
approximate
solution
for
Ae,.
If
it
is
assumedthat
there
is
no
change
in
the
strain atthe
centroid
in
the
process
of
loading
from
the
turning
point
n
to
(n+lf2),
i,
e.
,Aeo=O,
the
strainand
stress
distributions
in
the
section
become
as shownin
Figs.
8(a)
and
(b).
In
general,
the
stress
atthe
point
(n+112),
dashed
line
in
Fig.
8(b),
is
not
in
equilibrium
withthe
externalaxial
force
p.
The
unbalancedaxial
force
Ap
is
given
as
follows
:
Ap=(f7f(e)do+J[i'g(e)do)12-p・・---・-・-・-・・-・---・-・・・・・・-・・・・・・・・・・・・・・・・・・・・・---・-・・・・・・-・・(6)
wherea=nondimensienal
distance
between
the
centroid andthe
point
of
zero
stress,
andf(e)
and
g(e)
are
functions
of nondimensionalstrain
expressing
the
nondimensional
stress-strain
Telationsin
the
compression
side
and
the
tension
side,
respectively.
If
the
centroidal
strain
has
already
converged
to
a certainvalue
in
the
inelastic
range,the
condition
that
Ap
=O
is
satisfied.
Noting
that
dn=(ip-¢
.)de,e"'if2=e:+(iS-
¢
.)rp,a=f(e?)121ip.,
andextreme
fiber
strains
atthe
load
point
(n+112)
are
given
by
e:
±
(5-
ip.),
the
condition
for
the
convergence
ofthe
centroidal
strain
i.e.
,
Ap=O,
is
given
asAp=2
(6!
¢
.)[.Cl
O-",t,Ce,O.IMe!e'-i]!2f(e)de+J[1:'.";[.-l:,07.')
...,v,
g(e)de]-p=o''''''''''''''-'''-
<
7
)
3.3
Accumulated
Strain
If
the
solution
for
e,
of
Eq.
(
7
)
is
notfound,
the
centroidal
strain will notconyerge.
Then
the
strainaccumulation
Ae,
mustoccur
at
the
centroidduring
the
loading
process
from
the
load
point
n
to
(n+112),
in
orderto
compensate
the
unbalanced
axialforce
Ap.
The
actualstress
distribution
becomes
the
one
shown
by
solid
line
in
Fig.9(a),
instead
of
the
distribution
shown
by
dashed
line,
The
difference
in
the
axial
force
AP
between
the
two
sets
of
stress
distribution
is
given
by
the
shadedarea
in
Fig,
9(a).
Foi
simplicityof
the
manipulation,
the
shaded
areais
appreximated
by
the
dotted
area
in
Fig.9(b).
Then,
the
expression
for
Ap
is
obtained
asAP=
2
(ziL
ip.)
[y[1:O.",):,-..,,,
f(
e)de-J[1:O.",i...,
f(e)de
e
'
n seR n sNs2ersN n+tN..VNs r-・--2(.1n+ia sTen, niiANssNsN--p'--.-tJn
Comp.
(a)
(b}
Fig.8
Stress
and straindistributions
onthe
assumptionthat
AeC"i:=O
C12AiLder)s
/Ae,\O
n Aeo=e s...zt.1,",.FSI・L:・s,-I'/'[.111,t・.lil,,./-"."i,1,x...1.ttA.tttt:./s//:;';"'/"'li';.L-・
AeefO
,;,),!(<t..--,iiL・jAeo=O"
(a)
tb)Fig.9
Stress
distributions
onthe
assumptionthat
Ae:'i/Z"=O
-61-Architectural Institute of Japan
NII-Electronic Library Service
ArchitecturalInstitute ofJapan+(e#"!2-
eV)
lg(
e:+
g)-f(
e:)l]
・--・・・・"--・・・・・・・-・---・-・-・・;・・・・・・・・・・・・-・-・・・・・・・・・・--
(
s
)
g=11+"(eg-1)-f(e?)l!(2-rd
[Phe
value
of
g
divided
by
2
(ll-
¢
.)indicates
the
distance
between
the
centroid
and
the
point
of
tension
yielding,
as
shown
in
Fig.9(a).
The
equilibrium
conditionfor
the
axial
force
requiresAp+Aff=O-H''''''-'''''''''''''''''''''''''''''''r''''''''''''''''''"'''"'''H''''''--''''''・t・・'HH・・・-・-(9)
Substituting
Eqs.(6)
and(8)intoEq.(9)leads
to
the
expression
for
the
increment
of
the
centroidal
straln
as
e?+ii2r
e:=
-
[Le.O"'
+aM"r)
gc
e)de
+
zae.O.1'J;-',aJ
..,
f(
e)de
-2
p(th
-
¢
r)]Ag(e?+
g)-f(
e:)I''
'
(
10
)
The
nondimensional
bending
moment
at
the
load
point
(n+112)
is
derived
as
follows,
m"'ii2=
2
(Jl
o.),
[J[1
O"'feL"r),g(
e)
(e-
e:)de
+y[1:O.";.i;.Z,-,-..,
f(
e}
(e
-
e:"!z)de
+(e:'ii2--eC)lg(e:+O-f(e:)He:-e?'i!2+gl12]・・・・・'・'''・・・・・・・・・・・・・・・・・-・・-'・'・・・・・・(11)
3.4
Evaluation
of
Earthquake
Resistance
Capacity
Earthquake
resistance
capacity
of,athin-walied
steel
beam-column
may
be
evaluated
from
three
points
:
the
centroidalstrain
converges
withina
limiting
value
e,.
andthe
bending
moment
capacity
at
the
converged
state
is
large
enough
;
the
bending
moment
at
the
load
point
n
for
an
assumed
strain
level
e?=
e,.
exceeds
aiimit
7n,.,
and
the
deterioration
factors
7
℃
'if' and7".'
tf2are
less
than
corresponding
limits
x,..
and7s,..,
where7Z"/2
and
7".'if2
arefactors
indicating
the
accumulationrate
of
the
centroidal
strain
and
the
deteribrati6n
rate
of
the
bending
moment'carTiying
capacity
during
the
loading
process
from
the
'
load
point
n
to
(n+112),
defined
as
,
7n.+i!!=
e:+i!21e:-1
;
7n.+i12=1-mn+i!:lmn
---・--・・・・・・・・・・・・・・・・i・・・・--・-・・・・・・・・・・
(12)
where
m=
mk+m.
for
the
biaxial
bending,
'
Earthquake
resistancecapacity
maybe
evaluatedin
two
steps:
1.
If
the
solution
of
Eq.(7)
for
e?
is
found,
say
e,',
checkfor
leo"L<e..
;
m(e:}>m..・・・・---・'・--・---・・・--・・・・・--・・・・・・・-・・・・・・・・・・・・・・・・・・・----・・-・-・(13-a,b))
2,
If
e:
is
notfound
withine,.,
assume
e::=
e,.
for
Eqs.
(14)
and
C15-a),
ande:'ift==
e,.
for
Eq.
(15-b),
and
check
for
m"'i12>mc.・・・・-'-'''''"H'''"'''-'"'''''H"'''''''-'"'"'''''''"''''-'''''''''''H"''''''''''''''''''"''(14)
'
rZ"f2<?t,,.,
r".'i12<h,.・・・''・・・''''・-'''・・・''''-・'''・・・・''''''''''''''-'''""''''''・''・'・・・・----・・(15-a,b)
The
valuesof
e..,
m,.,
)t,,.
and
7in..
are
specified
apriori
as
design
criteria.
In
this
study,the
earthquake
resistance
capacity
ofthe
beam-column
is
evaluated
underthe
alternatelyrepeated
bending
appliedin
a
regular
manner,which
differs
from
the
real,
random
situation
brought
by
the
earthquake.
However,
the
resultsobtained
from
this
studymust
be
useful
as
aapproximate
measure
for
evaluatingthe
real earthquake resistancecapacity.
4.
Analysis
of
Beam-Columns
Using
Discrete
Element
Model
4.1
Formulation
for
Discrete
Element
Model
For
the
casethat
the
cross
section
is
divided
into
a
certain
numberof-discrete
elernents,
Eqs.
C
7
)
and
'
(10)
can
be
modifiedas
follows
:
Si
f(er・
)at+Sli
g(e7)ai-p=o-・・'・・・・・・・・・・''''''・''''''-'''''""''-HH'"""""'''''''''''''''''"'-"-'
(i6)
i=1 i`1
.
e:'if2-
e:
=='-IX..
,fC
e?"f2)at+
tT.li,
g(e?・
)at-p)laZ
'''''''''''-'''''""'''H'''""''''''''''''''''-'
(17)
-where
a,=A,IA
;
A,=::
area
ofi-th
element;
A
;=total
area;
aZ=
Clg(e?+
g)-f(e:)l12/(
¢
-
ip.)
;
C
== ratio
62
--NII-ElectronicMbrary
pf
web
area
to
the
total
area
;
and
m.,
7nt==number
of
yielded
elementsin
compression,
er
ih
tension,
respectively.
Expression
for
the
nondimensienal
bending
momentcarried
by
the
discrete
element
model atthe
load
point
(n+112)
is
simply
derived
as
m""!2=-tl;.i,
f(e?"!i)a,
nyi+te.t,
g(e?)a,oi+(e:'i!!-
e?)a:r:-・・・-・''-''・・''-・-''''--・''''''''"''--''
(18)
where
n,=nondimensienal
coordinate
ofi-th
element,r.=(g-e:'i!2+e:)!2/(ii-ip.);and
m=
M/(Aayd),
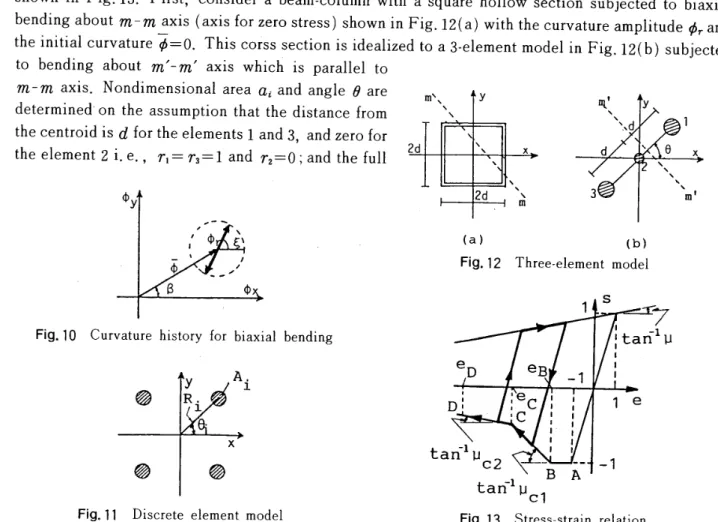
4,2
Biaxial
Bending
The
approach
to
the
problem
of
accumulated
strainexplained
above
can
be
extendedte
the
case
ofa
beam-column
subjected
to
alternately repeatedbiaxial
bending
withthe
nondimensional
curvature
history
shown
in
Fig.
10.
The
strain
occurring
in
the
i-th
element
shownin
Fig.
11
whenthe
curvature
reachesits
maximum
value
is
given
asfollows:
ei=
eo-
ri
cos
e
(ip
siR
X?
+
¢
rsine)+
r;
sin
e;L
(di
cos
ie+
ipr
cos
g)
=eo+r,Iipsin(a-fi)+ip.sin(en-e)1・・・・・-・・・・t-・--・・・・・・・-・i・・・・・・・・・-・・・・・--・--・・-・・・・・・--・--・・-ag)
where
r,=R,ld=nondimensional
distance
between
the
centroidand
the
i-th
element.The
expressionsof
the
convergence
condition
and
the
accumulated strainfor
the
case
of
biaxial
bending
are
thus
obtained
by
substituting
Eq.
(19)
into
Eqs.
<16)
and
(17),
respectiveLy.The
nondimensionalbending
moments
about
x-
andy-axes
canbe
derived
in
a
similar manipuiationto
the
derivation
of
Eq.
(18).
4.3
Expressions
for
Limits
of
Axial
Force
Ratio
In
this
section,
simpleexpressions
for
the
limits
of
the
axial
force
ratio accordingto
the
evaluation
criteria
for
the
earthqttake iesistancecapacity
are
derived
for
a
beam-colurnn
withsquare
hollow
section
idealized
to
a3-element
model
shownin
Fig.
12,
whiehhas
multi-linear
type
of
stress-strainrelation
shewn
in
Fig.
13.
First,
consider
abeam-column
with
a
square
holiow
section
subjected
to
biaxial
bending
aboutm-mLaxis
(axis
for
zerostress)
shownin
Fig.
12(a)
withthe
curvature
amplitudedi.
and
the
initial
curvaturee=O.
This
corsssection
is
iclealized
to
a
3-element
model inFig.
12(b)
subjected
to
bending
aboutm'-m'
axis
whichis
parallel
to
m-7n
axis.
Nondimensienal
areaa,
and
angle
e
are
determined'
onthe
assumption
that
the
distance
from
the
centroid
is
d
for
the
elements
1
and3,
and
zerofor
the
element
2
i.e.
,
r,=
rs=1
andr,=O;
and
the
full
diy
i--tltoN}
',-' ¢-'''
B
¢Fig.10
Curvature
history
for
biaxial
bending
y
A
a
R,1'x
e
e
i
Fig.
11
Discrete
element modelqtyNNxd
1
dxexNsNN
3
Nm1(a}
(b)
Fig.12
Three-element
model1s
7,ttan'iu
11eD
eB-1:
:D,
iec::le
,C::F,1t-1uan
''-c2
-1
BA
tan-1pcl
Fig,13
Stress-strain
Architectural Institute of Japan
NII-Electronic Library Service
ArchitecturalInstitute of Japanplastic
moment
of
the
square
hollow
section
bent
about
m-7n
axis
withthe
axial
force
ratiop
is
equaito
that
of
the
3-element
modelbent
about
7n'-m'
axis.Then,
a,=
a3==
a,
a2=1-2
a,
and
a
ande
aregiven
asfollows:
(i)
For1+2p-tane>O
a=
4tan2e+(3-4p2-tan2e)!18・・・・・・・・・-・・・・・・・・J・・・・・・・・-・・・・・・-・--・・・・・-・・・・・--・---・・・・・・-・・・-・・(20)
e=tanJ'
l2
tan
e/(3-4
p2-tan2g)}+
n12(iD
For1+2p-taneSO
a=(1+p)
l(1+tan6)2-2(1+p)tanigl2+l(1+tane)t-2(1+p)l2/2・-・-・・・・---・・・-・-・・・--・・-・-(21)
e=tan"[i(1+tane)2-2(1+p)tan2elll(1+tang)'-2(1+p)l]+n12
Each
segment
ofthe
compressivemultilinear
stress-strain
relation shownin
Fig.
13
can
be
expressed
iri
general
as
follows:
s=",(e-e)+g・・-・・・・・・・・-・・-・・・・・-・--・--・・・-・・--・----・-・-・・-・・・・・・--・・・-・・---"''-・・・・・・・・'''"・--・-(22>
where
p,=pt.i,
?=eB
and
g=-1
for
the
segmentBC,
for
example.
The
expressionfor
the
limiting
value
ofthe
axialforce
ratio controlledby
the
convergence
conditionfor
the
centroidalstrain
within alimiting
valuee..,
Eq.
(13-a),
is
derived
by
substituting
Eq.
(22)
into
the
convergencecondition,
Eq.(16),
withee=e..,
as
follows:
p)dwucw+d,xtef+5-H""-'"'''''""""'H"'''''"-""'""'''''""H'''''''''''''''''''''"'-'''''''(23)
where
a.=(1-2
a)(ecT-e)
af=alec.-
¢
.sin(e-e)-el5=
att
ig5rsin
(e-6)+ee.I+Q-2
a)
gw+a(1-st+Sf)
The
expression
for
the
bending
momentat
the
convergedstate
with
e,=e,.
is
obtainecl,
asfollows
:
m=al"(ec.+
¢
.sin(e-e)-1)+1-pcf(e..-ip.sin(e-e)-?)-gfl---・・・・・・・・・・・・-・・・・---(24)In
the
expressions
above,
the
subscnptw
indicates
the
quantities
relatedto
the
center
element
ofthe
3-element
model,
i,e.
,the
web
plate
element,and
f
the
flange
plate
elementin
compression.
The
values
of
",.,
u.x,
e,
g.
and
S.
aredetermined
from
Eq.
(22)
based
on
the
condition
that
e:=e..,
Expressions
for
the
limits
ofthe
axialforce
ratio accordingto
other
criteria,i,
e.,
Eqs.(13-b),
(14)
and
(15),
can
be
derived
with
a
similar
manipulationshown
above.
All
expressions
can
be
writtenin
the
ciosed-formexcept
for
the
onebased
on
Eq.
C15-b),
The
expressions
for
these
limits
are
quite
Iengthy
and
thus
omitted
here
[see
Refs,18)
through
21)].
4.4
Numerical
Examples
For
the
squarehollow
section
approximatedby
a
3-element
model,
the
relationsbetween
the
limits
of
the
axial
force
ratio
and
the
width-thicknessratio
are
numericallyanalysed,
based
onthe
criteriagiven
in
3.
4.
The
curvaturehistory
assignedis
as
shown
in
Fig,
10,
and
it
is
assumed
that
ip=O,
ip.=3,
fi=O,
e=oe
or
4sO.
The
parameters
of
stress-strainrelation
in
Fig.
13
is
specified
that
g=O.
02,
ec-
eB=
-5,
ep-eB=-100,
e.=O.11
%
(a.=2.4t!cm2)
or
O.
20
%
(a,=4.2tlcm2).
The
valuesxt,,
andpt,2
are
taken
so
that
the
assumed
stress-strainfelation
in
the
compression range might approximatethe
one
given
in
Eqs.(1)
and
(3
).
h
is
constantlyO.
15
for
allelements,
The
values ofnendimensional
areaa
of
elernents
1
and
3
in
Fig.12
is
taken
as
O.
38
for
e=OO
and
O.
35
for
e=450.
The
results of numerical analysisare
shown
in
Figs.
14
through
18
in
the
form
ofthe
relations
between
the
axial
force
ratiop
andthe
width-thickness
ratio
2
df
t.
whichare
determined
from
the'criteria
for
the
evaluation
of
the
earthquqkeresistance
capacitygiven
by
Eqs,
(13)
through
(15>,
The
solid
line
ih
Fig.
14
indicates
the
maximum
valueof
p
determined
by
Eq.
(13-a),
whenthe
centroidal
strain
just
converges
withe#=e.
(=e./e.;e.=-11u+1).
The
conditione:=e.
is
selected
sincethe
bending
momentbecomes
nearly zerowhen
e:
becomes
eqalto
e.
in
the
process
of
stiain
accumulation.The
dashed
anddotted
lines
in
Fig.
14
aredetermined
by
Eq.
(15-a),
where
?t,..
is
taken
equal
to
O.3
or
O.5
withe?=eB-5
oreB-10,
The
solidand
dashed
lines
in
Fig.
15
indicate
the
maximumvalue
ofp
detrmined
by
Eq.
(14)
withm..=o
or
o.
3,
whilethe
dotted
anddash-dotted
lines
arefor
p
determined
by
Eq.
(15-b)
with7h,.=O.
1
-64-p-e,s
-O.6
-O,4
-O.2
rscr=o.3
=etrB-s)B-10) e20
40
2d/tFig.14
Limit
ofp
based
onthe
convergencecondition and
the
value ofx,
p-O.8
-O,6
-O.4
-O.2
213o・
2e
402d/t
Fig.15
Limit
ofp
based
onthe
values of);,
and mp-o.e
nO.6
・-O.4
-O.2
o)
20
40
Fig.16
Effect
of curvature2dltamplitude
p-O.8
-O.6
-O.4
-O.2
o
20
)
402dlt
Fig.17
Effect
ofyield
stressp-O.B
-o.
-O.4
-O.2
)
O
20
40 2d/tFig.18
Effect
ofdirection
ofcurvhture vector
or
o,2,
both
calculated
withe:=eB-5
or
eB-10.
Figure16
showsthe
p-2dlt
relationsfor
the
curvature
amplitude
ip.=3
or6.
The
solid
line
is
determined
by
Eq.
(13-a)
with
e:=e.,
The
dashed
line
indicates
the
maximum value ofp
determined
by
Eq.
(15-a)
with?c,..=O,
5
and
e?=eB-5.
The
value
of
p
determined
by
Eq.
(15-a>
decreases
withthe
increase
in
ip.,
whilethe
value
of
¢
does
notaffect
much
the
valueof
p
determined
by
Eq.
(13-a).
Figure
17
comparesthe
effect
of
the
yield
stress
level,
i.
e.,
2.4
tlcm2(E.=0,
11
%)
and
4.
1
tlcm2(E.
=o.
20
%
),
on
the
value
of
p.
The
rimit
of
the
axialforce
ratio
need
to
be
setsmaller
withthe
increase
ofthe
yield
stress
level.
The
effectof
the
bending
direction
is
shownin
Fig.
Is
withg=O"
,uniaxial
bending
and4se
;
biaxial
bending.
The
direction
anglee
has
a
little
effect onthe
value
of
p
for
e,.=
e.,
but
otherwisethe
uniaxial
bending
iequires
the
smallerlimit
of
p
than
the
biaxial
bending.
5.
Conclusions
In
orderto
ascertainthe
safety
in
the
ultimate
stateof
thin-walled
beam-columns
which
showdegrading
behavior
due
to
local
buckling
understrong
earthquakes, aquantitative
evaluationrnethod
and
proper
criteriafor
the
earthquakeresistance
capacity
areproposed,
based
on
the
convergencecondition
for
the
centroidal strainancl
the
indicators
representing
the
rateof
strain
accumulationand
・the
rate
of
moment
capacitydeterioration,
which
are
derived
from
an
approximatestress
distribution.
The
proposed
method
andcriteria
involve
the
axial
force
ratio,
width-thickness ratioof
plate
element,
direction
of
the
curvature vector, curvatureamplitude,
yield
strain
and strain-hardening coefficientas
parameters,
and
the
effectsof
parameters
areinvestigated,
The
results
obtainedfrom
this
stttdy
are