i
A study on electrospray and its applications to the fabrication of
organic thin films and zinc oxide nanofibers
(静電塗布とその有機薄膜、
ZnO ナノファイバーへの応用に関する研究)
2014年9月
埼玉大学大学院理工学研究科(博士後期課程)
理工学専攻(主指導教員 鎌田 憲彦)
ii
Contents
1. Introduction ... 1 1.1 Background ... 1 1.1.1 History ... 1 1.1.2 Mechanism ... 1 1.1.3 Applications ... 4 1.2 Previous work ... 101.3 Purpose of the research ... 11
1.4 Framework of this thesis ... 12
2. Design of new electrospray setup and related apparatus ... 13
2.1 Design of electrospray setup ... 13
2.2 Design of fixture and circuit for the electrical measurement of photovoltaic cells ... 19
3. Investigation of spray current and its related parameters in electrospray process ... 27
3.1 Introduction ... 27
3.2 Experimental details ... 28
3.3 Measurement of spray current ... 29
3.3.1 Measurement of spray current with an oscilloscope ... 29
3.3.2 Measurement of spray current with an electrometer ... 30
3.4 Spray current caused by high voltage pulses ... 31
3.4.1 Spray current at positive high-voltage pulse ... 31
3.4.2 Spray current at negative high-voltage pulse ... 32
3.4.3 The spike in the spray current caused by high voltage pulse ... 34
3.4.4 Corona discharge in electrospray process ... 35
3.5 Applied voltage and its corresponding flow rate, spray current, and spray mode ... 35
3.6 Conclusions ... 38
4. Application of electrospray to the deposition of organic thin films ... 39
4.1 Poly(3,4-ethylenedioxythiophene):poly(styrenesulfonate) thin films deposited by the electrospray method 39 4.1.1 Introduction ... 39
4.1.2 Experimental details ... 40
4.1.3 The effect of the applied voltage on the properties of resultant PEDOT:PSS thin films ... 41
4.1.4 The effect of the concentration of solution on the morphology of resultant PEDOT:PSS thin films ... 44
4.1.5 The effect of relative humidity on the properties of the resultant PEDOT:PSS thin films ... 45
4.1.6 Conclusions ... 48
4.2 All electrospray deposited organic photovoltaic cells ... 48
iii
4.2.2 Experimental details ... 49
4.2.3 J-V characteristics of OPVs ... 50
4.2.4 Conclusions ... 51
4.3 High crystallinity parameter poly(3-hexylthiophene-2,5-diyl) thin film fabricated by the electrospray deposition method ... 51
4.3.1 Introduction ... 52
4.3.2 Experimental details ... 53
4.3.3 Diameter of jet and flow rate at different applied voltage and its corresponding film morphology ... 54
4.3.4 Raman spectroscopy analysis of the deposited films with three kinds of morphology ... 55
4.3.5 Conclusions ... 59
4.4 Self-assembly of poly(3-hexylthiophene-2,5-diyl) and phase separation in poly(3-hexylthiophene): fullerene derivative blend films in pulse driven electrospray deposition ... 59
4.4.1 Introduction ... 59
4.4.2 Experimental details ... 60
4.4.3 Investigation for the morphology of the P3HT thin films produced by the high-voltage pulse driving electrospray system ... 61
4.4.4 The effect of solvent evaporation on the self-assembly of P3HT during electrospray ... 62
4.4.5 Investigation on the morphology of the P3HT:PCBM blend films produced by the high-voltage pulse driving electrospray system ... 65
4.4.6 The effect of solvent evaporation on the self-assembly of P3HT in P3HT:PCBM blend films during electrospray ... 66
4.4.7 Characterization of phase separation in P3HT:PCBM blend films by scanning probe microscopy ... 67
4.4.8 Conclusions ... 68
5. Application of electrospray to electrospinning ... 69
5.1 One dimensional zinc oxide structures synthesized by electrospinning ... 69
5.1.1 Introduction ... 69
5.1.2 Experimental details ... 69
5.1.3 Effect of molecular weight of PVP and applied voltage on the morphology of resultant one dimensional ZnO structure ... 71
5.1.4 Morphology and transmittance of the one dimensional ZnO structures after calcination at different temperature ... 71
5.1.5 Current density–voltage characteristics of the inverted photovoltaic cells using the one dimensional ZnO structures as ETL ... 73
5.1.6 Conclusions ... 73
5.2 Diameter-controllable ultrathin zinc oxide nanofibers synthesized by electrospinning ... 74
5.2.1 Introduction ... 74
iv
5.2.3 The progression from grains to nanofibers... 75
5.2.4 Diameter control of ZnO-PVP nanofibers ... 76
5.2.5 Characterization of ZnO nanofibers after calcination ... 78
5.2.6 Conclusions ... 80
5.3 Hybrid inverted organic photovoltaic cells using electrospun zinc oxide nanofibers as electron transport layer 80 5.3.1 Introduction ... 80
5.3.2 Experimental details ... 81
5.3.3 Application of ZnO network of various morphology to inverted solar cells ... 82
5.3.4 The effect of calcination condition on the morphology of ZnO nanofibers ... 84
5.3.5 UV treatment for ZnO-PVP nanocomposite fibers to remove residual PVP content ... 86
5.3.6 Chemical surface treatment for ZnO-PVP nanocomposite fibers to remove residual PVP content ... 88
5.3.7 Conclusions ... 89
6. Conclusions and future works ... 91
6.1 Conclusions ... 91
6.2 Future works ... 92
7. Reference ... 93
8. Publication list ... 98
1
1. Introduction
1.1 Background
1.1.1 History
In the late 16th century William Gilbert set out to describe the behavior of magnetic and electrostatic phenomena [1]. He observed that, in the presence of a charged piece of amber, a drop of water deformed into a cone. This effect is clearly related to electrosprays, even though Gilbert did not record any observation related to liquid dispersion under the effect of the electric field.
In 1750 the French clergyman and physicist Jean-Antoine (Abbé) Nollet noted water flowing from a vessel would aerosolize if the vessel was electrified and placed near electrical ground. He also noted that similarly ―a person, electrified by connection to a high-voltage generator, would not bleed normally if he were to cut himself; blood would spray from the wound.‖[2]
Liquids can readily interact with electric fields. The interaction of field induced or injected charges in liquids with external electric field causes liquids to move, break into drops or spray into jets or strings of fine droplets. Lord Rayleigh was first to describe instabilities of a charged liquid drop back in 1882 [3].
One important case of liquid in the capillary deserves special mention as it serves as a basis of many and varied technological applications. An electric field acts on a liquid meniscus, counteracted by a surface tension. In a strong enough field a cone is formed that emits a jet of liquid from its tip. This jet breaks into plume due to the Rayleigh instability of the charged liquid. The first scientific observation of this phenomenon was reported by the physicist John Zeleny in 1914 [4]. The physics of interaction of a liquid in capillaries with electric fields was established forty years ago by Taylor [5].
Practical use of that interaction has appeared in industry. For example, car bodies are coated by a thin uniform layer of paint, thanks to use of electrospray gun. Also, crop-dusting with insecticides relies on the same idea. At the other end of the scale application of nano-electrospray has revolutionised mass-spectroscopy of bio-molecules [6, 7]. The benefits of electrospray include high material deposition efficiency as the droplets are moved and directed by the electrostatic force, simplicity of experimental set up and great flexibility in the choice of starting materials, which results in a broad range of compositions and morphologies. The ability of electrospray to repeatedly generate very small and uniform volumes of liquid [8]also makes it into one of the important tools of nanotechnology.
1.1.2 Mechanism
Lord Rayleigh wrote in 1882 that an excessive charge q on the droplets of liquid would lead to their disintegration as soon as the repulsive force between the charges on the droplet surface exceeds surface
2
tensions [3]. The chances of droplet disintegrating can be described by ―fissility‖ X, which is a ratio of electrostatic repulsion force to the surface force:
(1) Rayleigh has demonstrated that for X<1 the spherical form of the charged droplet is preserved. However, as X is getting closer to 1, a shape instability caused by increased charge repulsion results in the elongation of the drop, turning it into an ellipsoid. Eventually, continuing elongation results in the droplet partitioning into two smaller identical droplets of equal charge. The case of X>>1 was described by Rayleigh only in words, stating that, "the liquid is thrown out in fine jets, whose fineness however has a limit". It was observed recently using microphotography that fine jets are produced even at X =1 [27]; the authors have suggested that an old theory needs revision.
Figure 1.1 A schematic diagram of a typical electrospray setup
In a typical electrospray set up (see Figure 1.1) an accumulation of charges on the surface of the liquid makes the surface unstable and leads to the formation of the Taylor cone (see Figure 1.2), usually with an angle close to the predicted static half angle of 49.3° [9].
3
Figure 1.2 A image of the Taylor cone and the jet produced by our electrospray setup. Left and right images correspond to before and after applying high voltage to the solution in the glass capillary. However, some deviations and alternative stable angles are possible for high viscosity liquids, e.g. polymer solutions [10]. The onset voltage required to start jet production is proportional to the square root of the surface tension multiplied by the radius of the capillary orifice. The higher the onset voltage the greater are the chances of an electrical discharge. The radius of the atomized droplet is also a function of the surface tension , liquid density and liquid flow rate :
(2)
Droplets leaving the surface of the cone are charged and accelerated by the electric field towards a counter electrode (see Figure 1.1). They lose some liquid due to evaporation which leads to the growth in surface charge density and consequent Coulombic explosions, which reduce even further the droplet sizes and form satellite droplets containing single ions. A cone-jet mode depicted in Fig. 1.2 is just one of the many possible modes. The authors of have tried to classify the known modes in order to reduce confusion and misunderstanding amongst the researchers in electrospray area [11]. They reviewed the modes observed in air and in vacuum and compared them with those in earlier works. They have proposed a terminology to describe non-dripping modes, with the main modes being cone-jet, multi-jet, micro-dripping, simple jet, ramified jet (including fan configuration) and spindle (including harmonic spraying).
Several theoretical models have been developed to describe the processes happening during the electrospray operation. For example in a theory of electrospray transport, evaporation and deposition on a
4
heated substrate was built by studying tracks of single droplets [12]. The authors calculated droplet mass and heat transfer under forced convection and compared them with limiting cases of electrospray transport only or droplet evaporation only. The model also described segregation of primary and satellite electrospray droplets, which is in agreement with experimental data. They conclude that the droplet transport is hardly affected by the diameter of droplet. On the contrary, evaporation can strongly affect the droplet size and salt concentration. Parameters such as substrate temperature, initial droplet diameter and vapor transport may affect the film quality.
The Taylor cone is a very dynamic system, which deforms, oscillates and contains convection flows of charge and mass. It was shown recently that Taylor cone deformations play a central role in the mechanism of electrostatic spraying [13]. In most electrospray regimes spray currents do oscillate spontaneously. By employing fast time-lapse imaging of the Taylor cone throughout its evolution the authors have demonstrated the presence of a nodal line and standing waves on its surface. They have identified four phases of the cone pulsation cycle (liquid accumulation, cone formation, ejection of a jet, relaxation). Using image analysis they have measured apex velocities, curvatures, and opening angles of the Taylor cone. Singularities in apex velocity during jet ejection were detected. Using light refraction and Fourier analysis, supplemented by electrospray current measurements they established that pulsations in the Taylor cone lead to current oscillations. A stabilization of the spray process can be achieved through monitoring the oscillation frequency and adjusting the spray parameters accordingly. Progress in electrospray technology would have been impossible without a continuous development of electrospray apparatus.
1.1.3 Applications
Electrospray is a versatile tool and has a variety of applications, i.e. mass spectrometry, electrospinning, micro- and nano-thin-film deposition, micro- and nano-particle production etc.
(1) Electrospray ionization
Electrospray became widely used as ionization source for mass spectrometry after the Fenn group successfully demonstrated its use as ion source for the analysis of large biomolecules. Electrospray ionization (ESI) is especially useful in producing ions from macromolecules because it overcomes the propensity of these molecules to fragment when ionized. Additionally and arguably more importantly, ESI is advantageous over other atmospheric pressure ionization processes (e.g. MALDI) since it may produce multiply charged ions, effectively extending the mass range of the analyser to accommodate the KDa-MDa orders of magnitude observed in proteins and their associated polypeptide fragments [14].
5
Mass spectrometry using ESI is called electrospray ionization mass spectrometry (ESI-MS) or, less commonly, electrospray mass spectrometry (ES-MS). ESI is a so-called 'soft ionization' technique, since there is very little fragmentation. This can be advantageous in the sense that the molecular ion (or more accurately a pseudo molecular ion) is always observed, however very little structural information can be gained from the simple mass spectrum obtained. This disadvantage can be overcome by coupling ESI with tandem mass spectrometry (ESI-MS/MS). Another important advantage of ESI is that solution-phase information can be retained into the gas-phase.
The electrospray ionization technique was first reported by Masamichi Yamashita and John Fenn in 1984 [15].The development of electrospray ionization for the analysis of biological macromolecules was rewarded with the attribution of the Nobel Prize in Chemistry to John Bennett Fenn in 2002 [7]. One of the original instruments used by Dr. Fenn is on display at the Chemical Heritage Foundation in Philadelphia, Pennsylvania.
The electrosprays operated at low flow rates generate much smaller initial droplets, which ensure improved ionization efficiency. In 1993 Gale and Richard D. Smith reported significant sensitivity increases could be achieved using lower flow rates, and down to 200 nL/min [16]. In 1994, two research groups coined the name micro-electrospray (microspray) for electrosprays working at low flow rates. Emmett and Caprioli demonstrated improved performance for HPLC-MS analyses when the electrospray was operated at 300–800 nL/min [17]. Wilm and Mann demonstrated that a capillary flow of ~ 25 nL/min can sustain an electrospray at the tip of emitters fabricated by pulling glass capillaries to a few micrometers [18]. The latter was renamed nano-electrospray (nanospray) in 1996 [19]. Currently the name nanospray is also in use for electrosprays fed by pumps at low flow rates, not only for self-fed electrosprays [20]. Although there may not be a well-defined flow rate range for electrospray, microspray, and nano-electrospray, studied "changes in analyte partition during droplet fission prior to ion release" [21]. In this paper, they compare results obtained by three other groups and then measure the signal intensity ratio [Ba2+ + Ba+]/[BaBr+] at different flow rates [18].
Cold spray ionization is a form of electrospray in which the solution containing the sample is forced through a small cold capillary (10-80 °C) into an electric field to create a fine mist of cold charged droplet [22]. Applications of this method include the analysis of fragile molecules and guest-host interactions that cannot be studied using regular electrospray ionization.
Electrospray ionization has also been achieved at pressures as low as 25 torr and termed subambient pressure ionization with nanoelectrospray (SPIN) based upon a two-stage ion funnel interface developed by Richard D. Smith and coworkers [23]. The SPIN implementation provided increased sensitivity due to the
6
use of ion funnels that helped confine and transfer ions to the lower pressure region of the mass spectrometer. Operation at low pressure was particularly effective for low flow rates where the smaller electrospray droplet size allowed effective desolvation and ion formation to be achieved. As a result later the researchers were later able to demonstrate achieving in excess of 50% overall ionization utilization efficiency for transfer of ions from the liquid phase, into the gas phase as ions, and through the dual ion funnel interface to the mass spectrometer [24].
(2) Electrospinning
Similarly to the standard electrospray, the application of high voltage to a polymer solution can result in the formation of a cone-jet geometry. If the jet turns into very fine fibers instead of breaking into small droplets, the process is known as electrospinning. Electrospinning shares characteristics of both electrospraying and conventional solution dry spinning of fibers [25]. The process does not require the use of coagulation chemistry or high temperatures to produce solid threads from solution. This makes the process particularly suited to the production of fibers using large and complex molecules. Electrospinning from molten precursors is also practised; this method ensures that no solvent can be carried over into the final product.
When a sufficiently high voltage is applied to a liquid droplet, the body of the liquid becomes charged, and electrostatic repulsion counteracts the surface tension and the droplet is stretched; at a critical point a stream of liquid erupts from the surface. This point of eruption is known as the Taylor cone. If the molecular cohesion of the liquid is sufficiently high, stream breakup does not occur (if it does, droplets are electrosprayed) and a charged liquid jet is formed.
As the jet dries in flight, the mode of current flow changes from ohmic to convective as the charge migrates to the surface of the fiber. The jet is then elongated by a whipping process caused by electrostatic repulsion initiated at small bends in the fiber, until it is finally deposited on the grounded collector. The elongation and thinning of the fiber resulting from this bending instability leads to the formation of uniform fibers with nanometer-scale diameters [26].
The standard laboratory setup for electrospinning consists of a spinneret (typically a hypodermic syringe needle) connected to a high-voltage (5 to 50 kV) direct current power supply, a syringe pump, and a grounded collector. A polymer solution, sol-gel, particulate suspension or melt is loaded into the syringe and this liquid is extruded from the needle tip at a constant rate by a syringe pump [27]. Alternatively, the droplet at the tip of the spinneret can be replenished by feeding from a header tank providing a constant feed pressure. This constant pressure type feed works better for lower viscosity feedstocks.
7
Modification of the spinneret and/or the type of solution can allow for the creation of fibers with unique structures and properties. Electrospun fibers can adopt a porous or core–shell morphology depending on the type of materials being spun as well as the evaporation rates and miscibility for the solvents involved. For techniques which involve multiple spinning fluids, the general criteria for the creation of fibers depends upon the spinnability of the outer solution [28]. This opens up the possibility of creating composite fibers which can function as drug delivery systems or possess the ability to self-heal upon failure [29, 30].
The size of an electrospun fiber can be in the nano scale and the fibers may possess nano scale surface texture, leading to different modes of interaction with other materials compared with macroscale materials [31]. In addition to this, the ultra-fine fibers produced by electrospinning are expected to have two main properties, a very high surface to volume ratio, and a relatively defect free structure at the molecular level. This first property makes electrospun material suitable for activities requiring a high degree of physical contact, such as providing sites for chemical reactions, or the capture of small sized particulate material by physical entanglement-filtration. The second property should allow electrospun fibers to approach the theoretical maximum strength of the spun material, opening up the possibility of making high mechanical performance composite materials.
(3) Micro- and nano- thin film deposition
Thin solid films, thinner than 10 mm, are used in manufacturing micro- and nano- electromechanical systems (MEMS or NEMS), in microelectronic devices as semiconducting, insulating or conducting layers, or for improving surface properties of mechanical elements. Electrospray facilitates the production of extremely thin layers, which can be crack-free and more homogeneous than those obtained by other methods. The process is simple, cheap, flexible, and easy to control. Compared to other methods such as chemical vapor deposition (CVD) or physical vapor deposition (PVD), its main advantage is that the growth rate of the layer is relatively high. For example, the deposition rate of a 1-mm thin-film layer produced by electrospray is about 0.1 mm/min [144], while for PVD it is in the range of 0.006–0.06 mm/min [145], and for CVD from 0.02 to 0.05 mm/min [144]. The electrospray process can be carried out in an ambient atmosphere, in air or other gas, and at low temperature, without the need for complex reactors and high-vacuum systems. Using the electrospray deposition technique, highly pure materials can be produced, with structural control at the nanometer scale. The electrospray method is also a very efficient process because at least 80–90% of base material can be deposited onto the substrate.
Recently, many researchers have tested the electrospray deposition technique of liquid-phase materials on various substrates. Electrospray deposition is a process in which droplets produced by electrospray from a solution or suspension of a material to be deposited are targeted to a substrate to form a tight surface layer.
8
A solid layer is obtained after solvent evaporation. Evaporation can be sped-up by heating the substrate. To improve mechanical properties, the layer may be sintered at higher temperatures, if applicable.
Usually, the material to be deposited is sprayed directly onto the substrate, but the layer can also be formed from a precursor. The precursor is a compound which is decomposed at high temperature or converted to another substance in chemical reactions with other compound sprayed simultaneously or delivered in the gaseous phase. The reactions usually take place on the substrate, and a new product is obtained.
Initially, electrospray was used to produce thin layers of radioactive materials, such as a- or b-particle sources or neutron emitters (e.g. obtained from U233, Pu238, Am241 or Cm242 nitrates) [32, 33] or targets prepared for activation in particle accelerators or nuclear reactors. Nowadays, electrospray is involved in nanotechnology and nanoelectronics for thin-film deposition. All the authors reported that the films produced by electrospray were homogeneous and composed of small agglomerates built of particles smaller than 1 mm, which were the particles of dry powder used for preparing a suspension, or crystallites smaller than 1 mm. The crystallites are formed as an effect of solvent evaporation from the droplet during its flight towards the substrate. In specific cases the layer exhibit better properties than those obtained by other methods. For example, in the case of lithium batteries, the cathode or anode deposited by the electrospray method showed very stable charging/ discharging characteristics. The spray systems used usually operate in the cone-jet mode, but sometimes the multi-jet mode also is used [34]. The multi-jet mode made it possible to obtain simultaneously a large number of emission cones and droplets smaller than those obtainable from a single cone. Changing the physical properties of the liquid to be sprayed allows tailoring, to some extent, of the film morphology. The quality of thin film formed on a substrate strongly depends on the size of particles or droplets forming the layer, and their monodispersity. Even layers of uniform thickness are obtained when the droplets are uniformly dispersed over the substrate. Smaller particles of narrow size distribution are required in order to reduce the number and size of voids, flaws, and cracks in the film. Thus electrospray is a promising tool for the production of high quality layers, because it fulfills all of these requirements. This technique allows generating fine droplets in micro- and submicron size ranges, with narrow size distribution. Electrostatic forces disperse the droplets homogeneously in the space between the nozzle and the substrate. The film thickness, its crystallinity, texture, and deposition rate can be easily controlled by varying the voltage, flow rate, concentration of the material to be deposited, and the substrate temperature. Many authors have optimized the electrospray process with regard to its application to thin-film deposition in nanotechnology [35, 36]. The electrospray methods used for thin-film deposition have been reviewed by Jaworek et al [37].
9
Electrospray was successfully tested as a tool for fine particle production [38, 39]. Nanoparticles may also be deposited to create thin solid films. Fine particles of size smaller than 10 mm are, for example, applied for ceramic coatings, paints, or emulsion production, as powder in the cosmetic or pharmaceutical industries, or as toner in electro-reprographic systems. Conventional methods of synthesis of nanoparticles in the gas phase for electronic, optical and magnetic applications were reviewed by Kruis et al. [40] with only minor attention to electrospray.
The solvent from the electrosprayed droplets evaporates, and the remaining solid material forms a fine powder. The particles are produced from a solution or suspension of a solid material. For the solution based droplets, the remaining substance crystallizes forming solid particles. When a suspension is used for powder production, the nanosized particles suspended in the solvent form a tight cluster after the droplets dry. The size of such particles can be controlled by changing the concentration of the dissolved or suspended substance.
Electrospray allows the generation of particles of small size, down to 10 nm, and of high monodispersity [41-43]. At the present time, the size of smallest particle reported is 4 nm [182]. The materials from which the micro- and nanoparticles were produced via electrospray, the size of the obtained particles, and the production rate are summarized in Table 4. From this table we can see that the production rate of the particles is usually in the range of 105–104 particles/s for particles of about 10 mm, increasing to 1010–1011 particles/s for particles smaller than 10 nm. The cone-jet mode, most frequently used for the production of powders, operates only over limited voltage and flow-rate ranges. Any change in physical properties of the liquid—due, for example, to temperature variation-may also change this mode to another, or shift the operating range to other values of voltage and flow rate. The size and monodispersity of the droplets and particles can also undergo unacceptable change.
The problem was solved by using pulsed or ac voltage superimposed on dc-bias voltage (ac/dc excitation) [44, 45]. When the frequency of the ac voltage is properly tuned, the jet disintegrates into a stream of droplets of uniform size. The size of the droplets can be controlled by the dc-bias and ac-voltage magnitudes, ac frequency, and flow rate of the liquid. The production rate of particles can be controlled by the flow rate and excitation frequency.
An electrospray system using ac/dc excitation was first proposed by Vonnegut and Neubauer [46]. The process of drop formation was controlled by an AC voltage at 60 Hz applied to the capillary. Later, ac/dc electrospray systems were developed by Sample and Bollini [44], Bollini et al. [45], and Sato et al. [47]. The synchronous mode of droplet generation operates within a limited range of flow rate and ac frequency. Low viscosity of the liquid to be sprayed is favorable to synchronous generation over wider frequency and
10
flow-rate ranges [48]. An increase in the flow rate allows droplet generation with higher frequency. From the reviewed literature it can be concluded that electrospray allows production of fine solid particles over broad size range, from about 100 mm down to a few nanometers, and of small standard deviation. The production of such particles via electrospray is easier than by other methods. This technique is particularly useful for the production of metal oxides or ceramic powders from the liquid phase. The size of the droplets and particles can be controlled by flow rate of the liquid, the voltage, or by the frequency of ac excitation. It was reported by many authors that electrospray allows fine powder production without significant change in chemical composition and physical properties of the material to be sprayed. This process seems to be useful for industries requiring fine powders of material that must remain unaffected during the production process.
Except the applications described above, electrospray is also applied to colloid thrusters, fabrication if drug carriers, liquid metal ion sourcing, air purifiers, etc.
1.2 Previous work
In previous study, laboratory members try to fabricate high performance organic semiconducting devices, including organic photoconductive devices, organic photovoltaic cells, and organic light-emitting diode, by the electrospray technique.
A blue-sensitive organic photoconductive device fabricated by an electrospray deposition method was demonstrated [49]. Poly[9,9-dioctylfluorenyl-2,7-diyl]-co-1,4-benzo-(2,1,3)-thiadiazole (F8BT) was chosen as a bluesensitive polymer, and a maximum external quantum efficiency of 0.22% was achieved at the irradiated optical intensity of 3.9 mW/cm2. The absorption spectrum of F8BT neat film showed that the selectivity of spectral responses at the blue wavelength region was good enough to divide the incident light into blue color components. These results indicate the possibility of a color separation without a prism for high resolution cameras by combination of green and red sensitive organic photoconductive devices. Though the higher applied voltage is required for the fast deposition, I found that the molecular structure of F8BT was broken by applying the high voltage. The optimized voltage was less than 8 kV in the case of F8BT. The external quantum efficiency of device is not high enough for practical applications. However, this result suggests that the organic photoconductive device sensitive to blue lights was achieved using F8BT as a photoconductive layer by the ESD method. Further improvement will be realized by optimizing the fabrication process and the device structure.
Colleagues achieved the reduced the surface roughness of F8BT thin film fabricated by the electrospray deposition technique, using two organic solvents [50]. The root mean square (RMS) roughness of the F8BT thin film was reduced by the addition of dimethyl sulfoxide (DMSO) in tetrahydrofuran (THF). A minimum RMS roughness of 23 nm was obtained by optimizing the ratio of DMSO in THF. I found that the low
11
evaporation pressure of the additional organic solvent is an important factor in attaining a smooth surface for F8BT thin film. The current density-voltage-luminance characteristic of the organic light-emitting diode was improved by reducing the surface roughness of the F8BT layer. A maximum luminance of 36.7 cd/cm2 was obtained, and it was more than 14 times higher than the reference device fabricated by the conventional single organic solvent technique.
Colleagues successfully achieved the smooth surface roughness of the P3HT:PCBM layer by the ESD method with the mixed organic solvent technique (o-DCB and acetone). A high-efficiency bulk heterojunction organic photovoltaic cell (OPV) was achieved by the electrospray deposition method [51]. The surface roughness of the P3HT:PCBM thin film can be reduced using the mixed solvent consisting of o-dichlorobenzene (o-DCB) and acetone. The effect of acetone concentration is related to its dielectric constant. Under optimized concentration of acetone in o-DCB (20 vol%), the P3HT/PCBM active layer with the smooth surface can be formed, and the power conversion efficiency of the OPV was 1.9%.
A smooth surface of the poly(3-hexylthiophene) (P3HT)-doped-(6,6)-phenyl-C61-butyric acid methyl ester (PCBM) thin film was achieved by mixing different solvents for the electrospray deposition method [52]. As a result, the high power-conversion efficiency (PCE) of the bulk-heterojunction organic photovoltaic cell (OPV) was comparable to that obtained in the case of the spin-coating method. By optimizing the additional solvent in o-dichlorobenzene, the P3HT/PCBM active layer with the root-means-square roughness of 2.23 nm and the PCE of 2.2% was fabricated employing acetonitrile as the additional solvent.
1.3 Purpose of the research
As described in Section 1.2, I have demonstrated that electrospray deposition can be used to fabricate organic semiconducting devices. A lot of work on improving the performance of organic devices has been done. The performance of some electrospray-deposited devices is comparable, but still lower than the corresponding spin-coated devices. In order to further improve the performance of electrospray-deposited devices, we have to search for the optimal parameters for a given material in electrospray deposition, including applied voltage, additive, concentration of precursor solution, deposition time, deposition mode, etc.
In electrospray deposition, a mist of charged droplets is produced from a capillary and accumulates on the substrate to form a thin film. Since the mechanism of thin film formation in electrospray deposition is completely different from the conventional coating methods, e.g. spin coating, it is indispensable to determine the limitations of electrospray deposition for its organic device applications.
12
A significant advantage of electrospray deposition is that it can produce thin films of unique characteristics, i.e. self-assembly, high crystallinity, and high ordering, which cannot be obtained in thin films coated by other process. If I can clarify the mechanism and find proper deposition conditions, manipulation of these characteristics will facilitate the application of organic thin films in electronics.
Even better, electrospray can produce not only thin films but also other structures, e.g. fibers. However, the investigation on how to better apply electrospun fibers to organic devices has so far been only very occasionally addressed. In order to realize the full potential of electrospray, this is one direction in which I should try to extend its application field.
1.4 Framework of this thesis
General introduction to electrospray and its applications is given in Chapter 1. Beside the content regarding history, mechanism, and applications of electrospray, I review the previous work done in our laboratory. The motivation of this research is also described in this chapter.
Chapter 2 and 3 concentrate on electrospray itself. I show engineering drawings of each component of the new electrospray setup and the tester in Chapter 2. The principle of the designing and the improvements compared with previous setup are stated. In Chapter 3, I not only present spray current at various applied voltage, but also interpretation of the mechanism behind the difference between spray currents. In addition, I show the correspondence between the electrospray deposition parameters, including applied voltage, flow rate, spray current, and spray mode.
I show the work on two applications of electrospray, deposition of organic thin films and fabrication of ZnO nanofibers, in Chapter 4 and 5, respectively. The contents of these two chapters are main part of this thesis. In Chapter 4, three kinds of organic thin films (PEDOT:PSS thin films, P3HT thin films, and P3HT:PCBM thin films) fabricated through electrospray deposition were investigated. Characterization of these thin films is declared. In Chapter 5, I fabricated ZnO nanofibers of different diameter and figure out the key factors which determines the diameter of the ZnO nanofibers. The ZnO nanofibers were applied to inverted solar cells and the performance of the cells is presented at the end of this chapter.
13
2. Design of new electrospray setup and related apparatus
2.1 Design of electrospray setup
After using the previous electrospray setup for experiment upon organic photovoltaic fabrication, I found it is difficult to realize precise adjustment and control. Besides, new functions, i.e. multi-nozzle mode, temperature control of substrate, etc., are become indispensible for new experiments. So I built a new electrospray setup. The images of the previous electrospray setup and the new one are shown in Figure 2.1.
Figure 2.1 Images of the previous electrospray setup (left) and the new one (right). I made many improvements as follows.
(1) The wallboards in previous electrospray setup were replaced by 3 props. The space between the capillary and the counter electrode was enlarged to eliminate the boundary effect in electrospray;
(2) I make the temperature of substrate controllable by adding a hotplate into the electrospray system;
(3) Dual-nozzle mode is available in the new setup, and the position of two nozzles can be controlled separately;
14
(4) Two high voltage power sources with both DC and pulse output functions were introduced to control the evaporation of solvent during electrospray process. The two nozzles were connected with the two high voltage power sources, and the applied voltage can be controlled separately;
(5) The whole electrospray setup was put into a glove box to insulate it from the outside and make the experimental environment controllable;
(6) Lasers and CCD cameras were fixed on the track which facilitates minor adjustment of their position. The new electrospray setup was designed with a three dimensional modeling software. A general assembly drawing for the electrospray setup is shown in Figure 2.2. Two dimensional engeneering drawings for each conponent of the electrospray setup were also done for its practical manufacture.
Figure 2.2 A general assembly drawing for the electrospray setup
Figure 2.3 shows a 2D engeneering drawing for the mothreboard. We can see that relative positions of props and tracks are fixed on the motherboard, which makes the new setup portable and more reliable.
15
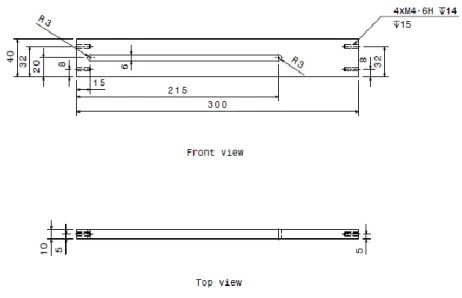
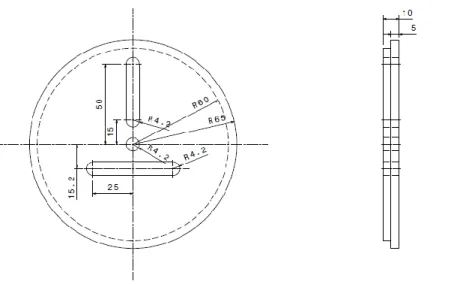
Figure 2.3 An two dimensional engineering drawing for the mothreboard of the electrospray setup I degined a slot in the center of each prop, which make the distance between the capillary tip and substrate linear varable, see Figure 2.4.
16
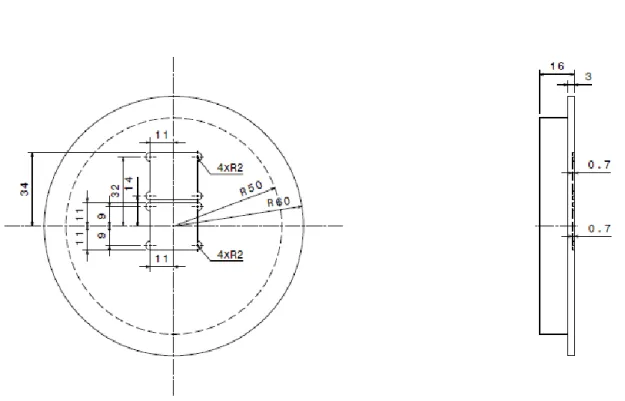
Figure 2.5 An two dimensional engineering drawing for the top cover of the electrospray setup As we can see in Figure 2.6, two slots which are perpendicular to each other were made in the capillary holder base, which makes it possible to work in multi-nozzle mode. Relative position of two capillaries can be adjusted in the slots. In addition, I don‘t need to design new top cover for different capillary holder base since this base can be changed separately.
Figure 2.6 An two dimensional engineering drawing for the capillary holder base on the top cover of the electrospray setup
17
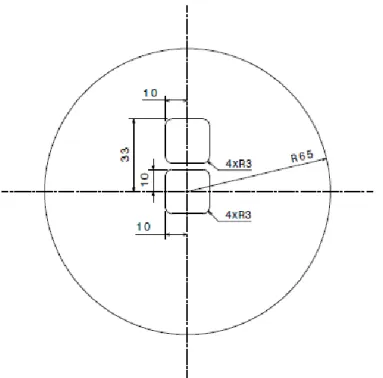
Figure 2.7 An two dimensional engineering drawing for the coill holder base of the electrospray setup A series of round slots with diameter of 30, 50, 70, and 90 nm were made to load coil of different diameters, by which I can investigate the effect of diameter of coil on the characteristics of electrospray.
Figure 2.8 An two dimensional engineering drawing for the coill holder on the middle cover of the electrospray setup
18
Figure 2.9 An two dimensional engineering drawing for the base of substrate holder of the electrospray setup
19
Figure 2.11 An two dimensional engineering drawing for the mask of substrate holder of the electrospray setup
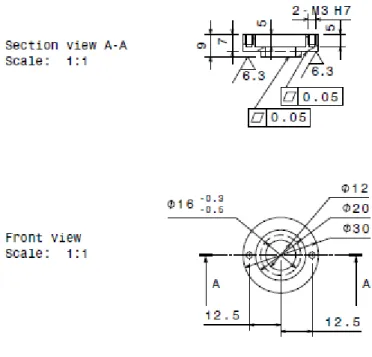
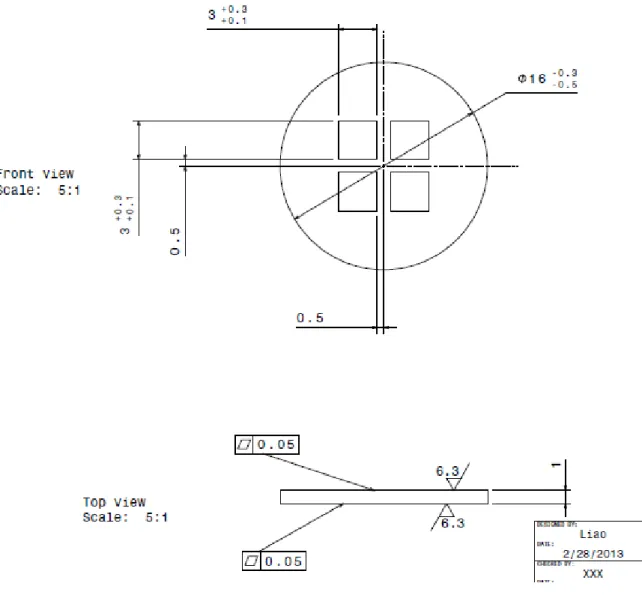
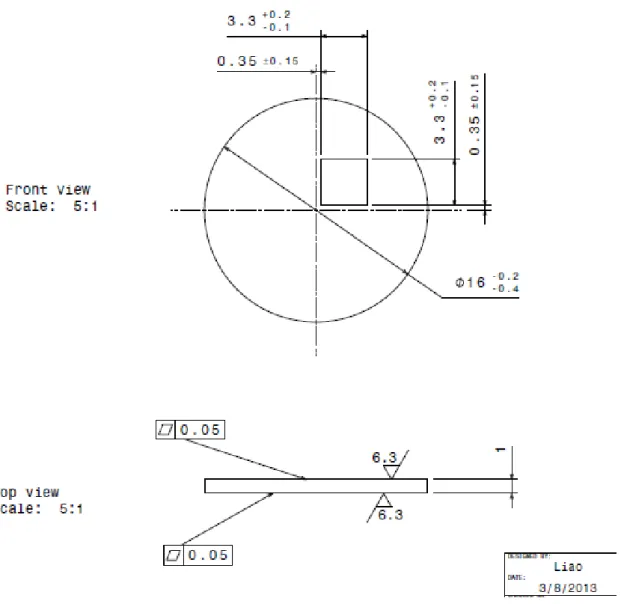
2.2 Design of fixture and circuit for the electrical measurement of photovoltaic cells
At the end of each experiment on the fabrication of organic photovoltaics, it will take at least 30 min to connect the electrodes of the organic photovoltaics to the terminal on the circuit board with silver paste and electric iron. This is fatal for the performance testing of organic photovoltaics, since the organic functional layers in the devices are very sensitive to oxygen and moisture and will appear degradation when they are exposed in the ambient. So I design a fixture and a connecting circuit for the electrical measurement of our organic photovoltaics, see Figure 2.12. The organic photovoltaics can be loaded into this tester within few seconds, which significantly reduce the time of preparation before performance testing.
20
Figure 2.12 Image of the tester using for the electrical measurement of photovoltaic cells
This tester was also design with a three dimensional modeling software. The corresponding two dimensional engineering drawings are shown as follows. International tolerance grade of H7/h6 was used for the designing of this tester, since the distance between the electrodes of the organic photovoltaics on the glass substrate is on the 1 mm scale. I also set geometric tolerance, i.e. planarity, to meet the requirements for precisely positioning of the tested sample. In order to ensure the relative location of the base and the mask, I designed two locator holes, see Figure 2.13.
21
22
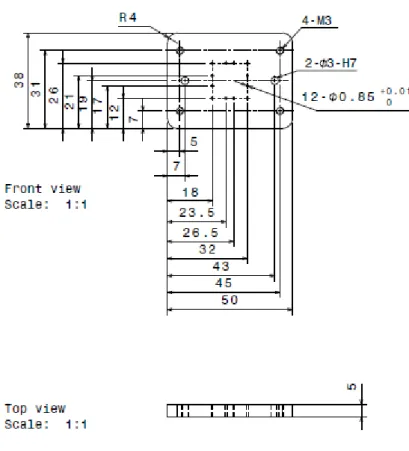
Figure 2.14 An two dimensional engineering drawing for the bottom plate of the tester
23
24
25
Figure 2.18 An two dimensional engineering drawing for the probe holder of the tester
26
27
3. Investigation of spray current and its related parameters in electrospray process
3.1 Introduction
Electrospray is a convenient tool to deliver ions from the liquid phase to the gas phase, so that they may subsequently be analyzed by mass spectrometry [7, 53, 54]. The inherent electrochemical nature of the ES device was first expounded by Paul Kebarle and coworkers [55], but in many cases, as discussed in an excellent presentation of arguments by de la Mora, Van Berkel, Enke, and Fenn [56], experimentalists are often unaware of the electrochemical processes taking place during the operation of electrospray. In order to use electrospray prudently and efficiently, and to be able to remove chance elements, and extend its reach into new applications, a good grasp of the fundamental electrochemistry that underlies electrospray becomes necessary.
Figure 3.1 A schematic diagram of electrospray process
Figure 3.1 shows a schematic diagram of electrospray process. In electrospray, a dilute solution is pumped through a capillary at a very low flow rate (0.1–10 mL/min). A high voltage (3–10 kV) is applied to the capillary. This voltage can be either negative or positive, depending on the solution chosen. The applied voltage provides the electric field gradient required to produce charge separation at the surface of the liquid. As a result, the liquid protrudes from the capillary tip in what is known as a ‗‗Taylor cone‘‘ (see Figure 1.2). When the solution that comprises the Taylor cone reaches the Rayleigh limit [54], the point at which Coulombic repulsion of the surface charge is equal to the surface tension of the solution, droplets that contain an excess of positive or negative charge detach from its tip. These droplets move through the atmosphere towards the counter electrode, and generate charged ions by one of several proposed mechanisms [57]. The coulomb fission mechanism assumes that the increased charge density due to solvent
28
evaporation causes large droplets to divide into smaller and smaller droplets, which eventually consist only of single ions [6]. A second mechanism, known as ion evaporation, assumes that the increased charge density that results from solvent evaporation eventually causes coulombic repulsion to overcome the liquid‘s surface tension, resulting in a release of ions from droplet surfaces [58]. Regardless of the mechanism by which they are produced, the excess negative charge is neutralized electrochemically at the emitter to balance the charge loss. Imbalances between the amount of charge generated electrochemically and the amount of charge lost at the cone apex can lead to several electrospray operating regimes. For cone-jet electrosprays, the potential at the metal/liquid interface self-regulates to generate the same amount of charge as that lost through the cone apex [59].
The charging of new surface as the droplets form and leave the tip requires a flow of charge from the power supply. The electrical circuit that sustains this current can be traced from the positive terminal of the power supply, to the solution via a metal electrode, through the gap that separates the capillary tip and the counter electrode, to ion neutralization at the counter electrode, and back to the negative terminal of the power supply (For negative electrospray, the power supply is reversed). The current through each element of the series circuit must be the same. Thus, the current measured by the current meter shown in Figure 3.1 is a measure of the rate of the charge collected on the counter electrode. By applying high voltage to the metal electrode in the capillary, a variety of spraying modes, such as dripping, burst, pulsating, cone-jet, and multi-jet, can be induced. The different spraying modes in electrospray ionization sources exhibit large variations in their ion yield and stability. Measurements of spray current is essential for both mechanism study of electrospray and its practical applications, since spray current is an intermediate variable which reflects real time status of electrospray process.
3.2 Experimental details
The apparatus is a home-built electrospray system. Acetonitrile solution was loaded into a glass capillary with a 50 μm inner diameter at the blunt tip. The upper end of the capillary was open to the atmosphere. High-voltage rectangular pulse was generated by a high voltage pulse generator (ETM3-20K01PN1, Element) and applied to the solution in the glass capillary through a copper wire. An indium tin oxide (ITO)-coated glass substrate (25 mm × 25 mm) was placed perpendicular to the axis of the glass capillary at a distance of 10 cm away from its tip for use as a counter electrode. The counter electrode was connected to ground to face the high voltage pulse. All the experiments were carried out at room temperature. The shape of the jet and the flow rate were recorded using two charge-coupled device (CCD) cameras (WAT-902B, Watec), respectively. The spray was illuminated by a laser diode with a wavelength of 635 nm (CPS196, Thorlabs). Current was measured with an oscilloscope (DS-5322, IWATSU) and a digital electrometer (8240, ADCMT).
29 3.3 Measurement of spray current
3.3.1 Measurement of spray current with an oscilloscope
I use the oscilloscope to measure the voltage on the resistor and calculate the current by ohm‘s law. As the collected current is in pico ampere scale, a resistor of large resistance, i.e. 0.5 MΩ, is necessary to produce a bias in the scale of millivolt which can be detected by the oscilloscope. However, high noise level was collected together with the current signal after using the resistor with large resistance. So I insert a low pass filter between the resistor and the oscilloscope, and the collected signals are shown in Figure 3.4.
Figure 3.3 A circuit diagram for the measurement of spray current with an oscilloscope
Channel 1 shows the wave form of the high voltage applied to the solution, which was used as the external trigger signal. Channel 2 shows the voltage signal obtained by the oscilloscope. We can see the pulse delay is very short. Although low pass filter was used to remove the noise of low frequency, the noise level is so high that there is no significant difference before and after the high voltage was applied to the solution. This means it is difficult to collect the spray current by this method.
30
3.3.2 Measurement of spray current with an electrometer
I use a digital electrometer to measure the spray current though the counter electrode. A circuit diagram for the measurement is shown in Figure 3.5. Captured data was sent to a computer through a GPIB cable and recorded by its hard disk.
Figure 3.5 A circuit diagram for the measurement of spray current with electrometer
The spray current was measured at the amplitude ranging from 4.5 to 6.0 kV, see Figure 3.6. The difference of current before and after applying high voltage is distinct, which suggests that this measurement method is effective in the measurement of spray current in electrospray process.
31 3.4 Spray current caused by high voltage pulses
3.4.1 Spray current at positive high-voltage pulse
Figure 3.7 shows a schematic diagram of the positive high voltage pulse using for the measurement of spray current. It is a rectangular wave, and both the pulse duration and the pulse interval were set as 5 s. Amplitude of the pulse varied from 4.5 to 6.0 kV to keep the spray stable during the measurement.
Figure 3.7 A schematic diagram of the positive high voltage pulse using for driving electrospray In order to eliminate the background noise and induced current from the measurement, I measured the current produced with no solution in the glass capillary at each pulse amplitude, see Figure 3.8. We can see the current obtained with no solution in the glass capillary is very small, even at 6.0 kV. I also noticed the dependence of the current on the pulse amplitude, that is, the current increase as the pulse amplitude. This implies that part of the current is induced current.
Figure 3.8 Current measured at various positive high voltage pulses from electrospray without solution As shown in Figure 3.9, the current increase after adding acetonitrile solution into the glass capillary, especially at large pulse amplitude. This means the current caused by the charged droplets was captured by the digital electrometer.
32
Figure 3.9 Current measured at various positive high voltage pulses with the electrometer from electrospray of acetonitrile solution
After deducting the background current from the measured current shown in Figure 3.9, we get true spray current, see Figure 3.10. The spray current is about 1 picoamp at 4.5 kV, which is reasonable because the spray was just form at about 4.5 kV. As the pulse amplitude was increased to 6.0 kV, the spray current increased significantly to about 16 picoamp. It is worth noting that the spray current keeps constant in the pulse duration, which indicates that the spray worked in a stable mode.
Figure 3.10 Spray current derived from the current measured at various pulse amplitudes from electrospray of acetonitrile solution
3.4.2 Spray current at negative high-voltage pulse
Figure 3.11 shows the current obtained from electrospray of no solution at various negative high voltage pulses. The current is about -180 picoamp when the pulse amplitude was changed from -4.5 to -6.0 kV,
33
which is larger than the positive case. I noticed that the duration of current at each pulse is different, which is completely different from that collected at positive high voltage pulse.
Figure 3.11 Current measured at various negative high voltage pulses by the electrometer from electrospray without solution
When comparing with the current at positive pulse, the current at negative pulse is about 100 times larger, see Figure 3.12. The dependence of the current on the pulse amplitude was also observed, which is similar to the case of positive pulse. The current increase from about -350 to about -800 picoamp with the pulse amplitude was increased from -4.5 kV to -6.0 KV. In addition, the current keeps constant after the spike in every pulse duration, which implies that the spray is in a stable mode during the measurement of current.
Figure 3.12 Current measured at various negative high voltage pulses with the electrometer from electrospray of acetonitrile solution
34
3.4.3 The spike in the spray current caused by high voltage pulse
In order to investigate the reason for the formation of the spike in the current at the beginning of each pulse, I measured the current when the electrode of the digital electrometer is disconnected with the counter electrode, see Figure 3.13.
Figure 3.13 A circuit diagram for the measurement of the spike in the current
As the current shown in Figure 3.14, spikes appear in spite of the disconnection between the electrometer and counter electrode. This suggests that the spikes are induced current coming from the high voltage pulse generator. We also noticed that the maximum value of the spikes is about 100 picoamp which is 10 times smaller than the current measured above, which indicates one part of the spike is induced current and the other part results from pulse induced inertia of the charged droplets at the beginning of pulse.
Figure 3.14 Current measured when the electrode of the digital electrometer is disconnected with the counter electrode
35
3.4.4 Corona discharge in electrospray process
When comparing the spray current at two polarities, it can be found that the spray current at negative pulse is almost 100 times larger than the one at positive pulse. I would like explain the reason for this phenomenon by corona discharge.
Figure 3.15 A schematic diagram of corona discharge
As shown in left image of Figure 3.15, a neutral atom or molecule in a region of strong electric field is ionized to create a positive ion and a free electron. The electric field accelerates these oppositely charged particles in opposite directions, separating them, preventing their recombination, and imparting kinetic energy to each of them, see the right images of Figure 3.15. The electron has a much higher charge/mass ratio and so is accelerated to a higher velocity than the positive ion. It gains enough energy from the field that when it strikes another atom it ionizes it, knocking out another electron, and creating another positive ion. These electrons are accelerated and collide with other atoms, creating further electron/positive-ion pairs, and these electrons collide with more atoms. Both positive and negative coronas rely on electron avalanches. In a positive corona all the electrons are attracted inward toward the nearby positive electrode and the ions are repelled outwards. In a negative corona the ions are attracted inward and the electrons are repelled outwards. Negative corona appears larger than the corresponding positive corona, as electrons are allowed to drift out of the ionizing region, and so the plasma continues some distance beyond it. The total number of electrons and electron density is much greater than in the corresponding positive corona. That is why the spray current at negative pulse is much larger than the one at corresponding positive pulse.
3.5 Applied voltage and its corresponding flow rate, spray current, and spray mode
For a given liquid, experiments by Delamora, J. F. and I. G. Loscertales showed that the spray current and shape depend almost exclusively on the flow rate Q, with a dependence close to I ∼Q1/2 [60]. Varying the electrical conductivity K further showed that I ∼ (KQ)1/2. This surprisingly simple result is readily rationalized.
36
This equation above was tested in an electrospray system using a syringe pump to supply solution. While in our electrospray system, I get rid of syringe pump to make the setup simpler. To further investigate the correspondence between applied voltage, flow rate, spray current, and spray mode, I monitored flow rate for various polymer solutions, which can be used for solar cell fabrication, as a function of applied voltage. As shown in Figure 3.16, flow rate increases with applied voltage across the whole variation of applied voltage. It is worth noting that the increase of flow rate is superlinear, which implies that electrospray worked in different mode at different applied voltage.
Figure 3.16 Flow rates of P3HT and P3HT:PCBM solutions as a function of applied voltage
To reveal the spray mode at different applied voltages, I measured spray current by the method mentioned in Section 3.3.2. As shown in Figure 3.17, the spray current at 4.5 kV shows oscillations, which implies that the electrospray is in pulsating mode. The spray current at 5 kV keep constant, which suggests that the electrospray works in a stable mode, con-jet mode. As applied voltage increase to 5.5 kV, small oscillation appear in the spray current, which means the electrospray begin to enter new mode. Spray current begins to fluctuate when applied voltage is larger than 5.5 kV, which suggests that electrospray is in multi-jet mode. We can see multi-jet spray in the corresponding CCD images shown in Figure 3.18. Multi-jet mode is a dynamic mode, and its variation reflected as fluctuations in the corresponding spray current. In general, there exists a distinct correspondence between spray mode and spray current.
37
Figure 3.17 Spray current of the P3HT:PCBM solution at different applied voltages
4.5 kV 5.0 kV
38
Figure 3.18 Typical images of spray at various applied voltage obtained by CCD camera
3.6 Conclusions
I found that the spray current produced in negative electrospray is about 100 times higher than its corresponding one produced in positive electrospray, which can be attributed the significant difference of mechanism between negative corona and its corresponding positive one. This founding give us a reason for choosing positive electrospray for practical application, since dust will be more easily collected together with charged droplets in negative electrospray.
I demonstrated that there are specific relations between applied voltage and flow rate, spray current, and spray mode in our electrospray system. Flow rate, spray current, and spray mode are determined by applied voltage for a given liquid under a certain experimental condition. Spray current is a good real time indication of the spray stability, which is more reliable and precise than observation through CCD camera. And the spray current was correlated with the spray mode for P3HT solution, which gives an example on how to find optimal electrospray parameters for its practical applications. Furthermore, measurements of the spray current–applied voltage curve have been useful in demonstrating why stable sprays are difficult or impossible to obtain with certain operating conditions.
39
4. Application of electrospray to the deposition of organic thin films
4.1 Poly(3,4-ethylenedioxythiophene):poly(styrenesulfonate) thin films deposited by the electrospray method
4.1.1 Introduction
Intrinsically conductive polymers like polyanilines, polypyrrols and polythiophenes become conductive by removing an electron from their conjugated π-orbitals via doping. The electrical conductivity results from the delocalization of electrons along the polymer backbone - hence the term ―synthetic metals‖. For three decades conductive polymers have been an area of intense research and in the year 2000 Alan Heeger, Alan MacDiarmid, and Hideki Shirakawa received the Nobel Prize in Chemistry ―for the discovery and development of conductive polymers." Poly(3,4-ethylenedioxythiophene):poly(styrenesulfonate) (PEDOT:PSS) is a potential substitute for metal electrode and has been wildly applied to organic devices as a hole transport layer (HTL) due to its high conductivity. The conductivity of PEDOT:PSS films increases several orders of magnitude after adding high boiling point solvents and polar compounds, such as dimethylsulfoxide (DMSO), ethylene glycol (EG), and sorbitol [61-63]. However, the underlying mechanism is still controversial. Kim et al. reported that the conductivity can be enhanced by the screening effects of polar solvents with a high dielectric constants [61]. Ouyang et al. suggested conformational changes increase both intra- and inter-chain charge carrier mobility after adding compounds with two or more polar groups [64]. Jönsson et al. reported that the excess PSS is removed from the surface of the PEDOT:PSS grains by adding sorbitol, N-methylpyrrolidone (NMP) and isopropylalcohol (IPA), to the film [62]. They argued that a better connection between the conducting PEDOTs is established through the grains of the PEDOT:PSS complex. Recently, Nardes et al. asserted that the high boiling point solvent (sorbitol)-induced enhancement of the conductivity was due to a decrease in the thickness of the insulating PSS barrier that separates the conducting PEDOT-rich grains [63].
Spin-coating is a widely used coating method due to its simplicity and reproducibility. However, the spin-coating process cannot be applied to large-area devices, flexible substrates, especially to high throughput roll-to-roll (R2R) process. Among the alternatives to spin-coating, such as screen printing [65], doctor blading [66], and inkjet printing [67], spray method is attractive because it is easy to operate and compatible with the R2R process. Spray methods also use much more dilute solutions than spin-coating, resulting in less materials discarded and circumventing the solubility problem for conjugated polymers [68-70]. Furthermore, spray techniques enable the fabrication of multilayered and patterned devices [70-72]. Although spray is recognized as a promising coating method, conventional spraying methods such as handheld spray and ultrasonic spray require a carrier gas to atomize the liquid or to direct the mist to the substrate [69]. The carrier gas inevitably accelerates the droplets. Consequently, it makes high kinetic-energy droplets to rebound from the substrate, resulting in low coating yield [72]. Elevating a substrate temperature was attempted to enhance the droplet collection efficiency and uniform coated surface [73]. However, rapid
40
drying of the solvent could not enhance the collection efficiency [74], but only formed interfacial boundaries between the deposited droplets in a pancake-like morphology [61]. On the contrary, delaying the drying time by adding high boiling point solvents reduced the pancake boundaries of PEDOT:PSS layer coated by handheld spray [73].
More recently, electro-spray (e-spray) has been introduced. This technique has been shown to be compatible with organic electronic device fabrication [75]. During e-spray deposition, atomization is induced by an electric field between the solution and the deposition substrate. The high-pressure atomizing gas that is used in handheld spray can be eliminated. Moreover, the e-spray technique does not require directing carrier gas used in ultrasonic spray, because the charged mists fly about searching for a potential surface to land on that is opposite in charge to their own, which enables high deposition efficiency without a heated substrate. Because e-spray can totally eliminate any type of gas-induced evaporation, the drying time of the deposited film can be controlled by independently adjusting the substrate temperature and the amount of high boiling-point additives.
I studied electrospray deposition of PEDOT:PSS (CLEVIOS P VP AI 4083) films by independently varying the process parameters, including applied voltage, amount of additive, and relative humidity. The resultant PEDOT:PSS thin films were characterized by atomic force microscope (AFM), scanning electron microscope, and spectrophotometer.
4.1.2 Experimental details
The chemical and physical characteristics of Clevios P VP AI 4083 are listed in Table 4.1. As an aqueous dispersion, the property of PEDOT:PSS is similar to water. It is difficult to be applied to electrospray deposition directly. So, proper additive is indispensible for its application to electrospray deposition.
41
I survey several common additives, and list their dielectric constant, boiling point, and stream pressure in Table 4.2. According to our previous results, additive of high boiling point and large dielectric constant facilitate the formation of stable spray and uniform thin film. Dimethyl sulfoxide (DMSO) is chose on this principle. A series of precursor solutions with the ration of PEDOT:PSS to DMSO varying from 5:5 to 1:9 were prepared for electrospray deposition. And the applied voltage of electrospray deposition was also adjusted separately for each solution to obtain optimized parameters.
Table 4.2 chemical and physical characteristics of several common additives
A glass capillary was fabricated using a puller (PC-10, Narishige) and a microforge (MF-900, Narishige). The inner diameter of the glass capillary was approximately 50 µm. A positive high voltage was applied to a copper wire in the PCBM solution using a high voltage source (HJPQ-30P1, Matsusada Precision). The earthed line was connected to a patterned ITO layer. The distance from the glass capillary to the substrate was 6 cm. The top graphic images of sample were obtained using AFM (Seiko, SPA300HV) and SEM (HITACHI, S-4100). Absorption spectra were acquired using a high resolution ultraviolet-visible (UV–Vis) spectrophotometer (V-650, JASCO Corporation).
4.1.3 The effect of the applied voltage on the properties of resultant PEDOT:PSS thin films
As shown in Table 4.3, the starting point of spray move forward when the concentration of DMSO was increased from 50% to 90%, which indicates that DMSO is an effective additive for PEDOT:PSS in electrospray deposition. I also noticed that the spray diameter increase with the concentration of DMSO during electrospray deposition. It is because the dielectric constant of DMSO is rather large, and the charged droplets repel each other strongly.
42
Table 4.3 The status of spray for the electrospray deposition of PEDOT:PSS solution under different applied voltage. The ratio of PEDOT:PSS to DMSO varies from 5:5 to 1:9.
The root mean square (RMS) roughness of the resultant PEDOT:PSS thin films was measured by AFM, see Figure 1. We can see that the applied voltage affects the RMS roughness of PEDOT:PSS thin films considerably at the volume fractions of 60% and 70%. Interestingly, the fluctuation in RMS becomes very small when the volume fraction of DMSO increases to 80%. At 90%, finally, applied voltage plays almost no role in the surface roughness. There is a tendency that the surface of resultant PEDOT:PSS thin films become smooth as the volume fraction of DMSO is increased from 60% to 90%. It can be concluded that the effect of applied voltage on surface roughness is weakened when the PEDOT:PSS solution is diluted with DMSO. Another conclusion from these observations is that additives (i.e. DMSO), which enlarge the diameter of spray may facilitate the formation of uniform thin films in electrospray deposition.
Figure 4.1 Surface roughness of PEDOT:PSS thin film as a function of applied voltage in electrospray deposition. The concentration of DMSO was adjusted from 60% to 90%.
To further study the effect of applied voltage on the characteristics of PEDOT:PSS thin films deposited the electrospray method, I fabricated 3 samples, named A, B, and C, by keeping the concentration of DMSO as 80% and varying the applied voltage from 9 to 11 kV. The topographies of these samples are shown in