1.は じ め に
本稿では,筆者がこれまで行ってきた,「窒素安定 同位体比」と「物質循環モデル」を研究アプローチと した海洋窒素循環の研究を紹介する。海洋において窒 素は植物プランクトンの成長に不可欠な栄養塩であ り,海洋生物生産の規制因子であることが多い。その ため,窒素循環の解明は生物生産メカニズムを明らか にする上で極めて重要であると考えられている。また 同様の理由で,地球温暖化予測にも用いられている昨 今の海洋生態系モデルは,窒素循環をベースとして構 築されているものがほとんどである(Yamanaka et al., 2004など)。このようなモデルの精度向上のため にも海洋窒素循環の解明は極めて重要であると考え, これまで研究を行ってきた。窒素同位体比は,Miyake and Wada(1967)から 始まり,海洋窒素循環のトレーサーとしてこれまで広 く用いられてきた。表層海水中の硝酸の窒素同位体比 は表層の栄養塩環境に規定されて変化することが知ら
2011年度日本地球化学会奨励賞受賞記念論文
窒素同位体比および物質循環モデルを用いた
海洋窒素循環に関する研究
吉
川
知
里
* (2012年4月2日受付,2012年7月13日受理)Marine nitrogen cycle studies by using nitrogen isotopes and
material cycle simulation model
Chisato Y
OSHIKAWA**Interdisciplinary Graduate School of Science and Engineering,
Tokyo Institute of Technology
Nagatsuta-cho 4259, Midori-ku, Yokohama, Kanagawa 226-8503, Japan
The marine nitrogen cycle is known to often control biological activity in the ocean, because nitrogen is an indispensable nutrient for phytoplankton. Understanding the marine nitrogen cy-cleis very important with respect to marine biological activity. In this study, nitrogen isotopic ratios (δ15
N) and marine material cycle models are used to understand the marine nitrogen cy-cle. Here, our previous studies of nitrogen cycle in the western and central equatorial Pacific and in the Sea of Okhotsk are introduced. In the equatorial Pacific, the distributions ofδ15
N val-ues of nitraterevealed that surface nutrient sources are atmospheric and/or terrestrial nitrogen in the western and marine nitrogen in the central. Moreover, the time variations ofδ15
N values in sinking particles reconstructedthe transition of surface nutrient sources with transport of the fresh pool. In the Sea of Okhotsk, a marine nitrogen cycle model including nitrogen isotopes wasnewly developed in order to quantitatively understand the observed feature of winter high δ15
N values of sinking particles relative to the spring values. The model suggested that the ni-trification with large isotopic effects causes the winter highδ15
N values of sinking particles. Fi-nally, my future prospects of the nitrogen isotopic modeling are discussed.
Key words: Marine nitrogen cycle, Nitrogen isotope ratios, Material cycle model, Equatorial
Pacific, Sea of Okhotsk
*東京工業大学大学院総合理工学研究科
〒226―8503 神奈川県横浜市緑区長津田町4259
G1―17
れている。一般的な外洋では,植物プランクトンの硝 酸利用効率に規定されて変化するのに対し(Altabet and Francois, 1994など),脱窒や窒素固定,陸起源 窒素の供給などがおこる海域では,硝酸の起源の違い によって変化する(Voss et al., 2001など)。また,沈 降 粒 子 や 堆 積 物 の 窒 素 同 位 体 比 は,表 層 水 中 の 硝 酸の窒素同位体比に規定されて変化するため,その 変動から過去の栄養塩環境を復元することもできる (Nakatsuka et al., 1995など)。 一方,海洋物質循環モデルは,人為 CO2の海洋へ の吸収に対する海洋生態系の寄与が注目され始めた 1990年 頃 か ら 開 発 が 始 め ら れ た。Bacastow and Maier-Reimer(1990)は,海洋大循環モデルに簡単 な生物化学過程を組み込んだモデルを構築して全球規 模の物質循環の研究を行った。このモデルでは,生物 過程としてリン酸塩の取り込みと無機化が組み込まれ たもので,観測されたリン酸塩分布はおおむね再現し ていたものの,生物生産量の深度分布や季節変動は現 実的ではなかった。その後,コンピューターの発展と 観測技術の向上とともに海洋物質循環モデリングも急 速に発展し,近年では窒素循環をベースとして生態系 を陽に扱った海洋生態系モデルが開発され,生物生産 量についてもおおむね現実を再現できるようになって きた(Yamanaka et al., 2004など)。 筆者らは,これまでに蓄積されてきた窒素同位体比 に関する知見を海洋環境の全く異なる西部・中央部赤 道太平洋とオホーツク海の窒素循環に適用して同海域 の窒素循環像を考察するとともに,より詳細かつ定量 的な解析を目的として,海洋窒素循環モデルと窒素同 位体比を融合させた窒素同位体モデリングを行ってき た。2章と3章では,筆者らのこれまでの研究成果を 交えながらそれぞれの海域についての窒素循環像につ いて紹介し,4章で窒素同位体モデリングの今後の展 望について述べる。
2.西部・中央部赤道太平洋
2.1 背景 筆者らが研究を行う何年も前から,太平洋赤道域で は懸濁粒子や沈降粒子,堆積物試料の窒素同位体比の 測定結果を用いた窒素循環メカニズムに関する研究は 多数報告されていた。東部赤道太平洋では,Altabet and Francois(1994)が懸濁粒子や沈降粒子,表層 堆積物の窒素同位体比を報告している。彼らは,表層 水中の硝酸濃度の南北分布と懸濁粒子や沈降粒子,表 層堆積物の窒素同位体比の分布が逆相関関係を示すこ とを発見している。またこれらの結果から,この海域 の堆積物の窒素同位体比から赤道湧昇の強弱に伴う表 層栄養塩環境の変遷が復元可能であることを示唆して いる。西部赤道太平洋では,Nakatsuka et al.(1995) によって堆積物の窒素同位体比が測定されている。彼 らは,氷期―間氷期サイクルに伴う南北で異なった窒 素同位体比の周期変動を発見している。これらの結果 から,氷期―間氷期サイクルと同期した湧昇域の南北 振動にともない,この海域の表層栄養塩環境は南北で 異なる周期変化を示すことを示唆している。これらの 研究はいずれも,「それぞれの海域において,植物プ ランクトンはある共通の起源をもつ硝酸(これらの場 合では表層に湧昇してくる亜表層の硝酸)をある一定 の分別係数で同位体分別しながら取り込む」という仮 定のもとに,硝酸濃度と懸濁粒子や沈降粒子,堆積物 の窒素同位体比から導き出された論議である。 しかし実際の海洋では,硝酸の窒素同位体比はその 起源によってさまざまである。このため,本来は,硝 酸の窒素同位体比も同時に測定してそれぞれの海域に おける表層の硝酸の起源について検証する必要があ る。 筆者らが太平洋赤道域における研究を始めた2000 年以前,硝酸などの溶存態窒素の窒素同位体比は, Miyake and Wada(1967)の水蒸気蒸留法を行った後,真空ラインで N2ガスを精製し,質量分析計で測 定されていた。当初,筆者らもこの方法を試したが, この分析方法は非常に複雑で時間がかかり,硝酸の窒 素同位体比に関する報告が非常に少なかった事実にす ぐに納得がいった。しかし,2000年頃から新たな分析 方法として Sigman et al.(1997)の拡散法,Sigman et al.(2001)のバクテリア法,Yoshikawa et al. (2005a)の EA-IRMS を用いた水蒸気蒸留法が提案 され,硝酸の窒素同位体比も比較的簡単に測定できる ようになった。これらにより,表層水中の硝酸の起源 を特定した後,沈降粒子の窒素同位体比から過去の栄 養塩環境の復元が行えるようになった。その一例とし て,筆者らの研究成果を紹介したい(Yoshikawa et
al., 2005a; Yoshikawa et al., 2006a)。
2.2 硝酸と沈降粒子の窒素同位体比測定
筆者らは,海洋研究開発機構の海洋地球研究船「み らい」の西部・中央部赤道平洋の航海(MR 99-07) において1999年1月に採水された海水中の硝酸と1999 年に採集された約一年分の沈降粒子の窒素同位体比を
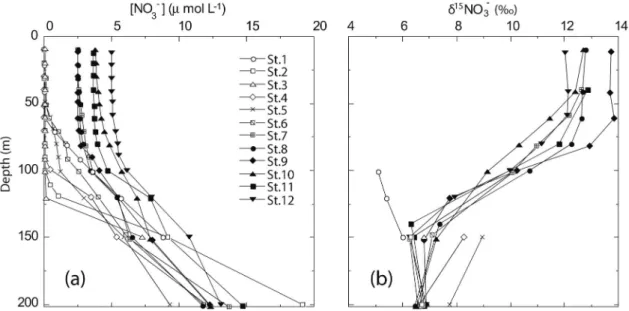
測定した(Fig. 1)。海水中の硝酸については,水蒸 気蒸留を行った後 EA-IRMS を用いて,沈降粒子につ いては,EA-IRMS を用いて,それぞれの窒素同位体 比を測定した。 Fig. 2に海水中の硝酸濃度と窒素同位体比の測定結 果を示した。中央部赤道太平洋(St. 8∼12)におい て硝酸の窒素同位体比は,硝酸が枯渇している表層で 約13‰と高く,硝酸濃度の高い亜表層では約7‰だっ た。これは,植物プランクトンが同位体分別を起こし ながら14 N からなる軽い硝酸を取り込むためであり, どこの海域でも見られる一般的な硝酸の窒素同位体比 分布である。一方,西部赤道太平洋の fresh pool と呼 ばれる塩分の低 い 水 塊 中(SSS<35)(St. 1∼2)で は,表層にもかかわらず約5‰の低い窒素同位体比を 示した。我々は,この結果とこの海域の表層循環か ら,fresh pool の硝酸の起源は,窒素固定や陸起源を 由来とした窒素が起源であると考えた。 Fig. 3に約一年分の沈降粒子の粒子束と窒素同位体 比の測定結果を示した。西部赤道太平洋の fresh pool が表層を覆っている海域では,沈降粒子の窒素同位体 比は年間を通して約4‰と低い値を示した(Fig. 3a,b) のに対し,中央部赤道太平洋では,年間を通して約8
Fig. 1 Map of the western and central equatorial Pacific and locations of hydro cast and mooring stations (St. 1, 2, 3, and 9) during the cruise MR99-K07 in Decem-ber 1999. (from Yoshikawa et al. (2006a))
Fig. 2 Vertical profiles of nitrate concentrations and those ofδ15
N values.δ15
N shows values greater than 2.5μmolL−1due to the analytical limit. (from Yoshikawa et al. (2006a))
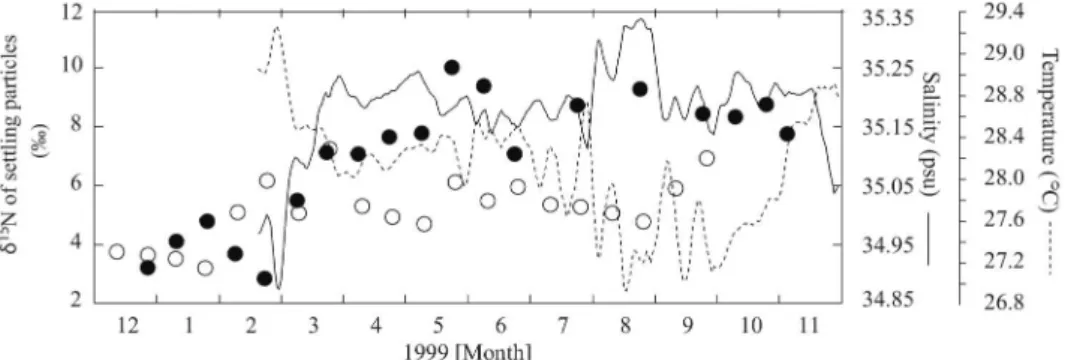
‰と高い値を示した(Fig. 3d)。沈降粒子の窒素同位 体比に見られたこのような東西勾配は,先に述べた硝 酸の窒素同位体比の分布とぴったりと一致していた。 ここで注目して頂きたいのは,fresh pool の東の境界 付近にあたる St. 3の変動である。St. 3では,1999年 3月に沈降粒子の窒素岡位体比が約4‰も上昇してい る(Fig. 3c)。 Fig. 4に St. 3の沈降粒子の窒素同位体比と同海域で TRITON ブイによって観測された水温と塩分の変動 を示した。St. 3の沈降粒子にみられた1999年3月の急 激な窒素同位体比の上昇は,塩分の急激な上昇の時期 と非常によく一致している。このことから,西部赤道 太平洋の沈降粒子の窒素同位体比は,fresh pool と呼 ばれる塩分の低い水塊の移動に伴う硝酸の起源の変遷 をトレースしていたと結論づけた。
Fig. 3 Seasonal changes in the δ15
N values of settling particles (a: St. 1, b: St. 2, c: St. 3, d: St. 9) and nitrogen fluxes (e: St. 1, f: 2, g: St. 3, h: St. 9) from January to November 1999. Closed and open circles indicate the values at the upper and lower traps, respectively. (from Yoshikawa et al. (2005a))
Fig. 4 Seasonal changes in the δ15
N values of settling particles at the upper (closed circle) and lower (open circle) traps at St. 3 from December 1998 to November 1999 together with the salinity (solid line) and temperature (dotted line) vari-ations at 100 m for 0°N, 147°E. Data for salinity and temperature are derived from the TRITON project. Data before February 1999 were not available. We adjusted the delay on the δ15
N data for settling particles in the upper and lower trapsby half a month and one and half month, respectively. (from Yoshikawa et al. (2005a))
2.3 まとめと今後の課題 本研究では,従来よりも短時間で比較的簡単に測定 できる EA-IRMS を用いた水蒸気蒸留法を開発し,赤 道太平洋の硝酸の窒素同位体比を測定した。そしてそ の分布から,西部赤道太平洋の硝酸は窒素固定や陸起 源を由来とした窒素が起源であり,中央部は海洋を由 来とした窒素が起源であることを明らかにした。ま た,この表層水中の硝酸の窒素同位体比の情報は沈降 粒子中の窒素同位体比に記録されていることを確認 し,その同位体比変動から fresh pool の移動に伴う硝 酸の起源の変遷を復元することができた。本研究の結 果をうけて,Nakatsuka et al.(1995)に示された西 部赤道太平洋の堆積物の窒素同位体比の周期変動は, 氷期―間氷期サイクルに同期した淡水流入経路の変動 に伴う硝酸の起源の変遷をトレースしていた可能性が 示唆された。この仮説をより強固なものにするために も,硝酸や沈降粒子の窒素同位体比にみられた東西勾 配が堆積物の窒素同位体比にも記録されているのかの 確認を行う必要があり,同海域周辺の表層堆積物の窒 素同位体比の分布を明らかにすることが今後の課題で あると考えている。
3.オホーツク海
3.1 背景 筆者は大学院生の時に,Fig. 5に示したオホーツク 海東岸沖の2か所の約二年分の沈降粒子の窒素同位体 比を測定する機会を得た。オホーツク海の沈降粒子の 窒素同位体比は,春から夏にかけて6‰付近の値を示 すのに対し,秋から冬にかけて急激に上昇し12‰を 超える高い値を示した。この要因としてまず考えられFig. 5 Map of the Sea of Okhotsk and locations of the sediment trap mooring M4 and M6. Arrows show a pattern of the surface current. The square off the east coast of Sakhalin shows the region where our model is applied. (from Yoshikawa et al. (2005b))
るのは,植物プランクトンよりも約3‰高い窒素同位 体比を示す動物プランクトンが沈降粒子中に占める割 合が増加することである。しかし,春と冬の窒素同位 体比の差が非常に大きいことと,秋から冬にかけての 上昇が高緯度の研究でのみ報告されていたことから他 にも要因があるのではないかと考えた。同海域では北 西部大陸棚の海底付近に脱窒を示す N*のとても低い (リンに対して窒素が過小な)水塊が存在し,その水 塊がサハリン東岸沖の中層水まで広がっていたことか ら,当初,秋から冬にかけて沈降粒子の窒素同位体比 が上昇する要因は,オホーツク海北西部大陸棚の脱窒 の影響を受けて高い窒素同位体比を示すと考えられる 硝酸が冬季混合によって表層に供給されることが原因 ではないかと考えていた。しかし,実際に硝酸の窒素 同位体比を測定した結果,堆積物直上では有意に高い 値を示したものの,サハリン東岸沖の中層水の硝酸の 窒素同位体比は5∼6‰と表層水よりも有意に低い値 を示した(Yoshikawa et al., 2006b)。そこで筆者ら はこの謎を解明するため,沈降粒子の窒素同位体比を 予報できるモデルを構築することにした。本章では筆 者らのこの研究を紹介したい(Yoshikawa et al., 2005b)。 3.2 窒素同位体比と海洋窒素循環のモデリング 筆者らは,植物プランクトン,動物プランクトン, 硝酸,アンモニア,溶存有機物,粒子状有機物など6 コンパートメントからなる窒素循環モデルに15 N の循 環を組み込み,表層水を上層(0∼20 m)と下層(20 ∼120 m)の2層 に 分 け た ボ ッ ク ス モ デ ル を 構 築 し (Fig. 6),セ ジ メ ン ト ト ラ ッ プ 実 験 が 行 わ れ た オ ホーツク海サハリン東岸沖に適応した。モデルの物理
Fig. 6 Schematic view of interactions among the six model compartments in the upper (0-20 m deep) and lower (20-120 m deep) layers. The symbol NO3
indicates nitrate concentration, NH4 ammonium, PHY phytoplankton,
ZOO zooplankton, PON particulate organic nitrogen, and DON dissolved organic nitrogen. Dashed and solid arrows indicate nitrogen flows with and without isotope fractionation, respectively. (from Yoshikawa et al. (2005b))
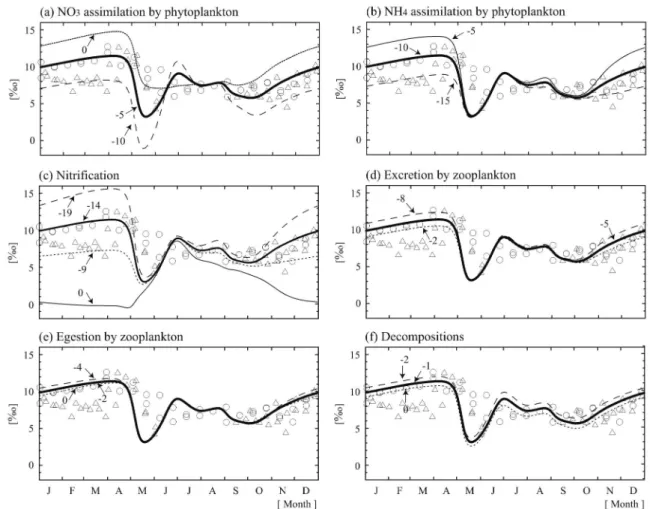
条件は外力として与え,水温は WOA 94,日射量は NCEP,上層と下層,下層と亜表層の水の交換係数は 水温・塩分の鉛直分布を参照して設定した。生物化学 過程の式とパラメータは,亜寒帯海域における観測と 良い一致を示す Kawamiya et al.(1997)と同じもの を使用した。モデルの検証に用いた海洋観測データ は,1998年7から8月,1999年9月,2000年6月に行わ れたロシア極東水文気象研究所のクロモフ号の航海で 得られたものを用いた。約二年分の沈降粒子試料は, 1998年8月から2000年6月まで行われたセジメントト ラップを含む係留観測から得られたものを用いた。 まず,各生物過程における同位体分別係数を決定す るために,各分別係数をそれぞれ過去に報告された観 測の範囲内で変化させて,沈降粒子の窒素同位体比に 対する感度実験を行った(Fig. 7)。その結果,春の ブルーム時には植物プランクトンの硝酸取り込み時の 分別係数を変化させたもののみが大きく変化し,夏か ら冬にかけては,植物プランクトンの硝酸・アンモニ ア取り込み時と硝化時の分別係数を変化させたものが 大きく変化した。このことから,硝酸取り込み時の分 別係数は春の観測値と一致するように決定し,アンモ ニア取り込み時と硝化時の分別係数は冬の観測値と一
Fig. 7 Comparison ofδ15
N of sinking particles among experiments changing the isotopic fraction-ation effects within the range measured in previous studies: (a) nitrate assimilfraction-ation by phytoplankton of the small case of 0‰, the control case of −5‰ and the large case of −10 ‰, (b) ammonium assimilation by phytoplankton of −5‰, −10‰ and −15‰, (c) nitrifica-tion of −9‰, −4‰, −19‰ and the non-fracnitrifica-tionanitrifica-tion case (thin line), (d) excrenitrifica-tion by zooplankton of −2‰, −5‰ and −8‰, (e) egestion by zooplankton of 0‰, −2‰ and −4‰ and (f) decompositions of 0‰, −1‰ and −2‰. Dashed, thick and dotted lines and open circles are small, control and large cases and observed values, respectively. Open circles and triangles indicate observed vales of sinking particles from August 1998 to August 1999 and from September 1999 to June 2000, respectively. (from Yoshikawa et al. (2005b))
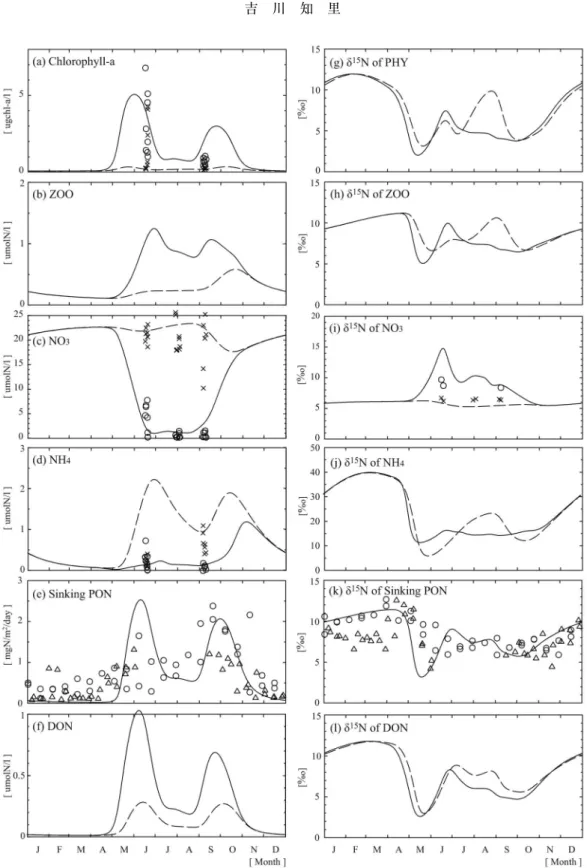
Fig. 8 Seasonal variations: (a) Chlorophyll-a concentrations, (b) ZOO concentrations, (c) NO3
concentra-tions, (d) NH4concentrations, (e) Sinking PON fluxes, (f)δ15N values of DON, (g)δ15N values of PHY,
(h),δ15
N values of ZOO, (i)δ15
N values of NO3, (j)δ 15
N values of NH4, (k)δ 15
N values of sinking PON and (l)δ15
N values of DON. Solid and dashed lines and symbols are the simulated upper and lower values and observed values, respectively. The bottled data are collected by three cruises, which were conducted in June 2000, from July to August 1998 and in September 1999, in the region where our model is applied. The moored data are collected from August 1998 to August 1999 (open circle) and from September 1999 to June 2000 (open triangle). (Modified from Yoshikawa et al. (2005b))
致するような組み合わせに決定した。この感度実験の 結果から,沈降粒子の窒素同位体比は,春のブルーム 時には従来から言われていたように植物プランクトン の硝酸取り込み時の同位体分別効果によって規定さ れ,夏から冬にはこの分別効果とともに植物プランク トンのアンモニア取り込み時と硝化時の同位体分別効 果によっても規定されていることが明らかになった。 Fig. 8にモデルで計算された各コンパートメントの 濃度と窒素同位体比,対応する観測値を示した。モデ ルは,観測で得られたクロロフィル―a,硝酸,アン モニア濃度を再現することができ,春から秋にかけて の硝酸濃度の枯渇とそれに伴う硝酸の窒素同位体比の 上昇を再現することができた。また,沈降粒子のフ ラックスの春と秋の年2回のピークとその窒素同位体 比の季節変化も再現することができた。Fig. 8に示し た様にオホーツク海で観測された沈降粒子の窒素同位 体比は秋から冬にかけて上昇する。この様な沈降粒子 の窒素同位体比の上昇は,高緯度海域で一般的に見ら れる現象であるが,その要因はまだ明らかにされてい なかった。 Fig. 9にモデルで計算された沈降粒子中の植物プラ ンクトンの死骸,動物プランクトンの死骸,フィーカ ルペレットの存在比とそれらの各窒素同位体比を示し た。冬季は,モデルの沈降粒子中のフィーカルペレッ トの存在比が9割を超えるとともに,全ての構成要素 の窒素同位体比が上昇した。アンモニアの窒素同位体 比の規定要因の解析から,この冬季の窒素同位体比の 上昇は硝化の進行によることが明らかになった。この モデルを用いた解析から,冬季の沈降粒子の窒素同位 体比の上昇の要因として,動物プランクトンが沈降粒 子中に占める割合が増加することによる寄与が約40 %,硝化に伴うアンモニアの窒素同位体比の上昇によ る寄与が約60%と見積もられた。つまり,冬季の沈 降粒子の窒素同位体比を規定する要因として,従来か ら言われていた「動物プランクトンが沈降粒子中に占 める割合が増加することによる寄与」と共に,「冬季 の硝化に伴ってアンモニアの窒素同位体比が上昇する ことによる寄与」も重要である可能性が示唆された。 3.3 まとめと今後の課題 本研究では,オホーツク海の約二年分の沈降粒子の 窒素同位体比の変動要因を定量的に理解することを目 的に,窒素同位体比を導入した海洋窒素循環モデルを 構築した。同モデルを用いた感度実験の結果から,春 のブルーム時には植物プランクトンの硝酸取り込み時 の同位体分別効果が沈降粒子の窒素同位体比を規定 し,夏から冬にかけては硝酸取り込みとともにアンモ ニア取り込み時と硝化時の同位体分別効果が沈降粒子 の窒素同位体比を規定していることが示唆された。さ らにモデルを用いた解析から,冬季の沈降粒子の窒素 同位体比の上昇の要因として,硝化に伴うアンモニア の窒素同位体比の上昇が重要であることが示唆され た。この仮説を証明するためにも,冬季のアンモニア の窒素同位体比など,ナノオーダーの低濃度な溶存態 窒素の窒素同位体比を測定することが今後の課題であ ると考えている。
4.お わ り に
近年,観測技術の向上とともに,全球を網羅したプ ロジェクト観測や衛星を用いた観測などが行われるよ うになり,海洋生態系モデルの検証材料となる観測 Fig. 9 (a) simulated ratio among components of sinking particles which originated from dead bodies of phytoplankton (short-dashed line), dead bodies of zooplankton (solid line) and fecal pellet (long-dashed line), and (d) simulatedδ15N values of dead bodies of phy-toplankton (short-dashed line), dead bodies of zooplankton (solid line), fecal pellet (long-dashed line), and sinking particles (thick line). (Modified from Yoshikawa et al. (2005 b))
データは急速に増えつつある。しかし一方で,モデル 自身も複雑化しているため,検証案件が増え,結局の ところ検証材料が十分とは言い難いのが現状である。 そこで筆者らは,新たな検証材料として窒素同位体比 を用いた研究を行っている。本稿でもすでに述べた が,硝酸の窒素同位体比は栄養塩環境のトレーサーで あり,特に窒素固定や脱窒に高い感度を示す。これら の過程は,その不均一性ゆえに観測データが不足して いるため,モデルに導入する際の検証材料として窒素 同位体比はとても有用である。また,海洋生物の窒素 同位体比は,栄養段階が上がるにつれて重くなること
から(Minagawa and Wada, 1984など),モデルの食
物網の検証にも用いることができる。Miyake and Wada(1967)か ら45年 に な る2012年 現 在,海 洋 に おける窒素同位体比データベースはかなり充実しつつ ある。2010年に は Isoscapes が 出 版 さ れ,窒 素 同 位 体比についても大西洋の動物プランクトンのマップが 公開された(Graham et al., 2010)。筆者らが構築中 の窒素同位体モデルも全球に適用できる日は近いのか もしれない。 謝 辞 このたび日本地球化学会奨励賞を頂くにあたりまし て,本賞に推薦してくださった東京工業大学の吉田尚 弘教授,選考に当たられた先生方,そして会員の皆様 に心よりお礼申し上げます。北海道大学低温科学研究 所の中塚武元助教授(現:名古屋大学教授)には,研 究の進め方に始まり,生物地球化学研究の楽しさや窒 素同位体比のすばらしさまで,辛抱強く丁寧に指導し て頂き心から感謝申し上げます。また,北海道大学大 学院地球環境科学研究科の山中康裕元助教授(現:教 授)には,物質循環モデルの構築法から,研究者とし て生き残るすべまで,親身になって指導して頂き心か ら感謝申し上げます。北海道大学低温科学研究所の河 村広隆教授をはじめとする海洋環境研究室の皆様,海 洋研究開発機構の和田英太郎先生と河宮未知生先生を はじめとする元地球環境フロンティア研究センターの 皆様,メリーランド大学の Raleigh Hood 教授と
Vic-toria Coles 准教授,東京工業大学の吉田尚弘研究室 の皆様にも,様々な形でご助言,ご指導頂きました。 そして,本研究で用いた試料は,クロモフ号とみらい の航海において,研究者や乗組員の皆様に多大なるご 協力を頂き採取させて頂きました。本研究は,戦略的 基礎研究「オホーツク海氷の実態と気候システムにお ける役割の解明(研究代表者:若土正曉先生)」,文科 省科学技術振興調整費プログラム「炭素循環に関する グローバルマッピングとその高度化に関する国際共同 研究(研究代表者:川幡穂高先生)」,日本学術振興会 特別研究員奨励費「窒素循環に注目した地球温暖化に 対する海洋生態系の応答メカニズムの解明」,環境省 地球環境研究総合推進費「温暖化関連ガス循環解析の アイソトポマーによる高精度化の研究(研究代表者: 吉田尚弘先生)」,グローバル COE「地球から地球た ちへ(研究代表者:井田茂先生)」の一環として行わ せて頂きました。最後に,研究を始めるきっかけを与 えてくれた父と心の支えになってくれた母と夫と娘に 感謝します。 引 用 文 献
Altabet, M. A. and Francois, R. (1994) Sedimentary nitrogen isotopic ratio as a recorder for surface ocean nitrate utili-zation. Global Biogeochemical Cycle, 8, 103―116. Bacastow, R. and Maier-Reimer, E. (1990) Ocean-circulation
model of the carbon cycle. Climate Dynamics, 4, 95―125. Graham, B. S., Koch, P. L., Newsome, S. D., McMahon, K. W.
and Aurioles, D. (2010) Using Isoscapes to Trace the Movements and Foraging Behavior of Top Predators in Oceanic Ecosystems. In: Isoscapes: Understanding
Move-ment, Pattern, and Process on Earth Through Isotope Mapping (eds. J. B. West, G. J. Bowen, T. E. Dawson and
K. P. Tu), Springer Science+Business Media B. V., pp. 299―318, doi 10.1007/978-90-481-3354-3_14.
Kawamiya, M., Kishi, M. J., Yamanaka, Y. and Suginohara, N. (1997) Obtaining reasonable results in different oce-anic regimes with the same ecological-physical coupled model. Journal of Oceanography, 53, 397―402.
Minagawa, M. and Wada, E. (1984) Stepwise enrichment of 15N along food chains: Further evidence and the relation betweenδ15N and animal age. Geochimica et
Cosmo-chimica Acta, 48, 1135―1140.
Miyake, Y. and Wada, E. (1967) The abundance ratio of15N/ 14N in marine environments. Records of Oceanographic
Works in Japan, 9, 37―53.
Nakatsuka, T., Harada, N., Matsumoto, E., Handa, N., Oba, T., Ikehara, M., Matsuoka, H. and Kimoto, K. (1995) Glacial-interglacial migration of an upwelling field in the western equatorial Pacific recorded by sediment15N/14N.
Geophysical Research Letters, 22, 2525―2528.
Sigman, D. M., Altabet, M. A., Michener, R., McCorkle, D. C., Fry, B. and Holmes, R. M. (1997) Natural abundance-level measurement of the nitrogen isotopic composition of oceanic nitrate: an adaptation of the ammonia diffusion method. Marine Chemistry, 57, 227―242.
Sigman, D. M., Casciotti, K. L., Andreani, M., Barford, C., Galanter, M. and Böhlke, J. K. (2001) A bacterial method
for the nitrogen isotopic analysis of nitrate in seawater and freshwater. Analytical Chemistry, 73, 4145―4153. Voss, M., Joachim, W. D. and Joseph, P. M. (2001) Nitrogen
isotope patterns in the oxygen-deficient waters of the Eastern Tropical North Pacific Ocean. Deep-Sea Research
I , 48, 1905―1921.
Yamanaka, Y., Yoshie, N., Fujii, M., Aita, M. N. and Kishi, M. J. (2004) An ecosystem model coupled with nitrogen-silicon-carbon cycles applied to Station A7 in the North-western Pacific. Journal of Oceanography, 60, 227―241. Yoshikawa, C., Nakatsuka, T. and Kawahata, H. (2005a)
Transition of low-salinity water in the Western Pacific Warm Pool recorded in the nitrogen isotopic ratios of set-tling particles. Geophysical Research Letters, 32, doi:
10.1029/2005 GL023103.
Yoshikawa, C., Yamanaka, Y. and Nakatsuka, T. (2005b) An ecosystem model including nitrogen isotopes: perspec-tives on a study of the marine nitrogen cycle. Journal of
Oceanography, 61(5), 921―942.
Yoshikawa, C., Yamanaka, Y. and Nakatsuka, T. (2006a) Ni-trogen isotopic patterns of nitrate in surface waters of the western and central equatorial Pacific. Journal of
Ocean-ography, 62, 511―525.
Yoshikawa, C., Nakatsuka, T. and Wakatsuchi, M. (2006b) Distribution of N*in the Sea of Okhotsk and its use as a biogeochemical tracer of the Okhotsk Sea Intermediate Water formation process. Journal of Marine Systems, 63, 49―62.