JAIST Repository: Information effect on customer preference for recycled-plastic packaging: A case of a recycled-plastic water bottle in Mongolia [課題研究報告書]
74
0
0
全文
(2) Master’s Research Project Report. Information effect on customer preference for recycled-plastic packaging: A case of a recycled-plastic water bottle in Mongolia. Batgerel Khartsaga. Supervisor NAOSHI UCHIHIRA. Graduate School of Advanced Science and Technology Japan Advanced Institute of Science and Technology (Knowledge Science). September2020.
(3) Abstract 50 years ago, plastic was very useful and advanced material in the world. Unfortunately, it is now one of the biggest polluters of the environment. Wild animals are entangled in plastic and thus feel extreme pain. The animals even eat it and die due to digestion. Furthermore, micro and nano plastics are found in our food and drinking water. It even emits carbon dioxide (CO2). Every nation is attempting to solve problems with plastic. Particularly, for developing countries, it is a serious issue. Mongolia is developing country. Only 8.3% of plastic waste is recycled in there. Most of recycled plastics in Mongolia were exported to China. Since 2017, the country banned importation of nearly all types of plastic waste. Due to it, a recycled-plastic market for Mongolian companies shrank considerably. Therefore, to support the companies and to increase an amount of recycled plastic, it is essential to solve the market issue. Penetrating a consumer market is a solution to it. A primary purpose of this research is to explore customer preference and attitude to a recycled plastic bottle and to discover information effect on the attitude. In Mongolia, there is a large amount of information regarding dangers of plastic products. Therefore, Mongolians strongly express their negative attitude to the product. On the other hand, information relating with recycled plastic products is insufficient. In this case, how customers perceive a recycled plastic product and their reaction after receiving such information is unknown. The research aims to investigate this issue. 1049 Mongolian people participated in this research. A survey was conducted in September 2019. First, the research investigated customer preferences for new and recycled plastic bottles. Even though nearly half of respondents did not consider the bottle difference, a new plastic bottle was preferred twice as many as a recycled one. Customer age, usage experience and the perceptions of impurity and health impact had a significant correlation with the customer preference. To measure a customer attitude, a 12-point scale was employed. Respondents who preferred one of the bottles tended to be certain of their choice. After the first scale, respondents received information related with recycled plastic material and afterwards evaluated their attitude on the same point scale once more. Information effects were determined by a variation of the first and second attitude points. The information influenced on over one third of all respondents. Positive information tended to affect more than negative one. The most influential positive information is regarding product value of a recycled plastic bottle. The negative one is news which aimed at product outcome..
(4) Contents Chapter 1 Introduction ...................................................................................................... 1 1.1 Background ............................................................................................................. 1 1.2 Problem definition .................................................................................................. 5 1.3 Research aim and objectives .................................................................................. 6 1.4 Motivation and significance ................................................................................... 6 1.5 Thesis structure ....................................................................................................... 7 Chapter 2 Literature review .............................................................................................. 8 2.1 Customer preference and attitude ........................................................................... 8 2.1.1. Conceptual framework ............................................................................... 8 2.1.2. Research method review ........................................................................... 10 2.1.3. Previous relevant findings ........................................................................ 10 2.2 Information effect and difference ......................................................................... 12 2.1.1. Conceptual framework ............................................................................. 12 2.1.2. Research method review ........................................................................... 13 2.1.3. Previous relevant findings ........................................................................ 15 2.3 Summary............................................................................................................... 16 Chapter 3 Research design ............................................................................................. 17 3.1 Research question ............................................................................................ 17 3.2 Data necessity .................................................................................................. 18 3.3 Questionnaire structure .................................................................................... 19 3.4 Sampling .......................................................................................................... 28 Chapter 4 Research result ............................................................................................... 29 4.1 Customer of bottled water................................................................................ 30 4.2 Customer preference and comparison .............................................................. 32 4.3 Customer attitude ............................................................................................. 37 4.4 Factors of customer attitude ............................................................................. 40 4.5 Information effect on customer attitude ........................................................... 44 4.6 Information types and difference ..................................................................... 46 4.7 Hygiene perception of recycled plastic ............................................................ 50 4.8 Customer perception and product origin.......................................................... 51 4.9 Customer demand for recycled plastic bottle................................................... 52 Chapter 5 Discussion ...................................................................................................... 53 5.1 Customer preference and attitude .................................................................... 53 5.2 Factors of customer attitude ............................................................................. 53.
(5) 5.3 Information effect and diversity....................................................................... 54 Chapter 6 Conclusion ..................................................................................................... 55 6.1 General conclusion .......................................................................................... 55 6.2 Implications of findings from the results ......................................................... 57 6.3 Limitation in this study .................................................................................... 57 Bibliography ................................................................................................................... 58 Appendix ........................................................................................................................ 63 Appendix 1: Demography - Age ................................................................................. 63 Appendix 2: Demography – Gender ........................................................................... 63 Appendix 3: Demography - Education ....................................................................... 63 Appendix 4: Geographical classification .................................................................... 64 Appendix 5: Questionnaire distribution ..................................................................... 64 Appendix 6: Questionnaire ......................................................................................... 65 Acknowledgements ........................................................................................................ 67.
(6) List of Figures Figure 1-1.Global plastic production. ....................................................................... 2 Figure 1-2:News via Mongolian national broadcasting. .......................................... 3 Figure 2-1. A general structural framework for analyzing decision-making. ........... 9 Figure 2-2. Relationship between consumer attitudes and behavior ........................ 9 Figure 2-3. The range of information definitions divided into different parts ....... 13 Figure 4-1: Proportion of respondents who buy bottled water and do not. ............ 30 Figure 4-2: Respondent preference for water sizes ................................................ 31 Figure 4-3: Usage purpose of bottled-water. .......................................................... 31 Figure 4-4: Respondent preference for plastic bottles ............................................ 32 Figure 4-5: Respondent choices in age categories.................................................. 33 Figure 4-6: Respondent choice in education level categories ................................ 34 Figure 4-7: Information-effect point....................................................................... 44.
(7) List of Tables Table 3-1: Data necessity for each of the sub research questions. ......................... 18 Table 3-2: Text which refers a survey purpose in the questionnaire. ..................... 19 Table 3-3:Question and answer for obtaining data for SRQ 1.1 ............................ 19 Table 3-4:Question and answer for obtaining data for SRQ 1.2 ............................ 19 Table 3-5:Question and answer for investigating a customer attitude .................... 20 Table 3-6: Question and answer for exploring customer perceptions .................... 20 Table 3-7:News design, question, and answer for discovering information effect. 21 Table 3-8:Concepts which should be included in news pieces ............................... 22 Table 3-9:The news pieces to be used for the research .......................................... 22 Table 3-10:Question and answer for exploring customer perception of hygiene ... 26 Table 3-11:Question and answer for a difference between recycling countries ..... 26 Table 3-12:Demographics....................................................................................... 27 Table 3-13:Notification........................................................................................... 27 Table 4-1:Respondent Choice * Age Group Crosstabulation ................................. 30 Table 4-2:Respondent Choice * Gender Crosstabulation ....................................... 30 Table 4-3:Water Size * Customer Age Crosstabulation ......................................... 31 Table 4-4:Respondent preference for packaging material ...................................... 32 Table 4-5:Choice * Age Group Cross tabulation .................................................... 33 Table 4-6: Choice * Gender Crosstabulation .......................................................... 33 Table 4-7: Choice * Education Crosstabulation ..................................................... 34 Table 4-8: Choice * Usage Experience Cross tabulation ....................................... 35 Table 4-9: Choice * Perception of Impurity Crosstabulation ................................. 35 Table 4-10: Choice * Perception of Health impact Tabulation ............................... 36 Table 4-11: Respondent attitudes to the bottles ...................................................... 37 Table 4-12: A comparison between respondents filled “5” and “-5” as age ........... 38 Table 4-13:A comparison between respondents filled “5” and “-5” as gender ...... 38 Table 4-14: A comparison between respondents filled “5” and “-5” as education . 39 Table 4-15: Correlation between customer preference and its possible factors ..... 39 Table 4-16: Total points of the attitude change in each part of the interval ........... 44 Table 4-17: Respondents who changed their attitude and choice. .......................... 45 Table 4-18: Information effects on respondents who changed their attitudes. ....... 47 Table 4-19: Information effects of each news type ................................................ 48.
(8) Table 4-20: Customer perception of hygiene standard ........................................... 50 Table 4-21: Choice * Difference between Recycled Countries Crosstabulation .... 51 Table 4-22: Customer attitude towards recycled plastic in Mongolia .................... 52.
(9) Chapter 1 Introduction Chapter 1 provides a brief introduction of this research. Plastic pollution statistics and solutions for the waste are included in the chapter. Mongolian situation, especially an information environment is described. Research problem, aim and objectives are introduced and follow by the research motivation and significance. There is a structure of this report as well.. 1.1 Background Waste pollution - Mankind has been inventing numerous new things in a short time. Unfortunately, bulk of the inventions is out of environmental cycles and therefore produces a large amount of waste. Waste damages the environment and the ecosystem permanently. Other living beings have been still living without nature destruction for hundred million years. In 2016, 2.01 billion tons of waste were generated in the world and each person discarded 0.74kg waste every day. 34 years later, the amount of waste will rise by 70% up to 3.4 billion tons [46]. It will increase environmental pollution by the same amount. Therefore, it is essential to protect the natural ecosystem by reducing an amount of waste. Although waste is an issue of both of developed and developing countries, 90% of developing countries discards waste in unregulated sites and incinerates openly [46]. Therefore, waste management improvement of developing countries is one of the most important policies to protect the environment. Plastic waste - In 1907, plastic was invented and named “Bakelite” [25]. Due to characteristics such as being shaped easily, low cost, resistance for electricity conduction, et cetera, plastic started being sold and plastic bags were manufactured in 1950 and 1970 respectively [42]. As growth of plastic consumption, the negative side of plastic material appeared gradually. At present, a huge amount of plastic waste is being generated everywhere. It has potential to exist in the environment for 500 years or more [2]. It pollutes air by emission, entangles wild animals and causes a digestion problem to the animals to be harmed and dead due to it [41]. Micro and nano plastics are found everywhere in the soil, the ocean, food, drinking water, et cetera [22]. Researchers are still investigating its effect on human health and the environment. Furthermore, plastic waste influences on climate change and 83% of pure water polluted by plastic debris 1.
(10) according to the research in 2017. Plastic consumption is increasing rapidly (figure 1-1). The horizontal axis of the chart shows dates to an amount of plastic production in a decade. The vertical axis displays an amount of plastic production. 407 million tons of plastic were used for manufacturing plastic products in 2015. 42% of the plastic uses to produce single-use packaging. From 1950 to 2015, 8.3 billion tons of Figure 1-1.Global plastic production [20]. waste had been generated. Plastic covers 10% of total waste in the world. 55% of it was discarded at dumpsites. 8% and 6% of the waste were incinerated and recycled, respectively. Solutions to plastic waste - There are several methods to solve plastic waste such as landfill, incineration, energy recovery, downgauging, reuse, recycling, biodegradation, and circular business [24]. Landfill has been still a major solution so far. 79% of the plastic waste generated between 1950 and 2015 were transferred to landfill sites or environment, 12% and 9% were recycled and incinerated, respectively [22]. However, the methods have some disadvantages. Landfill is not a suitable method considering that waste in disposal areas is still dangerous for near environment and human health. Incineration produces hazardous substances into the atmosphere [24]. However, recycling has not the disadvantages of landfill and incineration and is one of the biggest solutions. If all plastic over the world is recycled, it would save 3.5-billion-barrel oil. It equals 176 billion dollars [23]. Plastic recycling in Mongolia - In 2015, 2.9 million tons of waste were generated in Mongolia. The waste had risen roughly threefold within 5 years since 2010 [49]. 880.21237.2 tons of waste are generated in Ulaanbaatar per day. An amount of plastic in the daily waste is nearly 2 tons. Only 3.2% of it becomes raw material for Mongolian recyclers. There is no waste sorting and incineration system. Roughly 90% of it goes to landfill areas [17]. In 2018, plastic waste constituted 14% of recyclable waste in Mongolia [48]. As an amount, 150 thousand tons of plastic waste are recyclable plastic. However, only 8.3% of it, 25 thousand tons of plastic is recycled per year (PET – 20,000 HDPE – 2.
(11) 3000, LDPE – 1000, PP 500 tons). For last 4 years, Mongolian plastic importation has doubled and reached 19,254 tons in 2014. On the other hand, the government of China banned the importation of plastic waste in 2017 [49]. Beverage manufacturers are major users of plastic material in Mongolia. 553,164,637 pieces of packing boxes, plastic bottles and lids were imported in 2014. There are over 15 plastic recycling companies in Ulaanbaatar. 10 of the companies are mid-sized and 5 produce plastic pellets and export it to China. The company, “An Se He” LLC which buys most of recycled plastic produces plastic tubes and construction tools. Although there is a company which has potential to produce 50 different types of plastic products for a business market, it is a small-sized company and does not work sustainably [49]. It shows that some of the pellets are used in domestic, however, plastic tubes and construction tools are for a business market. Most of recycled plastic in Mongolia becomes plastic pellets and is exported to China [48]. Considering the above facts, plastic products from other countries conquer Mongolian consumer market. Information related with recycled plastic in Mongolia - The official language of Mongolia is Mongolian. All information and news from Mongolian television channels, newspapers and news agencies are in Mongolian language, first. At present, nearly all information and news are uploaded on the internet. There was general information regarding recycling plants, recyclers, and some statistics. However, information included the contents, “Recycled plastic has impurity” and “Recycled plastic is worse than new one” is there as well. Hence, it is possible to conclude that there is insufficient information regarding advantage and disadvantage of recycled-plastic product. On the other hand, there was a large amount of information regarding plastic dangers. Here is one example of the information regarding plastic products through Mongolian national broadcasting on the Facebook. Title: “Herders, please do not use plastic utensils” Content:. Figure. 1-2:News. broadcasting [21].. via. Mongolian. • Experts indicate that usage of plastic container is the reason to spread cancer among rural citizens. • The herder woman had a cancer. Doctors said the cancer caused by usage of plastic containers and national utensils. • Fortunately, she was operated and 3.
(12) removed the cancer in 2013. After that, she decided to replace plastic with another materials for use. • Furthermore, she is appealing to public not to use plastic container and utensils. The above news was uploaded in February 2019. Within 9 months, the news had been viewed 270,000, shared 4300 and 55 people sent their reaction. The recycled products are made by plastic material. Hence, such information directed at recycled-plastic products may influence to a customer attitude to the products.. 4.
(13) 1.2 Problem definition There is necessity that Mongolian plastic recyclers penetrate new markets, especially a consumer market. A reason is that the biggest buyers of Mongolian recyclers were Chinese companies. The government of China forbade importation of plastic waste in 2017. Consequently, Mongolian recyclers lost their largest market, whereas an amount of plastic import was increasing. If the plastic recyclers penetrate a bottle market of beverage and juice, it can solve several problems by one solution. There will be unknown situation when penetrating a consumer market. Most recyclers produce plastic granules and export them to China. The other plastic is used to produce plastic tubes, construction equipment and other similar things. These are business products. Although there is a company which produces 50 different products such as a chair, a table and fence, it is a small company and does not work sustainably. Hence, it is possible to conclude that Mongolia plastic recyclers do not produce consumer products. Therefore, there will be unknown situation due to a customer perception. There is possibility that information influences on a customer attitude. The Mongolian people have not enough information regarding the recycled products. There is little information. If the people receive more information, how will their attitude be changed? Lots of people agree dangers of plastic material. The material is a nature of recycled plastic products as well. If such information directs at recycled plastic products, will there be the same reaction from customers? Hence, a research purpose is to know a customer perception of the recycled plastic products and its change depending on relevant information.. 5.
(14) 1.3 Research aim and objectives This study focuses on information effects on a customer attitude. In response to this, this study aims to investigate a customer preference and attitude to a recycled-plastic water bottle, factors, and information effects on the attitude. Objectives 1. To find out a customer preference and attitude to a recycled plastic bottle 2. To discover information effects on a customer attitude. 3. To explore an opportunity to penetrate a consumer market for Mongolian plastic recyclers.. 1.4 Motivation and significance The Mongolian plastic import has been increasing whereas the plastic export was decreased. It caused rapid growth of plastic waste and thus plastic pollution in Mongolia. There are few plastic recyclers. Therefore, it is essential to motivate plastic recycling in Mongolia. Due to the Chinese prohibition, their market has shrunk considerably. However, there is an opportunity of broadening the market. It is penetration of consumer markets. Mongolian plastic recyclers have nearly no experience on end-consumer market. Under this circumstance, there will be high risk to penetrate the consumer market due to unknown perception. This research will help to understand customers’ perception. It will be one part of influential factors in a purchase decision. Modern companies aspire to have complete database of customers for a reason of exact prediction of customer reactions in any circumstance. In other words, they aim to find all factors which correlation coefficient reaches 1.0 with the changes. The research aimed to investigate information effects on customers’ perception of probability, risk/value and a tendency and thus calculate correlation between the decision changes and the information types. This calculation will be dedicated to an exact prediction of purchase-decision changes.. 6.
(15) 1.5 Thesis structure Chapter 1 provides a brief introduction of this research. Plastic pollution statistics and solutions for the waste are included in the chapter. Mongolian situation, especially an information environment is described. Research problem, aim and objectives are introduced and follow by the research motivation and significance. There is a structure of this report as well. Chapter 2 shows theoretical background, research methods and prior findings relating with decision-making. The second part consists of literature review regarding information effects. At last, there is a summary for determining research scope and choosing research methods. Chapter 3 introduces research questions and data necessity. A questionnaire structure covers questions and answers for obtaining necessary data and a relation between them. It includes news which is designed for this research and appearance. At last, information regarding sampling method, the number of participants and distributed questionnaire is included. Chapter 4 starts with a description of gathered questionnaires and its composition. In this chapter, Mongolian customers of bottled water are determined. Their preference and comparison are introduced. Customer attitudes are measured as well. There are calculation and comparison of information effect. It includes analysis of customers’ perception of plastic bottles recycled by Mongolian companies. Chapter 5 compares the recent results with previous ones. First, it shows findings related with customer preference and attitude. It includes findings regarding factors of the customer preference. At last, there is a part of information types and effects. Chapter 6 covers a research conclusion. The conclusion consists of consumer market of bottled water in Mongolia, a customer preference for recycled plastic bottle, information effect on customer attitude and opportunities to penetrate consumer market. The chapter covers research implication and limitation as well.. 7.
(16) Chapter 2 Literature review Chapter 2 shows theoretical background, research methods and prior findings relating with decision-making. The second part consists of literature review regarding information effects. At last, there is a summary for determining research scope and choosing research methods.. 2.1 Customer preference and attitude 2.1.1. Conceptual framework Customer: • A person who buys goods or a service [5]. • A person who purchases goods or services from another; buyer; patron [11]. • A person or company that buys goods or services [35]. Hence, possible participants of the research are people who buy bottled water. Preference: • • •. The fact of liking or wanting one thing more than another [7]. That which is preferred; choice [14]. A feeling of liking or wanting someone or something more than someone or something else [38]. Hence, how people choose or prefer a product will be investigated. Customer preference is an act of preferring one alternative to others. It is a natural process of decision-making [51]. There are several basic processes (perception, memory, attention, etc) which are activated by the act of a selection [18]. There must be a choice in order to select the alternative [32]. An essential condition of a choice is a set of options [51]. Each alternative has several basic characteristics depending on perceptions of product value or risk [32]. Outcomes, values, differential importance and occur probabilistically are primary pillars of any selection (figure 2-1). To influence customer preference, targeting the pillars is essential. A product is not evaluated by only its fundamental functions. There are relevant external factors such as words and objects related with the products [50]. 8.
(17) That have Each fixed values. Which may have. to the. differential. decision-. importance. associated with Multialternatives. And/or occur. one or more. probabilistically. outcomes maker. A1. A2. A3. O1. +. W1. P11. O2. -. W2. P12. O3. +. W3. P13. O1. +. W1. P21. O2. -. W2. P22. O3. +. W3. P23. O1. +. W1. P31. O2. -. W2. P32. O3. +. W3. P33. Figure 2-1. A general structural framework for analyzing decision-making [32].. Figure 2-2. Relationship between consumer beliefs, feelings, attitudes, intentions and behavior [44] Consumer attitude – it is a result of product judgment. If customers like the product, it is a positive attitude. If opposite, it is negative. Consumer intention – it is how customers treat a product in the future. Consumer beliefs – it is subjective thoughts regarding the product. Consumer feelings – it is feeling regarding the product while consumers are using the product or thinking relevant things with the product [44].. 9.
(18) 2.1.2. Research method review To research a relation between online WOM (word of mouth) and introduction of new product (beverage), Daniela Baum and her colleagues needed to investigate consumer attitudes to the beverage [9]. The researchers measured a taste of the beverage and attitudes to the bottle by using a 5-point scale. Other product attributes were measured by the same method. Another example of the method is measurement of a consumer perception of computer speed (from “Definitely NOT Fast” to “Definitely Fast”). As measuring the attribute, the researcher aimed to explore an irrelevant-information effect on it [47]. Likewise, a 7-point scale was employed to discover product attributes such as good quality, attraction, freshness, and health impact [1]. A consumer attitude to environmental issues can be measured by a Likert point scale as well. An attitude to recycled water was evaluated by a 7-point scale. Its answer interval was from disagree to agree and from unfavorable to favorable [29]. Likewise, an attitude to environmental packaging and recycling were estimated by a 5-point scale [27]. Furthermore, the research questions related with purchase intention and consumer attitude were designed with an answer style of a Likert point scales (from disagree to agree) as well [26]. From a perspective of studying an ecological product, Keiko Yamaguchi and Kenji Takeuchi researched a consumer perception of a refill pack in a way to design questions for studying attributes of the pack and to gather participants’ answer by a 4-point scale (from “strongly agree” to “strongly disagree”) [28]. Willing to pay (hereafter, WTP) is one of the methods to measure the attitude as well. It was employed to investigate French consumers' perception of plastic water bottles [8].. 2.1.3. Previous relevant findings Caroline Orset and her colleagues explored that customers tended to pay for packaging made from recycled plastic and biodegradable bio plastic (PLA) more than new one [8]. Information effects depending on information types was investigated in a case of wild and farmed codes (fish). As a result, it was difficult to change some beliefs by the information. Some negative beliefs were strong to decrease price until 0. Consumers are sensitive to freshness of packaging [1]. In contrast, environmental awareness can change a purchase decision in a way to promote customers’ emotion. The emotion significantly influences on a choice [39]. A customer perception of product packaging can influence on attitudes to other properties of a product. Another finding is that a customer attitude 10.
(19) cannot represent a purchase decision precisely [40]. Eco-friendly packaging has a potential to increase a product value [10]. Some people choose eco-packaging due to its economic benefit, whereas the others prefer the packaging for more valuable life [34]. Being eco-friendly is an important factor to influence on a perception of packaging material as well [33]. Women are more sensitive to product risk, especially for chemical products. Youngsters do not consider the risk in general [45]. Men barely reuse plastic packaging whereas elders tend to recycle and use it [34]. When customers buy a fish in packaging, the customers compare product origin, intrinsic quality, convenience, and nutrition [1]. Graca Martinho and his colleagues clustered customers as gender, eco-friendly opinion, social awareness, and an attitude to green purchase [19].. 11.
(20) 2.2 Information effect and difference 2.1.1. Conceptual framework Information: • •. facts or details about a person, company, product, etc [6]. knowledge communicated or received concerning a particular fact or circumstance; news [13].. • knowledge or facts about someone or something [37]. Hence, the information which is used for this research will be knowledge or facts of recycled plastic material. Effect: • The result of a particular influence [4]. • Something that is produced by an agency or cause; result; consequence [12]. • A change that is produced in one person or thing by another [36]. Hence, an information effect in this research stands for an attitude change caused by information. A decision-making process starts perceiving alternatives of a choice and their outcomes, values/risks, and other relevant factors. A brain analyzes the information and evaluates the alternatives [18]. There are 2 types of decision makers depending on how to use information. Some people make a decision as the rational decision theory [32]. The people aim to gather as much as possible information regarding the alternatives and making a decision based on the information [32]. However, in the real world, obtaining all relevant information is nearly impossible. In this circumstance, people make a decision according to the behavioral decision theory. In few words, people select one alternative if the people think that the alternative is “Good enough” [32]. It is an example how decision-making strategies influence on a selection. There are compensatory strategies which divide relevant information as negative or positive. When people use those strategies, a choice is done after evaluating all relevant information. On the other hand, non-compensatory strategies employ insufficient information and skip alternatives if there is negative information once [32].. 12.
(21) Philosophical. Semantic. Nonsemantic. Biological. Human. Nonsocial. Social. Knowledge. Nonbiological. Nonhuman. Mental. Nonmental. By 1988, the number of definitions regarding information had been reached over 400. Messages, news, data, knowledge, documents, literature, intelligence, symbols, signs, hints, tips, and what is gathered by some special agencies are considered as information [52].. Nonknowledge. Scientific. Nonscientific. Figure 2-3. The range of information definitions divided into different parts [52]. 2.1.2. Research method review To explore a relationship between web-search stance and decision making, Rod Roscoe and his colleagues requested participants to choose 3 bottled waters among 15 samples. After that, their knowledge related with bottled water was investigated. Participants were allowed to search relevant information regarding bottled water on the internet. The second choice came after the search [43]. Another research which used bottled water aimed to investigate customer’s WTP. The researchers provided respondents with 8 messages regarding plastic materials and requested their choice after each message. A general content of the messages was regarding plastic pollution, environment effects and biodegradable plastic [8]. There is another example that a risk perception of chemical products was measured after providing information related with evaluation of its hazard. A similar process was done after instructions of the chemical product [45]. Adriaan Kole and his colleagues (2009) researched information effects on a product value. The researchers classified participants into groups in 4 different conditions of information and compared data from the groups. For example: participants in the 1st 13.
(22) group received information of product origin (wild or farmed), while the 2nd group was provided messages regarding product freshness. After the information, there were questions to measure their attitude [1]. Another similar research investigated a recycling attitude and behavior of American citizens. The researchers provided different messages to participants and afterwards asked their choice [30]. Likewise, there is a research which investigated a consumer choice of packaging material and recyclability. In the research, researchers divided participants into 3 groups. The 1st group made their choice without any information. Participants in the 2nd group enabled to search information to judge alternatives. The last group members watched a video regarding recycling and requested their choice after that [31]. The method to divide into different conditions of information employed to discover a relationship between information and motivation for recycled water. The researchers provided basic information of the water to all participants. The participants were divided into several groups. The 2nd and 3rd groups were provided more information related with environment, pollution, and mineral provision of water, respectively [29]. Tom Meyvis and Chris Janiszewski researched irrelevant-information effects on a consumer perception [47]. 2 different methods were used for the purpose. The first method was that participants received 1 supportive information with several irrelevant pieces of information regarding the product. After the information, they must refer their belief in benefits of the product. As the second method, the irrelevant information was judged as true or false through showing product replicates. Another method to measure a relationship between information and a purchase decision is that Franco Mawad and his colleagues prepared 16 yogurt labels with different information pieces (images, title, ingredient, etc). Participants were requested to select among the samples. During the selection, eye movement of the participants was being recorded by an eye-tracker software [15]. Some researchers asked the relationship by simple and direct questions [26]. Likewise, to explore a consumer attitude to ecopackaging, some researchers aimed to know a consumer preference for products in ecopackaging and their based knowledge. There was a close-ended question to investigate the preference [16].. 14.
(23) 2.1.3. Previous relevant findings Kelly S. Fielding and her colleague investigated information effectiveness in a case of recycled water. The researchers provided messages related with a process of water recycling and its safety. As a result, there was a difference before and after receiving the information. Respondents believed the safety of recycled water more than before [29]. Some researchers investigated an effect of irrelevant information. Logically, there would be no effect. According to the results, there were negative effects from irrelevant information. It was reducing influence of supportive information [47]. There were several factors which seemed not to have direct relevance with customers. However, the factors, brand sales rates, evaluation, and recommendations of experts could influence on respondent attitudes [26]. In addition, electronic referral has a potential to affect both of expectations and satisfaction of consumers as well. Particularly, its effect on new consumers is strong. Likewise, consumers who used the product before was even affected by the referral [9]. In contrast, there is an example that positive information affects negatively. Some researchers investigated a difference between information effects depending on information types in a case of cod (fish) fillets. The researchers prepared 6 groups in different conditions of information. In addition, one of the important differences was fish types. It was a significant factor. Participants received wild or farmed cods. Information regarding advantages of farmed cod reduced a consumer preference for the fish [1].. 15.
(24) 2.3 Summary To research a customer preference for a recycled-plastic water bottle, it is essential to distinguish participants whether a customer of bottled water or not. There must be at least two alternatives including new and recycled bottles. Demographics is a basic source of possible factors. A prime difference between the bottles should be considered as a factor as well. Assumptions related with the factors can be examined in the same way. It is difficult to change a customer decision or preference by one piece of news. Therefore, it is necessary to use an attitude interval to measure it. A Likert point-scale measures customer attitude, perception, and preference. Likewise, product attributes are evaluated by the method. A 5-point scale is more suitable for this research. There must be news pieces for changing a customer attitude. To investigate a difference between information effects depending on information types, several pieces of news will be required. The pieces should target at basic factors of decision-making such as outcome beliefs, value/risk and probability. There should be news relating with the environment and irrelevant information with customers and product. A difference between negative and positive news will be an important finding of this research.. 16.
(25) Chapter 3 Research design Chapter 3 introduces research questions and data necessity. A questionnaire structure covers questions and answers for obtaining necessary data and a relation between them. It includes news which is designed for this research and appearance. At last, information regarding sampling method, the number of participants and distributed questionnaire is included.. 3.1 Research question MRQ: how does information influence on customer attitudes for a recycled plastic bottle in Mongolia? SRQ-1: How do Mongolian customers perceive a recycled plastic bottle? –the question covers customer preferences for new and recycled plastics. It investigates customer attitudes to the bottles. As a result, determinants of the preference will be discovered. SRQ-2: How much does information affect the customer attitude? –the first attitude of customers will be asked, first. The customers receive relevant information after referring their first attitude. The second attitude will be evaluated after the information. SRQ-3: What are customer attitudes to a plastic bottle recycled by Mongolian company? - The question examines a hygiene perception of recycled plastic in Mongolia. A difference between plastic recycling countries, Mongolia and Japan will be discovered. At last, a customer attitude to products made from recycled plastic by Mongolian companies will be investigated.. 17.
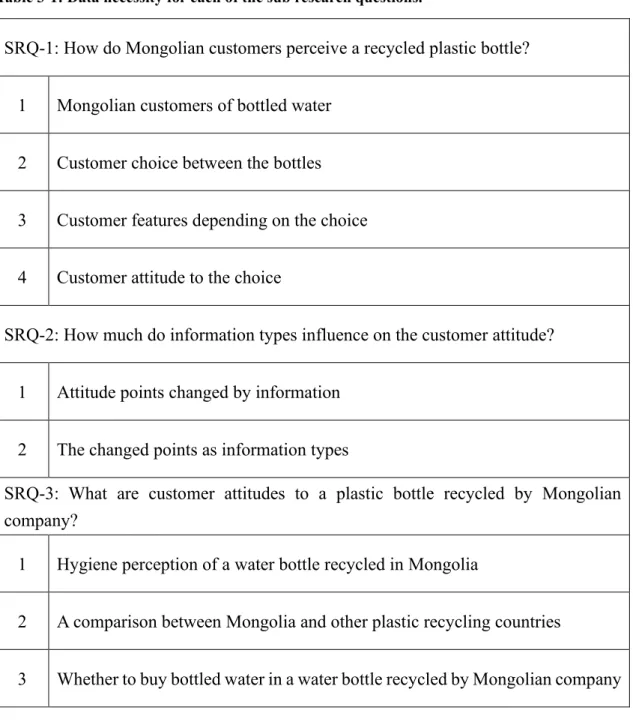
(26) 3.2 Data necessity Table 3-1: Data necessity for each of the sub research questions.. SRQ-1: How do Mongolian customers perceive a recycled plastic bottle? 1. Mongolian customers of bottled water. 2. Customer choice between the bottles. 3. Customer features depending on the choice. 4. Customer attitude to the choice. SRQ-2: How much do information types influence on the customer attitude? 1. Attitude points changed by information. 2. The changed points as information types. SRQ-3: What are customer attitudes to a plastic bottle recycled by Mongolian company? 1. Hygiene perception of a water bottle recycled in Mongolia. 2. A comparison between Mongolia and other plastic recycling countries. 3. Whether to buy bottled water in a water bottle recycled by Mongolian company. 18.
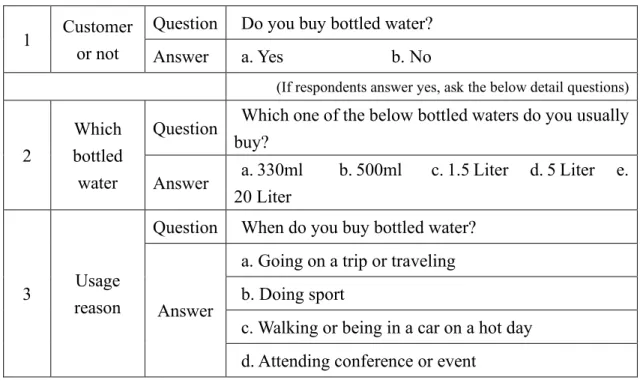
(27) 3.3 Questionnaire structure Table 3-2: Text which refers a survey purpose in the questionnaire.. 1. Purpose. Text. A purpose of the survey is to research customers’ attitude to packaging of bottled water and information effect on the attitude.. SRQ 1.1 Who is a customer of bottled water in Mongolia? Table 3-3:Question and answer for obtaining data for SRQ 1.1. 1. Customer or not. Question. Do you buy bottled water?. Answer. a. Yes. b. No. (If respondents answer yes, ask the below detail questions). 2. Which bottled water. Question. Which one of the below bottled waters do you usually buy?. Answer. a. 330ml 20 Liter. Question. 3. Usage reason. b. 500ml. c. 1.5 Liter. d. 5 Liter. e.. When do you buy bottled water? a. Going on a trip or traveling. Answer. b. Doing sport c. Walking or being in a car on a hot day d. Attending conference or event. SRQ 1.2 What is a customer preference for recycled and new plastic bottles? Table 3-4:Question and answer for obtaining data for SRQ 1.2. Question. 1. Customer choice. Which bottled water do you buy if there are ones made from recycled and virgin plastics on a bar? a. Bottled water in a virgin-plastic bottle. Answer. b. Bottled water in a recycled-plastic bottle c. Both d. None of them 19.
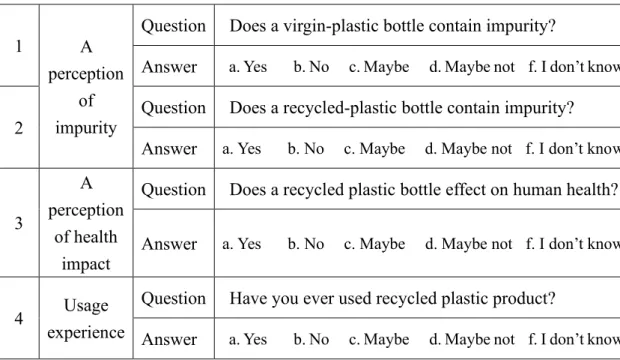
(28) SRQ 1.3 What are customer differences depending on the preferences? This question will be answered after comparing and analyzing data from the other questions. SRQ 1.4 What are customer attitudes to recycled and new plastic bottles? Table 3-5:Question and answer for investigating a customer attitude. Question 1. Customer attitude. Please evaluate your choice. /from 1- “uncertain” to 5“certain”/. Answer. According to the summary (p.16), a Likert point scale will be used to measure customer attitudes. Moreover, a 5-point scale is common and suitable. The above point scale integrated and covered all options Table 3-6: Question and answer for exploring customer perceptions and experience. 1. 2. Question Does a virgin-plastic bottle contain impurity? A a. Yes b. No c. Maybe d. Maybe not f. I don’t know perception Answer of Question Does a recycled-plastic bottle contain impurity? impurity Answer a. Yes b. No c. Maybe d. Maybe not f. I don’t know. 3. A Question Does a recycled plastic bottle effect on human health? perception of health Answer a. Yes b. No c. Maybe d. Maybe not f. I don’t know impact. 4. Question Usage experience Answer. Have you ever used recycled plastic product? a. Yes. b. No. c. Maybe. d. Maybe not f. I don’t know. The “Maybe” and “May be not” answers are added because some respondents cannot answer the above questions precisely. The answers will support for referring their attitude. The other possible factors, demographics and origin of country will be asked by the below questions.. 20.
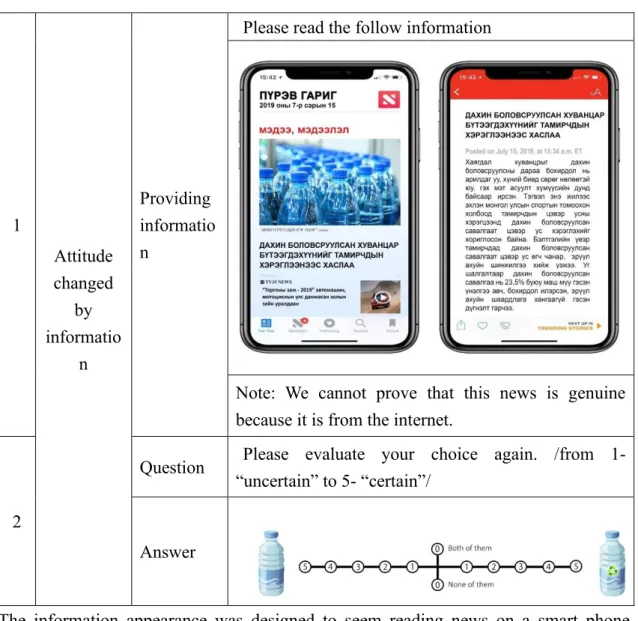
(29) SQR 2.1 How much does information influence on a customer attitude? Table 3-7:News design, question, and answer for discovering information effect.. Please read the follow information. 1 Attitude changed by informatio n. Providing informatio n. Note: We cannot prove that this news is genuine because it is from the internet. Question. Please evaluate your choice again. /from 1“uncertain” to 5- “certain”/. 2 Answer. The information appearance was designed to seem reading news on a smart phone. According to the summary (p.16), the second choice will be requested after providing information. SRQ 2.2 How much do information types effect on customer attitudes? According to the literature [32], there are 5 pillars of decision-making. Negative and positive pieces of news are written for influencing on the pillars except for the alternative and the differential importance. A reason of skipping some pillars is that alternatives are an object of a decision and thus not a factor to change. A differential importance will be concluded by comparing positive and negative news pieces and therefore it is not an 21.
(30) object to be changed by a news piece. The following table 3-8 shows content and purposes of the news pieces. For example: There are 2 pieces of news aimed to influence on a customer perception of product outcome. One of the 2 pieces includes positive message, whereas the other one has negative one. News which aimed at the pillars included advices from experts, experiment results and relevant statistics. In total, 10 pieces of news related with recycled plastic are prepared for the purpose (table 3-9). Table 3-8:Concepts which should be included in news pieces to be used for the research. Impurity and health Positive. 5. Negative. 5. Included contents. Environment. Other. 1. 1. 1. 1. 1. Outcomes. Value. Occur probabilistically. good effect. positive news. 1. 1. 1. 1. 1. Outcomes. Risk. Occur probabilistically. bad effect. negative news. Advice from experts. Advice from experts. Advice from experts. Result Result experiment experiment Statistics. Result experiment. Statistics. Statistics. Table 3-9:Concepts which should be included in the news pieces to be used for the research. (2) Title: Recycled-plastic product can match the usage standard of Mongolian athletes There are some questions regarding recycled product among people, “Is impurity of waste plastic removed after recycling?”, “Is it bad for 1. Outcome. Positive. human health?” and so on. From this year, Mongolian athletes can use bottled water in a recycled plastic bottle. Health impact and hygiene of the water in a recycled plastic bottle was inspected among the athletes who were drunk after exercise. As a result, the water was pure. It shows that the bottled water matches hygiene standards and has no effect on human health. 22.
(31) (1) Title: Forbade recycled-plastic product to athletes There are some questions regarding recycled product among people, “Is impurity of waste plastic removed after recycling?”, “Is it bad for human health?” and so on. From this year, Mongolian athletes have been forbidden to use Negative bottled water in a recycled plastic bottle. Inspection of health and hygiene was done among the athletes who were drunk water in a recycled plastic bottle. As a result, impurity level was 23.5%. It shows that the bottled water cannot match hygiene standard and is bad for human health. (7) Title: Difference between recycled and new plastics International experts conducted some interesting experiment. The experts collected 153 plastic. 2. Value/Risk. Positive. items from a landfill site and recycled them. A result of the experiment was noticeable. The recycled plastics became clearer than some metals, iron, aluminum, and cetera. After this result, the experts would research it with new plastic. However, the experts stopped the experiment. A reason is that hygiene of the recycled plastic was the same with new one.. 23.
(32) (3) Title: Difference between recycled and new plastics International experts conducted some interesting experiment. The experts collected 153 plastic items from a landfill site and recycled them. A result of the experiment was noticeable. After this Negative result, the experts would research it with new plastic. However, the experts stopped the experiment. A reason is that any index of hygiene and health impact of the recycled plastic was lower than the new one apparently. In some cases, it was dangerous for human health.. Positive. (9) Title: Good news from international experts for Mongolian International experts inspected recycled plastic products to be sold in ………… province/district/city. According to the inspection, sanitation of the products could match relevant standards. Furthermore, water bottles made from recycled plastic scored 100% and thus products in plastic packaging in the city have no impurity.. 3. Occur probabilistically. (10) Title: Caution from international experts to citizens of ………… province/district/city International experts inspected recycled plastic products to be sold in ………… province/district/city. According to the inspection, Negative sanitation of the products was inadequate and lower than rates of some poor countries. Furthermore, water bottles made from recycled plastic scored 23.5% and thus products in plastic packaging in the city have impurity and a bad effect on human health.. 24.
(33) Positive. 4. (8) Title: Let’s save the world by choosing recycled plastic Plastic waste is one of the biggest environment polluters in the world. Wild animals are entangled and harmed by plastic. Some animals eat it and die due to digestion. By 2050, according to the research, an amount of wasted plastic into the ocean will become greater than an amount of all fish in the ocean. 1 million plastic bottles have been being wasted in the world per minute so far. Therefore, choosing recycled plastic is important for decreasing plastic pollution.. Environment. (6) Title:. Recycled plastic has a bad effect on. the environment After recycling plastic, properties of the plastic are changed and becomes more breakable and Negative inflexible. The emission of CO2 (carbon dioxide) of the plastic rises a lot and a degrading period is extended by 100-200 years. Furthermore, it spreads faster than the new one. Therefore, recycled plastic is more harmful than new plastic.. 5. Other. Positive. (4) Title: Recycled plastic becomes a choice of Global brands Global brands such as Adidas and Nike started using abandoned plastic in the ocean as raw material. 80% of sport boots is made from recycled plastic. Over 1 million and 5 million sport boots of the “Adidas” brand were made from recycled plastic in 2017 and 2018, respectively. In 2019, the brand planned to reach the amount to 11 million. The “North Face”, “Aday”, “Beyond Skin”, “Rothy’s”, “Andi”, “Vivobarefoot”, “Patagonia” and “Bhava” brands use recycled plastic as well.. 25.
(34) (5) Title: Do not drink water if horse does not drink it. A company which produces plastic trough of farm had to select new plastic or recycled plastic as raw material. To decide it, a manager of the company studied and compared the 2 types of plastic. As a result, there was no proof that recycled plastic is Negative pure. Instead, there were several recommendations how to use it. After that, the manager produced 2 troughs from recycled plastic and new plastic. The troughs are placed in a horse stall and filled by water. No horse drunk water in the recycled-plastic trough. The result was obvious. There is a proverb that drink the water if horse drinks. Likewise, do not drink the water if horse does not. Numbers with the titles are news' codes inputted into SPSS software. SQR 3.1 How do customers perceive hygiene of plastic recycled in Mongolian? Table 3-10:Question and answer for exploring customer perception of hygiene. 1. Can plastic recycled in Mongolia match hygiene A Question standards? perception a. Yes b. No c. Maybe d. Maybe not f. I don’t know of hygiene Answer. SRQ 3.2 How do customers perceive a difference between plastics recycled in Mongolia and Japan? Table 3-11:Question and answer for exploring a difference between plastic recycling countries. 1. Country origin. Question Answer. Is there any difference between bottles recycled in Mongolia and Japan? a. Yes. b. No. 26. c. Maybe. d. Maybe not f. I don’t know.
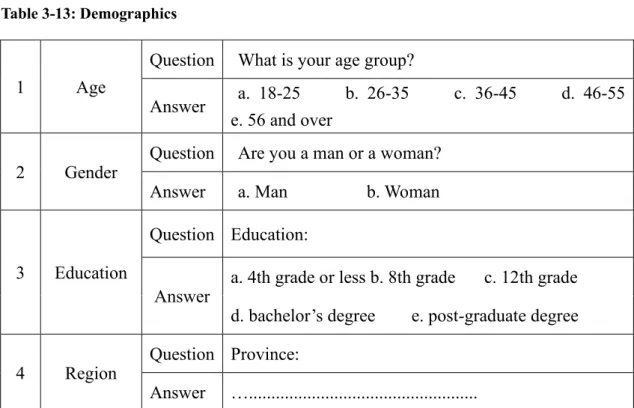
(35) SRQ 3.3 How do customers perceive a plastic bottle recycled by Mongolian companies? Table 3-12: Question and answer for exploring a difference between plastic recycling countries. 1. Question. Would you buy a bottled water in packaging made from recycled plastic by Mongolian companies?. Answer. a. Yes. Opportunity. b. No. c. Maybe. d. Maybe not f. I don’t know. Table 3-13: Demographics. Question 1. Age. 2. Gender. Answer. What is your age group? a. 18-25 b. 26-35 e. 56 and over. c. 36-45. Question. Are you a man or a woman?. Answer. a. Man. d. 46-55. b. Woman. Question Education: 3. Education Answer. 4. Region. a. 4th grade or less b. 8th grade d. bachelor’s degree. c. 12th grade. e. post-graduate degree. Question Province: Answer. ….................................................... Table 3-13:Notification. 1. Fake news notification. text. The above information is not real. It is written only for the research. Complete questionnaire – (appendix 6). 27.
(36) 3.4 Sampling This research was conducted in Mongolia in September 2019. Geographical clustered sampling was employed. Firstly, Mongolian population was divided into 3 regions (east, west, and middle). A reason of the division was that the shape of Mongolian land is vertical (appendix 4). Nearly half (45.3%) of Mongolian population lives in Ulaanbaatar, capital city. The city is in the middle region. The region included only the capital city due to a large proportion of the population. 660 questionnaires were distributed in 6 districts of the city. In the west region, 220 questionnaires were distributed in “Erdenet” and “Darkhan” cities. Mongolian provinces or cities on the right side of the capital city was included in the west region. In the east region, 156 questionnaires were handed out to respondents in “Baganuur” district, “Gobisumber” and “Dornogobi” provinces (appendix 5). A conventional method was employed to choose provinces and cities which conducted this survey.. 28.
(37) Chapter 4 Research result Chapter 4 starts with a description of gathered questionnaires and its composition. In this chapter, Mongolian customers of bottled water are determined. Their preference and comparison are introduced. Customer attitudes are measured as well. There are calculation and comparison of information effect. It includes analysis of customers’ perception of plastic bottles recycled by Mongolian companies. The survey was conducted in September 2019. It involved 1049 Mongolian respondents. 925 questionnaires were usable for this research. 793 respondents were a customer of bottled water. 38.2% of all respondents was young adults (18-25 years old). Respondents aged 26-35 made up 26.1%. Age groups “36-45” and “46-55” accounted for 18.5% and 11%, respectively. Respondents aged 56 and over covered 5.8% (appendix 1). Men and women made up 38.5% and 61.5% of respondents, respectively (appendix 2). In terms of education level, respondents at 4th grade, 8th grade and 12th grade formed 3.8%, 27.8% and 19.4% of all respondents, respectively. Bachelor’s and postgraduate degrees covered 41.5% and 7.6% (appendix 3).. 29.
(38) 4.1 Customer of bottled water SRQ 1.1 Who is a customer of bottled water in Mongolia? The pie chart (figure 4-1) illustrates a ratio of respondents who buy bottled water to ones who do not. Nearly 9 of 10 respondents referred to buy bottled water. Age: The table 4-1 displays the ages of respondents with the above difference. As a result, customer respondents covered 84%89% of each age group. It keeps the above ratio (86:14) as well. On the other hand, Figure 4-1: Proportion of respondents who respondents who do not buy bottled water accounted for 11%-16% of age groups. buy bottled water and do not. Table 4-1:Respondent Choice * Age Group Crosstabulation. What is your age group? Do you buy bottled water?. 18-25. 26-35. 36-45. 56 and over. 46-55. Tota l. Yes. 29 6. 84%. 211. 88%. 14 6. 85%. 93. 89%. 4 6. 85%. 792. No. 57. 16%. 30. 12%. 25. 15%. 12. 11%. 8. 15%. 132. Total. 35 3. 100 %. 24 1. 100 %. 17 1. 100 %. 10 5. 100 %. 5 4. 100 %. 924. Gender: Women and men who buy bottled water made up 88% and 83% of respondents, respectively (table 4-2). There was no significant difference. Table 4-2:Respondent Choice * Gender Crosstabulation. Are you a man or a woman? Do you buy bottled water?. Man. Woman. Total. Yes. 295. 83%. 498. 88%. 793. No. 61. 17%. 71. 12%. 132. 356. 100%. 569. 100%. 925. Total. 30.
(39) Bottled water size: The funnel chart (figure 4-2) shows a respondent choice of the water sizes. a 500ml bottled water is highlighted in there. The water was selected at least 4 times as many as the others. In the table 4-3, it is apparent that the biggest part (69%) of respondents aged between 18-25chose the water. 60% of the next age group Ratio of respondents who buy and (26-35) preferred it as well. Hence, if customer age Figure 4-2: Respondent preference do water not buy bottled water. for sizes becomes younger, a demand for the water rise. As for the other water sizes, there is no significant difference. The proportions of respondents who selected the sizes in each age group are similar, 5%-13%, 8-26%, 916%, 9-13% and 7-15%, respectively. Table 4-3:Water Size * Customer Age Crosstabulation. How old are you? Which size do you usually buy?. 18-25. 26-35. 36-45. 46-55. 56 and above. 330ml. 5%. 9%. 12%. 12%. 13%. 500ml. 69%. 60%. 47%. 39%. 33%. 1.5 liter. 8%. 14%. 22%. 20%. 26%. 5 liter. 10%. 9%. 10%. 16%. 13%. 20 liter. 7%. 8%. 9%. 13%. 15%. Usage purpose: Hot weather was a main reason to buy bottled water (figure 4-3). Its original answer was “walking or being in a car on a hot day”. Hence, people tend to drink the water when walking outside or being in a car on a hot day. Likewise, the second major reason was a trip and travel. People who go on a trip and travel usually buy bottled water in Mongolia. Doing sport and exercise was a noticeable reason as well. Figure 4-3: Usage purpose of bottledOn the other hand, participating conference water. 31.
(40) or event, and other reasons are included in a minor reason.. 4.2 Customer preference and comparison SRQ 1.2 What is a customer preference for new and recycled plastic bottles? From this part, data from only customer respondents were analyzed. Therefore, hereafter, “respondent” refers a respondent who buys bottled water. Customer choice: The chart (figure 4-4) shows that nearly half of respondents did not consider a difference between the bottles (hereafter, RPB) However, respondents who prefer a new bottle (hereafter, RPN) were over twice as many as respondents who prefer a Figure 4-4: Respondent preference for recycled bottle (hereafter, RPR). Only 6.4% of plastic bottles respondents refused to choose a plastic bottle (hereafter, RRP) (table 4-4). Table 4-4: Respondent preference for packaging material. Frequency. Percent. Valid Percent. Cumulative Percent. A water in a virgin-plastic bottle. 282. 35.6%. 35.7%. 35.7. A water in a recycled-plastic bottle. 128. 16.1%. 16.2%. 51.8. Both. 330. 41.6%. 41.7%. 93.6. None of them. 51. 6.4%. 6.4%. 100.0. Total. 791. 99.7%. 100%. 2. 0.3. 793. 100%. Missing System Total. SRQ 1.3 What are customer differences depending on their preference? Age – Choice: The cross tabulation (table 4-5) shows age proportions of respondents who chose different alternatives. According to the table, 40% of the respondents aged 18-25 did not a particular choice. RPN had a higher proportion (30%) than RPR (23%). Furthermore, that tendency was kept in any age group. Finally, the least proportions were belonged to RRP. There is the apparent tall column (figure 4-5). It shows that the oldest respondents tended to choose a new bottle. 32.
(41) Table 4-5:Choice * Age Group Cross tabulation. How old are you? 18-25. 26-35. 36-45. 46-55. 56 and above. New bottle. 30%. 35%. 39%. 38%. 63%. Recycled bottle. 23%. 14%. 11%. 12%. 11%. Both. 40%. 46%. 45%. 42%. 22%. None. 7%. 6%. 5%. 9%. 4%. Figure 4-5: Respondent choices in age categories. Table 4-6: Choice * Gender Crosstabulation. Gender - Choice: there was no significant difference (table 4-6), especially in the “recycled bottle” and “None of them” options. However, women preferred a new bottle little more than men.. Man. Woman. New bottle. 34%. 37%. Recycled bottle. 16%. 16%. Both. 44%. 41%. None. 7%. 6%. Education – Choice: The table 4-7 shows the education level of respondents. Except for respondents at 4th grade or less, a customer preference for a recycled bottle tends to fall off if the education level of respondents goes down. Furthermore, respondents at 8th grade preferred a new bottle the most. In any education level, most respondents did not. 33.
(42) make a particular choice. The grey columns in the clustered bar chart (figure 4-7) displays this respond. Table 4-7: Choice * Education Crosstabulation. 4th grade or less. 8th grade. 12th grade. bachelor's degree. post-graduate degree. New bottle. 20%. 40%. 35%. 36%. 29%. Recycled bottle. 33%. 14%. 9%. 18%. 23%. Both. 33%. 40%. 49%. 41%. 39%. None. 13%. 6%. 7%. 5%. 10%. Figure 4-6: Respondent choice in education level categories. Usage experience: The following table 4-8 displays how respondents referred their usage experience of recycled plastic product. There are many more RPN who think not to use the product. Ones who responded the same accounted for 39%, whereas 33% of RPN answered to use it. 60% of RPR stated to employ the product. It shows that if people think to use it, they tend to choose a recycled bottle. Likewise, most of the other respondents stated to have the experience of product usage.. 34.
(43) Table 4-8: Choice * Usage Experience Cross tabulation. Have you ever used recycled plastic product?. New bottle Recycled bottle Both None. Yes. Maybe. 14%. 19%. I don't know 28%. 33% 24%. 36%. 13%. 60% 15%. 26%. 28%. 42% 29%. 18%. 27%. 47%. Maybe not. No. 5%. 34% 39%. 5%. 22% 27%. 9%. 22% 31%. 4%. 22% 25%. Perception of impurity: The table 4-8 shows respondent perceptions of impurity of a recycled plastic bottle. As the results, roughly 28% of respondents stated not to know regarding the impurity. There are respondents who assumed that it has impurity. They made up 48% of respondents. It shows that nearly half of respondents perceive the bottle with impurity. They are twice as many as the ones who do not. Even 40% of RPR agreed what the impurity is. The other respondents tended to answer in the same way. Table 4-9: Choice * Perception of Impurity Crosstabulation. Does a recycled-plastic bottle contain impurity?. New bottle Recycled bottle Both None. Yes. Maybe. 17%. 41%. I don't know 27%. 59% 8%. 32%. 26%. 40% 8%. 35%. 34%. 42% 18%. 33%. 25%. 51%. Maybe not. No. 6%. 9% 15%. 17%. 17% 34%. 9%. 15% 24%. 8%. 16% 24%. Perception of health impact: The below table 4-10 displays respondent perceptions of health consequence of a recycled plastic bottle. Most of RPN perceive that the bottle 35.
(44) influences on human health (57%). RPB tended to have the same perception. In contrast, 35% of RPR referred that it had not, whereas ones who agreed the effect accounted for 37%. RPR covered the largest proportion of respondents who disagreed the impact. Table 4-10: Choice * Perception of Health impact Tabulation. Does a recycled plastic bottle impact on human health?. New bottle Recycled bottle Both None. Yes. Maybe. 21%. 36%. I don't know 26%. 57% 9%. 27%. 28%. 35% 7%. 32%. 35%. 39% 18%. 31%. 25%. 49%. 36. Maybe not. No. 6%. 11% 17%. 21%. 16% 37%. 12%. 14% 26%. 16%. 10% 25%.
(45) 4.3 Customer attitude SRQ 1.4 What are customer attitudes to recycled and new plastic bottles? The following table 4-18 shows how respondents evaluated their attitudes to the bottle chosen by them. There are 5 points to evaluate it. the “0” point covered both of respondents who answered “both” and “none of them”. Because those respondents did not prefer one bottle to the other. The largest number of respondents was included in the “0” point. A reason might be the above integration. There were many more RPN who filled “-5” than the other points. The largest number of RPR scored the “+5” point as well. Hence, it is possible to conclude that both of RPN and RPR tend to have the strong beliefs in their preference.. Table 4-11: Respondent attitudes to the bottles. Frequency. Percent. Valid Percent. Cumulative Percent. 1.00. 20. 2.5. 2.5. 2.5. 2.00. 12. 1.5. 1.5. 4.0. 3.00. 29. 3.7. 3.7. 7.7. 4.00. 16. 2.0. 2.0. 9.7. 5.00. 56. 7.1. 7.1. 16.8. .00. 387. 48.8. 48.8. 65.6. -1.00. 25. 3.2. 3.2. 68.7. -2.00. 11. 1.4. 1.4. 70.1. -3.00. 56. 7.1. 7.1. 77.2. -4.00. 33. 4.2. 4.2. 81.3. -5.00. 148. 18.7. 18.7. 100.0. Total. 793. 100.0. 100.0. Note: The first column shows customer attitude points. The numbers from “1” to “5” are attitudes towards a recycled plastic bottle (from “weak” to “strong”). “0” represents the “None of them” and “Both” answers. The points “-1” to “-5” are attitudes towards a new plastic bottle. These are the first choice of respondents. 37.
(46) The table 4-19comparesbetween age proportions of respondents who evaluated their attitude as “+5”and “-5”. It is possible to see that respondents aged 18-35 and preferred a recycled bottle accounted for 85.8%, whereas the percentage of a new bottle is 54%. Hence, young adults tend to be in a side of a recycled bottle. The next table (4-20) shows differences from respondent gender. In both categories, women made up the largest percentage. However, the percent of men who preferred a recycled one is higher than the percentage of ones who chose a new bottle, whereas women are opposite. It shows that women prefer a new bottle and men tend to choose a recycled one. As for education, respondents at 8th and 12th grades preferred a new bottle. Ones at the other education levels chose a recycled bottle. Table 4-12: A comparison between respondents who filled “5” and “-5” as age. Recycled “5”. New “-5”. Frequency. Percent. Frequency. Percent. 18-25. 31. 55.4. 44. 29.7. 26-35. 17. 30.4. 36. 24.3. 36-45. 1. 1.8. 29. 19.6. 46-55. 5. 8.9. 21. 14.2. 56 and above. 2. 3.6. 18. 12.2. Total. 56. 100.0. 148. 100.0. Table 4-13:A comparison between respondents who filled “5” and “-5” as gender. Recycled “5”. New “-5”. Frequency. Percent. Frequency. Percent. Male. 24. 42.9. 53. 35.8. Female. 32. 57.1. 95. 64.2. Total. 56. 100.0. 148. 100.0. 38.
(47) Table 4-14: A comparison between respondents who filled “5” and “-5” as education. Recycled “5”. New “-5”. Frequency. Percent. Frequency. Percent. 4th grade or less. 7. 12.5. 4. 2.7. 8th grade. 11. 19.6. 52. 35.1. 12th grade. 4. 7.1. 21. 14.2. bachelor's degree. 29. 51.8. 59. 39.9. post-graduate degree. 5. 8.9. 12. 8.1. Total. 56. 100.0. 148. 100.0. 39.
(48) 4.4 Factors of customer attitude To discover factors of the customer attitude, Pearson’s r correlation was computed (table 4-15). The points from “-5” to “+5” were ordered from 1 to 11 (there was “0” points as well). A reason is that the order was based on customer attitude to a recycled plastic bottle. Likewise, the answers “yes”, “maybe”, “I do not know”, “maybe not” and “no” were inputted as from 1 to 5. According to the assumption, there were 6 possible factors, age, education, perception of impurity, perception of health impact, usage experience and country of origin. There were 4 independent variables which have a significant correlation with the dependent variable. They were age, perceptions of impurity and health impact and usage experience of recycled plastic products. The perception of health impact had the highest correlation coefficient with customer attitude. However, correlation coefficients of the factors with the attitude were less than 0.5.. 40.
(49) Table 4-15: Correlation between customer preference and its possible factors. Correlations Is there any difference between bottles. How old are Customer attitude Customer attitude. Pearson Correlation. you?. Education. How old are you?. Education. Pearson Correlation. Have you ever. recycled in. plastic bottle. plastic bottle. used recycled. Mongolia and. plastic product?. Japan?. contain impurity? effect on health?. .038. .180**. .209**. -.163**. -.007. .000. .289. .000. .000. .000. .844. 793. 792. 793. 792. 793. 793. 793. -.172**. 1. -.008. .018. -.108**. .067. .064. .825. .611. .002. .059. .072. Sig. (2-tailed). .000. N. 792. 792. 792. 791. 792. 792. 792. Pearson Correlation. .038. -.008. 1. -.074*. .021. -.037. -.103**. Sig. (2-tailed). .289. .825. .037. .564. .293. .004. N. 793. 792. 793. 792. 793. 793. 793. .180**. .018. -.074*. 1. .357**. -.004. .061. Sig. (2-tailed). .000. .611. .037. .000. .921. .087. N. 792. 791. 792. 792. 792. 792. 792. .209**. -.108**. .021. .357**. 1. .018. .095**. Does a recycled-plastic bottle Pearson Correlation contain impurity?. Does a recycled. -.172**. 1. Sig. (2-tailed) N. Does a recycled-. Does a recycled plastic bottle Pearson Correlation. 39.
(50) effect on health?. Sig. (2-tailed). .000. .002. .564. .000. .605. .007. N. 793. 792. 793. 792. 793. 793. 793. -.163**. .067. -.037. -.004. .018. 1. .053. Sig. (2-tailed). .000. .059. .293. .921. .605. N. 793. 792. 793. 792. 793. 793. 793. -.007. .064. -.103**. .061. .095**. .053. 1. bottles recycled in Mongolia Sig. (2-tailed). .844. .072. .004. .087. .007. .133. and Japan?. 793. 792. 793. 792. 793. 793. Have you ever used recycled Pearson Correlation plastic product?. Is there any difference between Pearson Correlation. N. **. Correlation is significant at the 0.01 level (2-tailed). *. Correlation is significant at the 0.05 level (2-tailed).. 40. .133. 793.
(51) 4.5 Information effect on customer attitude SQR 2.1 How much does information influence on a customer attitude? Information effect calculation: It is a variation between the first and second attitude scores. For example: if a respondent scored “5” and received information, then the respondent fills out “3”, changed points are “2” (figure 4-8).. Figure 4-7: Information-effect point The following table 4-19 displays the numbers of respondents who changed their first attitude and total changed points. The respondents who filled “0” and “-5” changed their attitude the most. It might depend on the respondent frequency. The largest number of respondents filled those points before the information (table 4-18). Therefore, it is possible that many more respondents than the others change their attitude in those categories. In a case of RPR, the correlation appeared as well. Most of RPR who changed their attitude filled “1”. the “1” is the point which RPR scored the most before the information as well. Overall, the news pieces could affect respondents who had any attitude. Table 4-16: Total points of the attitude change in each part of the interval. First attitude. Respondent. Total changed points. 5. 12. 60. 4. 9. 42. 3. 15. 51. 2. 12. 48. 1. 19. 84. 0. 137. 417 44.
(52) -1. 12. 44. -2. 6. 28. -3. 26. 99. -4. 15. 52. -5. 45. 253. The below table 4-20 shows the numbers of respondents who changed their attitude and choice. if respondents scored their first attitude on the side of a recycled bottle (figure 4-8) and changed it to the new bottle (or this action is opposite), it refers that the respondents changed their choice. As for calculation, logically, respondents who changed their choice must be included in the number of ones who changed their attitude. However, there were 31 respondents who changed their choice, but not included in the ones. A reason was that some respondents answered “both” and changed it to “None of them”. In this case, although those respondents changed their choice, they had no attitude points. Hence, the 31 respondents had no attitude change and thus were not included in the number. Table 4-17: Respondents who changed their attitude and choice.. Total. Customer. Respondents - changed attitude. Respondents - changed a choice. 793. 308. 286. 45.
図
![Figure 2-1. A general structural framework for analyzing decision-making [32].](https://thumb-ap.123doks.com/thumbv2/123deta/6092542.1075450/17.892.127.753.182.567/figure-general-structural-framework-analyzing-decision-making.webp)
![Figure 2-3. The range of information definitions divided into different parts [52]](https://thumb-ap.123doks.com/thumbv2/123deta/6092542.1075450/21.892.117.476.170.577/figure-range-information-definitions-divided-different-parts.webp)
+7


Outline
関連したドキュメント
We construct a Lax pair for the E 6 (1) q-Painlev´ e system from first principles by employing the general theory of semi-classical orthogonal polynomial systems characterised
Standard domino tableaux have already been considered by many authors [33], [6], [34], [8], [1], but, to the best of our knowledge, the expression of the
Based on Table 16, the top 5 key criteria of the Homestay B customer group are safety e.g., lodger insurance and room safety, service attitude e.g., reception service, to treat
An example of a database state in the lextensive category of finite sets, for the EA sketch of our school data specification is provided by any database which models the
Eskandani, “Stability of a mixed additive and cubic functional equation in quasi- Banach spaces,” Journal of Mathematical Analysis and Applications, vol.. Eshaghi Gordji, “Stability
The inclusion of the cell shedding mechanism leads to modification of the boundary conditions employed in the model of Ward and King (199910) and it will be
The system evolves from its initial state without being further affected by diffusion until the next pulse appears; Δx i x i nτ − x i nτ, and x i nτ represents the density
13 proposed a hybrid multiobjective evolutionary algorithm HMOEA that incorporates various heuristics for local exploitation in the evolutionary search and the concept of
