JAIST Repository: ポリプロピレン系ブレンドの力学的性質への高次構造の影響
7
0
0
全文
(2) Effects. of. super-order. molecular. structure. of. polypropylene. component on mechanical properties for polypropylene/polyethylene blends and polypropylene/polystyrene blends Kenzo Takebayashi. Introduction Polypropylene is most-used commodity resin has inherent characteristics, such as low specific and good moldability. However, homo polypropylene is difficult to satisfy the various demands. Therefore, polypropylene needs to be compounded with other materials e.g. polymer and inorganic filler. These multicomponent polymer blends show complicated behavior. Hence, it is important to obtain knowledge for binary blends with the purpose of guidelines for materials design of PP based blends.. Blends samples Raw Materials PP used in this study is the product of Japan Polypropylene Co. Ltd, with molecular weight of MW = 26 x 104. Two grade of HDPE with molecular weight of MW = 10 x 104, 5.2 x 10⁴, was from Tosoh Co. Ltd. sPS resin manufactured by Idemitsu Kosan Co. Ltd, Japan was used in this study. The weight average molecular weight, determined by GPC, is 19.7 x 10⁴. PP/HDPE Blends preparation Blends of different compositions of PP and HDPE were prepared by melt mixing in a 60ml batch Plastomill at 473 K and 30 rpm for 3 min. After mixing, the samples were compression molded into sheets with a hydraulic press at 503 K and 10 MPa pressure for 5min and cooled to 373 K or 195 K. Various measurements specimens were cut from the molded sheets. PP/sPS Blends preparation Blends of different compositions of PP and sPS were prepared by melt mixing in a 60ml batch Plastomill at 553 K and 60 rpm for 5 min. The blends were stabilized with 1.
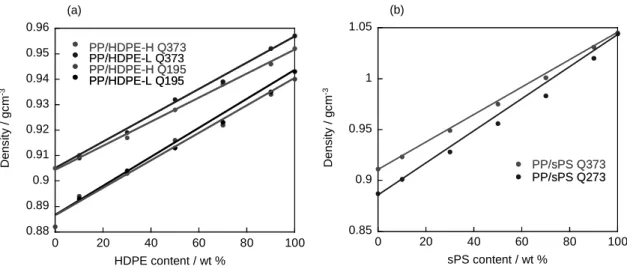
(3) 0.5 wt% antioxidants 1010 and 168. After mixing, the samples were compression molded into sheets with a hydraulic press at 563 K and 10 MPa pressure for 5min and cooled to 373 K or 273 K. Various measurements specimens were punched out from the molded sheets.. Polymer characterization Density measurement Density of samples was measured by balance. In Fig.1(a) and (b), the density of various blends is plotted against the weight percentage of HDPE and sPS. The solid line in this figure represents values obtained with the assumption that the volume of a blend is the sum of the volumes of the two components. The experimental values coincide fairly well with the estimates ones. However, only Pure PP’s density with quench temperature at 195 K didn’t coincide the calculated value. Pure PP having Low-density denotes to form the mesomorphic phase. (b). (a) 1.05. 0.96 PP/HDPE-H Q373 PP/HDPE-L Q373 PP/HDPE-H Q195 PP/HDPE-L Q195. 0.95. 1 Density / gcm-3. Density / gcm-3. 0.94 0.93 0.92 0.91. 0.95 PP/sPS Q373 PP/sPS Q273. 0.9. 0.9 0.89. 0.85. 0.88 0. 20. 40. 60. 80. 0. 100. 20. 40. 60. 80. 100. sPS content / wt %. HDPE content / wt %. Fig. 1 The dependence of density at 293K for (a)PP/HDPE blends on HDPE content and (b) PP/sPS blends on sPS content. Result of density measurement coincide with both crystal condition was examined by wide angle X-ray diffraction and degrees of crystallinity calculated by differential scanning calorimetry.. Measurements Mechanical properties of PP/HDPE blends 2.
(4) Stress-strain behavior in uniaxial tension was measured using tabletop type universal testing machine. The sample specimens were cut with a dumb-bell shape in which the gauge length is 9.53 mm. The tensile strain was calculated from the ratio of the increment of the length between clamps to the to the initial gauge length. The tensile stress was determined from dividing the tensile load by the initial cross section. Crosshead speed was 20 mm/min at 296 K. Mechanical properties of PP/sPS blends Tensile test performed at 293 K using dumb-bell specimens on tabletop type universal testing machine at a crosshead speed of 10 mm/min. Rheo-optical techniques Rheo-optical techniques afford information helpful for interpreting the stress-strain curves for crystalline polymers such as polypropylene and high density of polyethylene. When this technique is applied to blends composed of different component, it is possible to determine the molecular orientation of each component from the diachronic ratios of absorption bands characteristic to each component. In this study, infrared diachronic ratios were measured simultaneously with stress and strain during stretching the film specimen at a constant rate of elongate. Tensile test was measured at 293 K and at a crosshead speed of 1 mm/min. To determine the orientation function of molecular chains and crystal axis, we used the diachronic ratios D which can be determine by A///A┴ where A// and A┴ denote the area absorbencies measured for the radiation whole electric vectors are parallel and perpendicular to the stretching direction, respectively. The Hermans orientation function of molecular chain (or crystal axis) F is related to the diachronic ratio by equation F=. 2 2. 3 cos θ. •. D −1 D −1 = c• D+2 D+2. (1). where θ represents the angle between the stretching direction and helix chain axis for polypropylene. In this work, the crystalline orientation functions have been determined for 841 and 998 cm-1 absorption bands.. 3.
(5) Result and Discussion Fig. 2 (a) and (b) show that dependence of Young’s modulus (a) on HDPE content for PP/HDPE blends and (b) on sPS content for PP/sPS blends. HDPE-H and HDPE-L indicate high molecular weight of HDPE and low molecular weight of HDPE. (b) 800. 450. 700. Young’s Modulus / MPa. Young’s Modulus / MPa. (a) 500. 400 350 300 250 PP/HDPE-H Q373 PP/HDPE-H Q195 PP/HDPE-L Q373 PP/HDPE-L Q195. 200 150. 600 500 400 300 PP/sPS Q373 PP/sPS Q273. 200. 100. 100 0. 20. 40. 60. 80. 0. 100. 20. 40. 60. 80. 100. sPS content / wt %. HDPE content / wt %. Fig.2 Dependent of Young’s modulus (a) on HDPE content for PP/HDPE blends and (b) on sPS content for PP/sPS blends. As shown in Fig. 2 (a) and (b), Young’s modulus of PP/HDPE blends and PP/sPS blends depends on quench temperature. This is thought to be aftereffects of super-order structure and degrees of crystallinity. Additionally, phase separation structure for HDPE and sPS content effect on Young’s modulus. Fig. 3 (a) and (b) show that dependence of Toughness (a) on HDPE content for PP/HDPE blends and (b) on sPS content for PP/sPS blends. (b). (a) 600. 800 PP/HDPE-H Q373 PP/HDPE-H Q195 PP/HDPE-L Q373 PP/HDPE-L Q195. Toughness / MPa. 600. 500 Toughness / MPa. 700. 500 400 300 200. PP/sPS Q373 PP/sPS Q273. 300 200 100. 100 0. 400. 0. 20. 40. 60. 80. 0. 100. 0. HDPE content / wt %. 20. 40. 60. 80. 100. sPS content / wt %. Fig.3 Dependent of Toughness (a) on HDPE content for PP/HDPE blends and (b) on sPS content for PP/sPS blends. As shown in Fig. 3 (a) and (b), Toughness for blends based PP matrix of quench 4.
(6) temperature at 195 K or 273 K was found higher than blends sample of quench temperature at 373 K. Then regardless of HDPE molecular weight, Toughness depends solely on quench temperature. But Toughness for blends based HDPE matrix was influenced by molecular weight of HDPE. This is thought to be aftereffects of dispersion state depending on the polymer matrix. Fig. 4 (a) and (b) shows that orientation function for c crystallographic axis of polypropylene components for (a) PP/HDPE-H blends and (b) PP/sPS blends plotted against strain. (b). (a). 1. Orientation Function. Orientation Function. 1. 0.5. 0. -0.5. PP Q195 PP/HDPE-H 10 wt% Q195 PP/HDPE-H 30 wt% Q195 PP/HDPE-H 50 wt% Q195. 0. 2. 4. 6. 0.5. 0 PP Q273 PP/sPS 10 wt% Q273 PP/sPS 30 wt% Q273. -0.5. 8. 0. Strain. 2. 4. 6. 8. Strain. Fig.4 Orientation function for c crystallographic axis of polypropylene components for (a) PP/HDPE-H blends and (b) PP/sPS blends plotted against strain. As shown in Fig. 4 (a), only PP/HDPE-H blend 50 wt% sample has different behavior of orientation function. This is thought to be aftereffects of inhibition by phase separation structure. In the case of Fig.4 (b), orientation function for c crystallographic axis of polypropylene components inhibition by addition of sPS. For this reason, PP matrix needs greater stress in order that stress concentration as comparing with homo PP.. Conclusion Young’s modulus depends on degrees of crystallinity. Toughness of PP based blends change with higher-order structure and amount of blending polymer with polypropylene. Orientation function for c crystallographic axis of polypropylene components is influenced by phase separation structure, dispersed domain size and 5.
(7) modulus of elasticity for additive polymer. In this study, guidelines for materials design of PP based blends were obtained by these knowledge to effect of super-order molecular structure of polypropylene component on mechanical properties for PP based blends.. References [1] 高分子学会 編:“高分子機能材料シリーズ 3 高分子物性の基礎”, 共立出 版, 1993 [2] Onogi, S., T. Asada, “Progress in Polymer Science, Japan”, M. Imoto and S. Onogi ed., Tokyo (1971) 261-378. 6.
(8)
図
関連したドキュメント
積極性 協調性 コミュニケーション力 論理的思考力 発想力 その他. (C) Recruit
$R\epsilon conn\epsilon\iota ti0n$ and the road to $turbul\epsilon nce---30$. National $G\epsilon nt\epsilon
次世代電力NW への 転換 再エネの大量導入を支える 次世代電力NWの構築 発電コスト
0.1. Additive Galois modules and especially the ring of integers of local fields are considered from different viewpoints. Leopoldt [L] the ring of integers is studied as a module
分類記号 構 造 形 式 断面図 背面土のタイプ.. GW-B コンクリートブロック重力式
A seed treatment product for protection against Pythium and Phytophthora causing damping-off, seed rot, and systemic downy mildew diseases of certain crops..
汚染水の構外への漏えいおよび漏えいの可能性が ある場合・湯気によるモニタリングポストへの影
(近隣の建物等の扱い) (算定ガイドライン
