and Hong Kong Stock Market---Based on Realized
Volatility
著者
XUE XIAOYAN
学位授与機関
Tohoku University
学位授与番号
11301甲第17834号
URL
http://hdl.handle.net/10097/00122546
A Comparison Study on Shanghai Stock Market and
Hong Kong Stock Market---Based on
Realized Volatility
Xue Xiaoyan
Graduate School of Economics and Management
Tohoku University Japan
March-2018
A Comparison Study on Shanghai Stock Market and
Hong Kong Stock Market---Based on
Realized Volatility
Xue Xiaoyan
Graduate School of Economics and Management
Tohoku University
Abstract ... 1
1. Introduction ... 2
2. Realized volatility ... 5
2.1 Simple Realized Volatility ... 7
2.2 Normalized Simple Realized Volatility ... 10
2.3 5-Minutes Realized Volatility ... 13
2.4 Normalized 5-Minutes Realized Volatility ... 16
2.5 15 minutes realized volatility ... 19
2.6 Normalized 15 minutes realized volatility ... 22
2.7 Optimal Sampling Frequency Realized Volatility ... 25
2.8 Normalized Optimal Sampling Frequency Realized Volatility ... 29
2.9 Summary of 4 realized volatility estimators ... 33
3. Dose Any Other Factors Drive Volatility ... 36
3.1 Relationships among Stock Markets ... 36
3.2 Transactions ... 38
3.3 Noise ... 42
3.4 Relation between Realized Volatility and Transaction ... 44
3.5 Relation between Realized Volatility and Microstructure Noise ... 45
4. The Efficiency of Realized Volatility Estimators ... 47
4.1 Evaluation theory ... 47
4.1.1 Mincer-Zarnowitz test ... 47
4.1.2 The model confidence set ... 47
4.2 The efficiency of realized volatility estimators ... 49
4.3 HAR model ... 55
4.3.1 In-the-sample regression of HAR model ... 55
4.3.2 The order of HAR model ... 60
4.3.3 HAR model forecasting evaluation measures ... 61
5 Conclusion ... 63
References ... 65
A Comparison Study on Shanghai Stock Market and
Hong Kong Stock Market---Based on Realized Volatility
Abstract
Volatility is playing a more and more important role in modern financial market. Various methods are taken to find a perfect trade-off between accuracy and potential biases. By using the high-frequency data of all stocks listed on Shanghai stock market and Hong Kong stock market, we gain a deep insight over two markets. We analyze 4 different realized volatility estimators annually, and find the difference of investors and market structure. We evaluate 4 realized volatility estimators by Mincer Zardoff and Model Confidence Set. We use HAR-RV model to compare the different role of different investors in 2 markets.
Our results are different from current researches, that the optimal sampling frequency realized volatility estimator which minimizes Mean-Squared-Error lose its robustness. In addition, we also find the close relation between microstructure noise and efficient volatility estimators.
Key words: Realized volatility; Microstructure noise; Shanghai Stock market; Hong
1. Introduction
Under the background of the rapid development in financial markets and the incredible change of new and complex financial instruments, there is an ever growing need for theoretical and empirical knowledge of the volatility in financial time series. Therefore, it is not surprising that modeling financial volatility plays a significant role in risk management. However, the conditional volatility is latent, and not observable. The motivation to model financial volatility more directly leads the analysis of high-frequency data. In 1980, Merton stated that the deviation can be estimated by the sum of squared return, if high frequency data is available. Given the presence of microstructure noise, the straight-forward sum of squared return will cause an ultimate bias. The source of microstructure is far from conclusive, while from now on, it is believed to be a deviation from fundamental value that is induced by characteristic of the market, e.g. bid-ask bounce, the discreteness of price change and asymmetric information.
To get rid of contamination of microstructure noise, several methods are taken application. The most widely used sampling scheme is calendar time sampling, where the interval is equal. The common sampling intervals are 5 minutes and 15 minutes. Barndorf Nielson (2008) provided details of how implement realized kernels in practice and stated that realized kernels is unbiased. Lily Liu and Patton (2015) stated that other realized volatility estimators cannot beat 5 minutes realized volatility estimator significantly by analyzing 5 securities in the U.S. and the U.K. In the mean time, Patton stated that 15 minutes realized volatility estimator outperforms over other estimators. Bandi and Russel (2003) derived an expression for the conditional mean-squared-error of the contaminated realized volatility estimator as a function of the sampling frequency and provided a robust methodology to optimally choose the sampling frequency with the minimum of the conditional MSE. In 2006, Bandi and Russel used MSE estimators to evaluate the optimal sampling frequency though a straightforward minimization problem.
different estimators. Mincer and Zarnowitz(1965) evaluated the accuracy of forecast based on regression analysis. Hansen (2011) argued that regression-based evaluation method does not penalized outliers and introduced the Model Confidence Set (MCS) to evaluate estimators. The MCS method is a set of models that is constructed such that it will contain the best model with a given level of confidence.
There are numerous researches on the volatility of Shanghai stock market and Hong Kong stock market, but most researches are dependent on daily data. Chen Qing (2014) stated that investors’ overconfidence can explain the excess volatility on the market, even so he analyzed the daily data, making the result less reliable. Zhai (2010) stated the effect on volatility produced by investors’ preference. Likewise, Lu (2014) analyzed the AR effect of volatility on Shanghai market in different periods. All researchers focus on daily return of stock and regard the return deviation as volatility. Those academic studies lead to neglecting of market information.
Many researches can be found study on the spillover effect between Shanghai and market exists. Most of them are lacking in arbitrage chance because of financial regulation of China mainland market makes the spillover effect meaningless. Nishimura (2008) supported the long time consistent relation between Shanghai stock market and Hong Kong stock market, while the market separation makes arbitrage impossible between two markets. Hence, it is more reasonable to understand the difference of two markets to find the different markets’ reflection to economy. A lot of models try to describe the evolution of volatility, such as GARCH family models. Corsi (2012) took a simple model to explain the clustering slowly decaying autocorrelation and giving non-linear responses to previous market information. The cascade of heterogeneous volatility components leads to a simple AR-type model in the realized volatility that considers volatilities realized over different time horizons. The simple AR-type model is called Heterogeneous Auto-regressive (HAR).
The paper proceeds as follows. In Section 2, we layout 4 different realized volatility estimators. Since market keeps changing, we summarize estimators from year to year, enabling us see the evolution of market volatility. We do not only analyze realized volatility, but also analyze the volatility of volatility, skewness of volatility, kurtosis of
volatility to help us understand the difference of investors’ behaviors from different markets and the behavior difference among investors in the same market. This difference implies difference of investors’ preference and investor structure. In Section 3, we analyze the relation among Shanghai stock market, Hong Kong stock market, Nikkei stock market and S&P stock market. We also check the relation between daily ticks, noise and different realized volatility estimators. As a result, We find a close relationship between noise and realized volatility, but daily tick count is not related with volatility estimator realized volatility at all. In Section 4, we evaluate realized volatility estimators by Model Confidence Set. Section 5 use HAR model, MAE and RMSE method to test which realized volatility estimator is more reliable to do forecasting work. We calculate all the stocks continuously traded from Jan. 2008 to Dec. 2014 listed on Shanghai stock market and Hong Kong stock market. We eliminate the stocks without 20 transactions daily, because stocks with low liquidity causes calculating difficulties for realized volatility estimators. In this paper, we use 680 stocks from Shanghai market and 256 stocks from Hong Kong market. The data of stocks in Shanghai market is collected from WIND database which is a sub-database of Bloomberg, and the data of stocks in Hong Kong market is collected from Hong Kong Stock Exchange.
2. Realized volatility
Volatility is an important indicator to describe the current risk level. Unfortunately, volatility cannot be observed directly. There are 3 ways to estimate volatility. The first method is implied volatility, which is derived from option price. The second method is taking advantage of volatility models such as GARCH and SV. The third method is realized volatility based on the frequency data. With the availability of high-frequency data, more researchers have been inspired on the estimation of realized volatility. !",$ = !",$ + '",$, ) = 1,2,3 … . . , / 1 0",$ = 0",$ + 1",$ (2) Where 0",$ = !",$45− !",$. (3) 1".$ = '",$45− '",$ (4) The definition of Realized Volatility is:
89"= 0",$: ;
$<5
(5)
Where !",$ is the ith observed price on day t, !",$ is the ith efficient price on day
t, '",$ denotes microstructure noise. 0",$ and 1",$ have straightforward interpretations in terms of equilibrium return and microstructure contamination in the return data respectively.
The first realized volatility estimator is a simple method, by which all intraday returns are taken into account. This estimator includes all the information in the market. It is correct if there is no microstructure noise in the market.
Considering microstructure noise, there are several alternatives to revise the estimation of realized volatility. Microstructure noise is caused by discreteness of the price and the properties of the reading mechanism. The simple estimator of realized volatility losses its validity because infinite accumulation of squared return means infinite accumulation of noise. Higher frequency means more information and higher
bias. Thus we have to consider the trade-off between the information contained by the estimator and the bias caused by microstructure noise.
The second realized volatility estimator is the 5-minutes realized volatility. It calculates intraday return per 5 minutes. In Shanghai market, the trading time is starts from 9:30 to 11:30 and 13:00 to 15:00. In Hong Kong market, the trading time is from 9:30 to 12:00, and 13:00 to 15:00. That means there are 48 5-minutes intraday returns each day in Shanghai market, and 54 5-minutes intraday returns each day in Hong Kong market. 89">?$@ = 0 ",$: ;ABCDE $<5 (6)
Where />?$@G=48 in Shanghai market, />?$@G=54 in Hong Kong market.
The third realized volatility estimator is the 15-minutes realized volatility. Intraday returns are calculated per 15 minutes. In Shanghai market, there are 16 15-minutes intraday returns during day-time. In Hong Kong market, there are 18 15-minutes intraday returns during day-time.
89"5>?$@ = 0 ",$: ;HABCDE $<5 (7)
Where /5>?$@G=16 in Shanghai market, /5>?$@G=18 in Hong Kong market.
The fourth realized volatility estimator is entitled optimal-sampling realized volatility. The optimal sampling frequency is chosen as the value of
J"∗ = 1 /"∗ (8) With /"∗ = (M" N)5/P (9) Where N = ( 0",R : ; $<5 @ "<5 S) ): (10) and
M" =/5>?$@G
3 0",$U
;HABCDE
$<5
(11)
2.1 Simple Realized Volatility
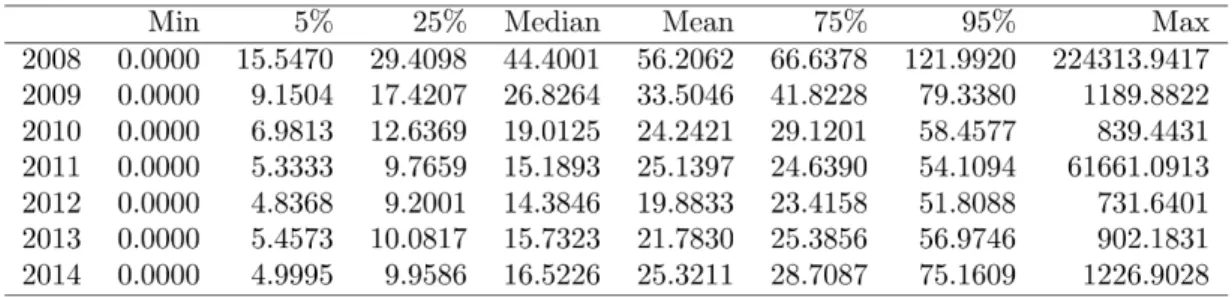
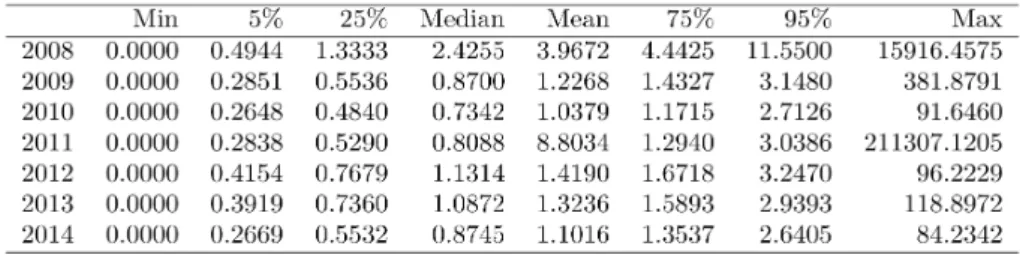
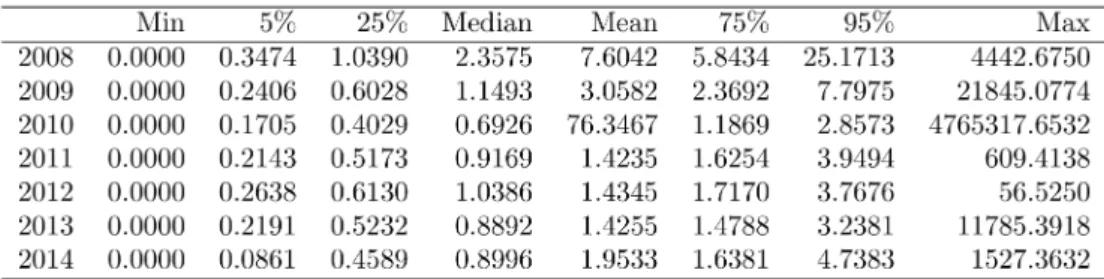
In table 1a and table 2a, we can find that, first, the minimum realized volatility estimators is 0, meaning there is no price change in a trading day. However, the meanings of no price change are different in two markets. In Shanghai stock Market, since 10% daily price limit, there are 2 meanings for 0 intraday volatility: one means the true volatility is 0, the other means the true volatility is more than 10%. In most cases, the second explain is the truth. In Hong Kong market, there is no price limit mechanism. Thus 0 volatility means low liquidity and small price change. Secondly, the average realized volatility of Hong Kong market is larger than that of Shanghai market from 2009 to 2013. However, the median volatility of Shanghai market is larger than that of Hong Kong market. That means there are more extremely large volatility in Hong Kong market. In another word, Hong Kong market is more right-tailed than Shanghai market is. Thirdly, we can also see that the max realized volatility in Hong Kong market is larger than that in Shanghai market. That is not a surprising result because of no price limit mechanism, price change larger than 10% is allowed in Hong Kong market.
Table 2a: Simple Realized Volatility of Hong Kong Market*10000
Table 1a and Table 2a are the summary of simple realized volatility estimator of two markets. For All the stocks we use quotes posted on two exchanges, Shanghai and Hong Kong. The data of Shanghai comes from the WIND database. The data of Hong Kong coms from Hong Kong Stock Exchange.
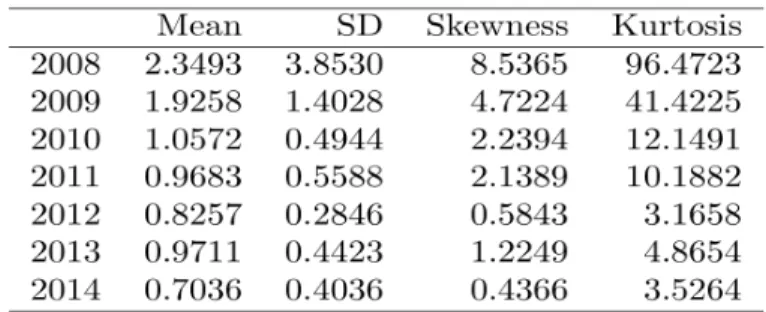
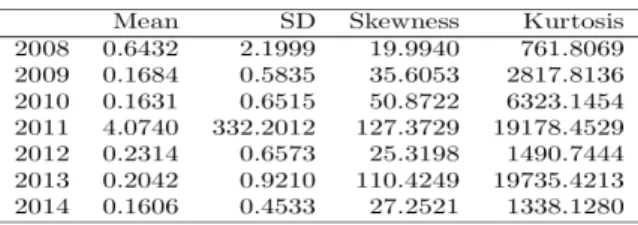
Table 1b: Simple Realized Volatility of Shanghai Market*10000
Table 2b: Simple Realized Volatility of Hong Kong Market*10000
Table 1b and Table 2b represent the Mean, Standard Deviation, skewness and kurtosis of simple realized volatility estimator. For All the stocks we use quotes posted on two exchanges, Shanghai and Hong Kong. The data of Shanghai comes from the WIND database. The data of Hong Kong coms from Hong Kong Stock Exchange.
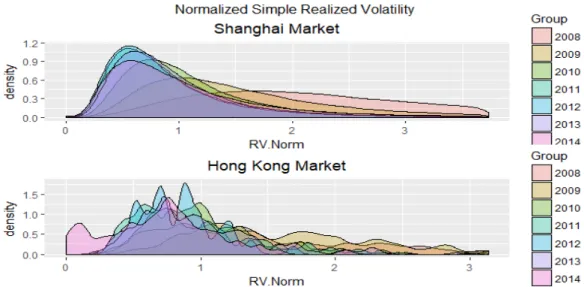
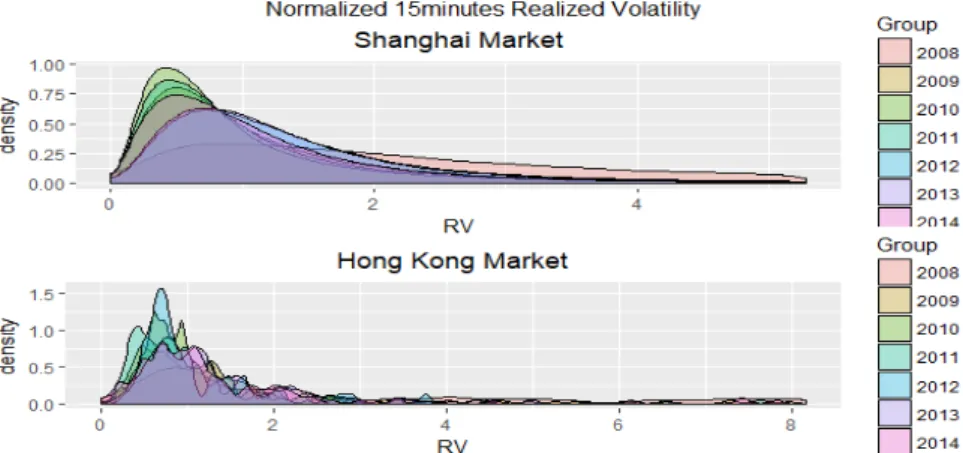
Fig. 1. Annual density of the simple realized volatility estimator of all stock listed on Shanghai and Hong Kong market. The figure shows the density of the simple realized volatility estimator from Jan. 2008 to Dec. 2014. For All the stocks we use quotes posted on two exchanges, Shanghai and Hong Kong. The
data of Shanghai comes from the WIND database. The data of Hong Kong comes from Hong Kong Stock Exchange.
Fig. 2. Annual density of the simple realized volatility estimator of all stock listed on Shanghai and Hong Kong market. The figure shows the density of the simple realized volatility estimator from Jan. 2008 to Dec. 2014. For All the stocks we use quotes posted on two exchanges, Shanghai and Hong Kong. The data of Shanghai comes from the WIND database. The data of Hong Kong comes from Hong Kong Stock Exchange.
Figure 1 and Figure 2 show the density of annual simple realized volatility. We can see the density is getting sharp from 2008 to 2014 in both markets, which means that the risk level is getting lower. From 2012 to 2014, the risk level of Hong Kong market keeps changing, while, it does not change in Shanghai market. In 2008, both markets have the highest risk level. From Fig. 2, we can see that almost 1/3 data of simple realized volatility is greater than 0.05 in Shanghai market. To summarize all densities above, there are more extreme volatility in Hong Kong market, but in Shanghai market there are more large volatility in Shanghai market contrary to Hong Kong market.
2.2 Normalized Simple Realized Volatility
Table 3a: Normalized Simple Realized Volatility of Shanghai Market
Table 4a: Normalized Simple Realized Volatility of Hong Kong Market
Table 3a and Table 4a are the summary of daily normalized simple realized volatility estimator. The simple realized volatility estimator is normalized by the median value. For All the stocks we use quotes posted on two exchanges, Shanghai and Hong Kong. The data of Shanghai comes from the WIND database. The data of Hong Kong coms from Hong Kong Stock Exchange.
Table 4b: Normalized Simple Realized Volatility of Hong Kong Market
Table 3b and Table 4b represent the Mean, Standard Deviation, skewness and kurtosis of simple realized volatility estimator. The simple realized volatility estimator is normalized by the median value. For All the stocks we use quotes posted on two exchanges, Shanghai and Hong Kong. The data of Shanghai comes from the WIND database. The data of Hong Kong coms from Hong Kong Stock Exchange.
Fig.3. Annual density of the normalized simple realized volatility estimator of all stock listed on Shanghai and Hong Kong market. The figure shows the density of the normalized simple realized volatility estimator from Jan. 2008 to Dec. 2014. For All the stocks we use quotes posted on two exchanges, Shanghai and Hong Kong. The data of Shanghai comes from the WIND database. The data of Hong Kong comes from Hong Kong Stock Exchange.
Fig. 4. Annual density of normalized simple realized volatility estimator of all stock listed on Shanghai and Hong Kong market. The figure shows the density of normalized simple realized volatility estimator from Jan. 2008 to Dec. 2014. For All the stocks we use quotes posted on two exchanges, Shanghai and Hong Kong. The data of Shanghai comes from the WIND database. The data of Hong Kong comes from Hong Kong Stock Exchange.
In order to compare the volatilities of two markets, we normalize the realized volatility estimator by dividing the median value.
Figure 3 and figure 4 can be interpreted as follows: In Shanghai market, realized volatility decreases from 2008 to 2011 and increases from 2011 to 2014. The mean value of simple realized volatility estimator in 2008 is the largest and the standard deviation is also the largest. Those data reveals that the investors’ behaviors in 2008 were different from other years. At the same time, we can find the largest difference of investors’ behaviors between two markets in 2008.
The volatility in 2011 is not as large as that in 2008 and 2009. However, the standard deviation of realized volatility is almost same with that in 2008. It means that in 2011, different investors have largely different attitudes toward the market. Moreover, table 3b and table 4b also show the large number of skewness and kurtosis in 2008 and 2010. The pattern of realized volatility of Shanghai market is different from that of Hong Kong market from 2008 to 2014. Table 3b and table 4b show that the mean, standard deviation, skewness and kurtosis keep decreasing from 2008 to 2014. The only exception is 2013. The reasons of this phenomenon are as follows: S&P index increased 30% and Nikkei 225 increased 57%. However, result from US Federal Reserve stated tapering QE stimulus programmed on June 19, 2013. As a result, Hong Kong market has to face uncertain monetary policy. Another fact is that, in 2013 red chip (Chinese market listed on Hong Kong market) decreased 5%, but Hang Seng index increased 3%. The uncertainty makes different investors have different expectation over Hong Kong market.
From the comparison, we can see the difference between Shanghai market and Hong Kong market in volatility.
1) From the mean value, the volatility is smaller in Hong Kong market than that in Shanghai market. In Shanghai market, only the realized volatility in 2012 is smaller than 1. As we normalize realized volatility by dividing the median value of simple realized volatility estimator, we can find Shanghai market exists more extreme value. In Hong Kong stock market, the mean value is larger than 1 before 2010 and less than 1 from 2011. It means that there are fewer extreme values in Hong Kong market.
deviation in Shanghai market is as large as 25.64 and the second largest is 25.47. On the contrary, the largest standard deviation is 3.85 and the second largest is 1.40 in Hong Kong market. Therefore, it can be inferred that there are limited extreme simple realized volatility estimator in Hong Kong market and the investors in Hong Kong have more similar attitudes towards stock market. 3) The skewness and kurtosis of Shanghai market is much larger than that of Hong
Kong market. Especially, the skewness of Shanghai market in 2008 and 2011 is as large as 287.00 and 166.94, revealing that the simple realized volatility in Shanghai market is seriously right-skewed. The kurtosis of Shanghai market is also larger than that of Hong Kong market. In 2012 and 2014, we can see the volatility in Hong Kong market is almost normally distributed: the skewness is almost equal to 0, and kurtosis is 3.
4) From summary of the data, we can draw the conclusion that the simple realized volatility in Shanghai market is larger than than in Hong Kong market. Depending on the daily return analysis in Section 3, we know that Hong Kong market is close related with both Shanghai market and S&P and Shanghai market is not related with S&P consistently. By the analysis of simple relation, we can find the support that Shanghai market is more domestic and dependent from global market.
2.3 5-Minutes Realized Volatility
As we can see, 5 minutes realized volatility estimator of Hong Kong market is larger than that of Shanghai market. The smallest volatility of two markets tends to 0. Whereas as stated in last subsector, 0 volatility does not only mean low liquidity but also means limit price change in Shanghai market. Therefore, the data of 5 minutes realized volatility is as follows: the median volatility Hong Kong market is twice as large as that of Shanghai market and the average volatility of Hong Kong market is three times as large as that of Shanghai market. While the maximum volatility is almost the same, even though volatility of Hong Kong market is a little larger.
of Shanghai market. The sampling interval is constant, as a result, the larger volatility means larger price change in every tick. Furthermore, there are reasons for this phenomenon: First, price change is undervalued because of price limit. Second, the price change of per tick is large because the institution investors are more patient to wait for transactions.
Table 5a: 5 minutes Realized Volatility of Shanghai Market
Table. 5a. is the sample of Shanghai Market stocks covers the year 2008 to 2014. For All the stocks we use quotes posted on two exchanges, Shanghai and Hong Kong. The data of Shanghai comes from the WIND database.
Table 6a: 5 minutes Realized Volatility of Hong Kong Market
Table. 6a. is the sample of Hong Kong Market stocks covers the year 2008 to 2014. For All the stocks we use quotes posted on two exchanges Shanghai and Hong Kong. The data of Hong Kong comes from Hong Kong Stock Exchange.
Table 6b: 5 minutes Realized Volatility of Hong Kong Market*10000
Table 5b and Table 6b represent the Mean, Standard Deviation, skewness and kurtosis of 5 minutes realized volatility estimator. The 5 minutes realized volatility is normalized by the median value. For All the stocks we use quotes posted on two exchanges, Shanghai and Hong Kong. The data of Shanghai comes from the WIND database. The data of Hong Kong comes from Hong Kong Stock Exchange.
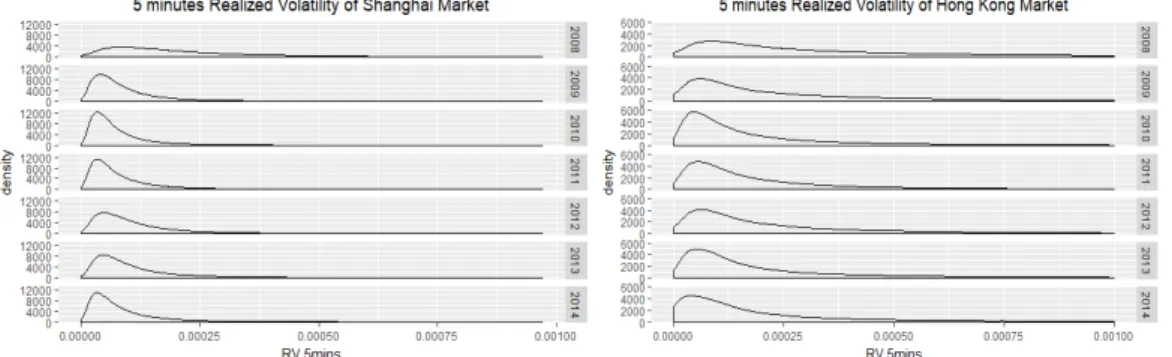
Fig. 5. Annual density of 5 minutes realized volatility estimator of all stock listed on Shanghai and Hong Kong market. The figure shows the density of 5 minutes realized volatility estimator from Jan. 2008 to Dec. 2014. For All the stocks we use quotes posted on two exchanges, Shanghai and Hong Kong. The data of Shanghai comes from the WIND database. The data of Hong Kong comes from Hong Kong Stock Exchange.
Fig. 6. Annual density of 5minutes realized volatility estimator of all stock listed on Shanghai and Hong Kong market. The figure shows the density of 5 minutes realized volatility estimator from Jan. 2008 to
Dec. 2014. For All the stocks we use quotes posted on two exchanges, Shanghai and Hong Kong. The data of Shanghai comes from the WIND database. The data of Hong Kong coms from Hong Kong Stock Exchange.
It can be seen from the figure 5 and figure 6 that the volatility of stock is very large in 2008 because of the global financial crisis of 2007–2008. We know that the density of volatility of Shanghai market is more flatten in 2008. In other words, Shanghai market is more volatile in 2008 than Hong Kong market is.
Financial crisis in 2008 began in America and then spread among international finance markets. Depending on previous researches, Shanghai market is more independent from U.S. market than Hong Kong market, which is averse to our data. This is because private investors are more sensitive to risk and more rational when new information comes.
The second most volatile year in Shanghai market is 2013. In 2008, China government took QE policy (Quantitative Easing Policy) as much as 4000 billion Yuan, causing a 4 years’ buoyant market. In June and December 2013, money supply shortage happened twice in China market. China government started to stimulate the economy in the end of 2014, causing the brisk market in 2015.
On the contrary, the second volatile year in Hong Kong market is 2009. In 2009, international stock market was still recovering from finance crisis of 2007. Hong Kong market is more dependent on international market and gets less support from government than Shanghai market.
2.4 Normalized 5-Minutes Realized Volatility
After data normalization by median value of realized volatility estimator, various patterns can be seen in the 2 markets.
Table 7a: Normalized 5 minutes Realized Volatility of Hong Kong Market
Table 8a: Normalized 5 minutes Realized Volatility of Shanghai Market
Table 7a and Table 8a are the summary of normalized 5 minutes realized volatility estimator. The normalized 5 minutes realized volatility is normalized by the median value. For All the stocks we use quotes posted on two exchanges, Shanghai and Hong Kong. The data of Shanghai comes from the WIND database. The data of Hong Kong comes from Hong Kong Stock Exchange.
Table 7b: Normalized 5 minutes Realized Volatility of Shanghai Market
Table 8b: Normalized 5 minutes Realized Volatility of Hong Kong Market
Table 7b and Table 8b represent the Mean, Standard Deviation, skewness and kurtosis of normalized 5 minutes realized volatility estimator. The normalized 5 minutes realized volatility is normalized by the median value. For All the stocks we use quotes posted on two exchanges, Shanghai and Hong Kong. The data of Shanghai comes from the WIND database. The data of Hong Kong comes from Hong Kong Stock Exchange.
Fig. 7. Annual density of normalized 5 minutes realized volatility estimator of all stock listed on Shanghai and Hong Kong market. The figure shows the density of normalized 5 minutes realized volatility estimator from Jan. 2008 to Dec. 2014. For All the stocks we use quotes posted on two exchanges, Shanghai and Hong Kong. The data of Shanghai comes from the WIND database. The data of Hong Kong comes from Hong Kong Stock Exchange.
Fig. 8. Annual density of normalized 5 minutes realized volatility estimator of all stock listed on Shanghai and Hong Kong market. The figure shows the histogram of the density of normalized 5 minutes realized volatility estimator from Jan. 2008 to Dec. 2014. For All the stocks we use quotes posted on two exchanges, Shanghai and Hong Kong. The data of Shanghai comes from the WIND database. The data of Hong Kong comes from Hong Kong Stock Exchange.
According to table 7a to 8b, figure 7 and figure 8, the volatility of Shanghai market is smaller than that of Hong Kong market. Whereas, both markets have large volatility in 2008. Shanghai market has the second largest volatility Hong Kong market has the largest volatility. Furthermore, both markets have the smallest volatility in 2010. In 2011, Shanghai market has the largest volatility, and Hong Kong market has the second smallest volatility.
The standard deviation of Shanghai market is larger than that of Hong Kong market. In 2008, both markets have second largest standard deviation, meaning that the financial crisis in 2008 makes investors’ behaviors more variable than other years. In 2011, Shanghai market has the largest standard deviation as large as 851 which was 100 times of mean realized volatility. Hence, we can infer that the investors’ behaviors extremely vary from each other. China government tightened liquidity to ward off inflation and real estate price rose sharply. After the 4000-billion-yuan Bailout Plan after 2008. Because of liquidity crisis, Shanghai market has a -22% annual return on
2011. From the estimation of skewness and kurtosis, we can see that there are more extremely large volatility values in Shanghai market. The large standard deviation is caused by extreme values.
2.5 15 minutes realized volatility
Table 9a: 15 minutes Realized Volatility of Shanghai Market*10000
Table 10a: 15 minutes Realized Volatility of Hong Kong Market*10000
Table 9a and Table 10a are the summary of 15 minutes realized volatility estimator. The 15 minutes realized volatility is normalized by the median value. For All the stocks we use quotes posted on two exchanges, Shanghai and Hong Kong. The data of Shanghai comes from the WIND database. The data of Hong Kong comes from Hong Kong Stock Exchange.
Table 9b: 15 minutes Realized Volatility of Shanghai Market*10000
Table 10b: 15 minutes Realized Volatility of Hong Kong Market*10000
realized volatility estimator. The 15 minutes realized volatility is normalized by the median value. For All the stocks we use quotes posted on two exchanges, Shanghai and Hong Kong. The data of Shanghai comes from the WIND database. The data of Hong Kong coms from Hong Kong Stock Exchange.
Fig. 9. Annual density of 15 minutes realized volatility estimator of all stock listed on Shanghai and Hong Kong market. The figure shows the density of 15 minutes realized volatility estimator from Jan. 2008 to Dec. 2014. For All the stocks we use quotes posted on two exchanges, Shanghai and Hong Kong. The data of Shanghai comes from the WIND database. The data of Hong Kong comes from Hong Kong Stock Exchange.
Fig. 10. Annual density of 15 minutes realized volatility estimator of all stock listed on Shanghai and Hong Kong market. The figure shows the density of 15 minutes realized volatility estimator from Jan. 2008 to Dec. 2014. For All the stocks we use quotes posted on two exchanges, Shanghai and Hong Kong. The data of Shanghai comes from the WIND database. The data of Hong Kong comes from Hong Kong Stock Exchange.
In 2008, volatilities of both Shanghai market and Hong Kong market are large due to the financial crisis. The standard deviation is also large because of the uncertainty caused by the crisis. While the skewness and kurtosis of Shanghai market is not larger than other years, denoting that the large standard deviation of Shanghai in 2008 is not caused by extreme values.
In 2009, volatilities of both markets decreased, meaning that investors have recovered from the crisis more or less. The standard deviation of the volatility also decreased, from which we can infer that more investors have similar attitudes and expectation about economy. In Shanghai market, the skewness and kurtosis are increased from 12.42 and 376.73 to 26.42 and 2184 (Table 9b), meaning that there exist more extreme values in Shanghai market. In Hong Kong market, the skewness and kurtosis did not change a lot compared with 2008, meaning that Hong Kong investors have recovered from the shock.
In 2010, volatility of both markets decreased. The volatility decreased only 10% in Shanghai market and the volatility decreased 60% in Hong Kong market. In 2010, Shanghai index decreased 21.7% and Hong Kong market increased 5.3% the same as 2009 did. The deviation of volatility of Shanghai market increased from 0.5864 in 2009 to 0.6218 in 2010. Hong Kong market decreased from 0.2823 in 2009 to 0.0573 in 2010 (Table10b). The skewness of Shanghai market also increased from 26.4215 and 2184.7591 in 2009 to 44.7876 and 5242.24 in 2010, that of Hong Kong market decreased from 4.6614 and 27.966 to 3.314 in 2009 and 18.8233 in 2010.
In 2011, volatility of Shanghai market jumped to 4.2295, 14 times as large as that in 2010. The deviation of volatility of Shanghai market is 500 times as large as that in 2009. The skewness and kurtosis is 3 times and 4 times as large as those in 2010. We can see that although deviation, skewness, kurtosis are larger than those in 2010 and the volatility of Shanghai market is a little smaller than that in 2010. We can see that volatility of Shanghai market in 2011 shows large difference from other years. Even compared with 2008 when global financial crisis happens, 2011 is much more volatile in 2008. The reason is that China government tighten the liquidity in 2011, and ends QE beginning on 2008. Globally, it was believed that Federal Reserve would not end QE in short time, providing necessary liquidity for foreign institutional investors in Hong Kong market.
In 2012, volatility of Shanghai market decreased much from 2011, but a little larger than 2009. The deviation, skewness, kurtosis also dropped rapidly. After experiencing the turbulence in 2011, China government restarted QE programmed and released real
estate price control. Benefit from the economy policy of China and optimism about global economy because of the QE of Federal Reserve. Hong Kong market showed a low mean value and standard deviation of volatility, and lowest skewness and kurtosis from 2007 to 2014.
In 2013, the mean values of the volatility in Shanghai market decreased from 0.4534 to 0.4157, with the increase of standard deviation, skewness and kurtosis. In 2013, due to high interbank offered rate tight liquidity remained, but economic indicator better than 2012 cause a good optimistic economy expectation. Tight liquidity and good economy made investors confused. As a result, the extreme value in Shanghai market is larger. In Hong Kong market, the sufficient liquidity and consistent expectation for economy development help Hong Kong market’s volatility kept constant. On the other hand, the tight liquidity in China mainland market made Hong Kong market a volatility rise. We can also draw the conclusion that in the risk level of Hong Kong is higher in 2013 than that in 2012, from the rise of standard deviation, skewness, and kurtosis. In 2014, the mean value of volatility of Shanghai falls to 0.3392 and other indicators are also in low level. The low interest rate, the Belt and Road initiative and other policies make a 52.9% annual return on Shanghai market. In Hong Kong market, we can see all indicators are in high level. It is not surprising because global economy remained volatile, such as devalue of Japanese yen, new high prices of S&P and Ukraine crisis.
2.6 Normalized 15 minutes realized volatility
It becomes easier for us to do comparison study on 15 minutes realized volatility if we normalize the data.
Table 11a: Normalized Realized Volatility of Shanghai Market
Table 12a: Normalized Realized Volatility of Hong Kong Market
Table 11a and Table 12a are the summary of normalized 5 minutes realized volatility estimator. The normalized 5 minutes realized volatility is normalized by the median value. For All the stocks we use quotes posted on two exchanges, Shanghai and Hong Kong. The data of Shanghai comes from the WIND database. The data of Hong Kong comes from Hong Kong Stock Exchange.
Table 11b: Normalized Realized Volatility of Shanghai Market
Table 12b: Normalized Realized Volatility of Hong Kong Market
Table 11b and Table 12b represent the Mean, Standard Deviation, skewness and kurtosis of normalized 15 minutes realized volatility estimator. The normalized 15 minutes realized volatility is normalized by the median value. For All the stocks we use quotes posted on two exchanges, Shanghai and Hong Kong. The data of Shanghai comes from the WIND database. The data of Hong Kong comes from Hong Kong Stock Exchange.
Fig. 11. Annual density of normalized 15 minutes realized volatility estimator of all stock listed on Shanghai and Hong Kong market. The figure shows the density of normalized 15 minutes realized volatility estimator from Jan. 2008 to Dec. 2014. For All the stocks we use quotes posted on two exchanges, Shanghai and Hong Kong. The data of Shanghai comes from the WIND database. The data of Hong Kong comes from Hong Kong Stock Exchange.
Fig. 12. Annual density of normalized 15 minutes realized volatility estimator of all stock listed on Shanghai and Hong Kong market. The figure shows the density of normalized 15 minutes realized volatility estimator from Jan. 2008 to Dec. 2014. For All the stocks we use quotes posted on two exchanges, Shanghai and Hong Kong. The data of Shanghai comes from the WIND database. The data of Hong Kong comes from Hong Kong Stock Exchange.
By analyzing mean value of realized volatility, we can see different trend of Shanghai and Hong Kong market. We can find that Shanghai market has larger volatility in 2008, 2011 and 2012. Further more, Hong Kong market has larger volatility in 2009, 2010, 2013 and 2014. In Shanghai market, 2011 is most volatile and 2008 has the second largest volatility. In Hong Kong market, 2008 is the most volatile year. After the financial crisis, we can see that volatility in Shanghai keeps falling until 2010 and in 2011 jumped to extremely high level, and falling gradually, but it keeps falling to 2011 and then rise gradually in Hong Kong market.
By analyzing standard deviation, we can also find the trend information and the difference among investors. The standard deviation in Shanghai market range from 1.0382 to 1.7594 except 2008 and 2011. In 2008 and 2011, we can see the standard deviation jumped to extremely high level. In 2008, it is 43.7749, 10 times as large as mean value of realized volatility. In 2011, it is 851.056, 100 times as large as mean value of realized volatility. The standard deviation in Hong Kong market ranges from 0.67 to 2.1890. We can see that no standard deviation is larger than mean value in Hong Kong market, but standard deviation of 2009 to 2011 is larger than mean value in Shanghai market. We can find the cognitive bias in Shanghai market plays a more significant role than in Hong Kong market. On 2008 and 2011, there are 2 crises in China market, the first 1 is financial crisis beginning in US, the 2nd is liquidity crisis in China. On 2011, uncertainty extent to global market, but from the data we can see that extreme value played a significant role in Shanghai market. Considering the low liquidity of Shanghai market on 2011, we can know that the tick return was large. As we have known, institutional investors only constitute for 6.71% in Shanghai market, we can draw the conclusion that individual investors were more sensitive to liquidity supply and monetary policy. But in Hong Kong market, we can also see standard deviation follows a different pattern. Although the standard deviation of 2014 is larger, but all standard deviation is smaller than mean value. We can infer from the data that investors in Hong Kong market are more self-disciplined, because even after the shock investors are rarely deviated from their behavior patterns.
By analyzing skewness and kurtosis, we can find that the 3rd and 4th moment of Shanghai is much larger. In Shanghai market, the extremely large skewness and kurtosis infer the existence of large numbers of large tick-return.
Table 13a: Optimal Sampling Frequency Realized Volatility of Shanghai Market*10000
Table 14a: Optimal Sampling Frequency Realized Volatility Estimator of Hong Kong Market*10000
Table 13a and Table 14a are the summary of optimal sampling frequency realized volatility estimator. The optimal sampling frequency realized volatility is normalized by the median value. For All the stocks we use quotes posted on two exchanges, Shanghai and Hong Kong. The data of Shanghai comes from the WIND database. The data of Hong Kong coms from Hong Kong Stock Exchange.
Table 13b: Optimal Sampling Frequency Realized Volatility of Shanghai Market*10000
Table 14b: Optimal Sampling Frequency Realized Volatility of Shanghai Market*10000 Table 13b and Table 14b represent the Mean, Standard Deviation, skewness and kurtosis of optimal sampling frequency realized volatility estimator. The optimal sampling frequency realized volatility is normalized by the median value. For All the stocks we use quotes posted on two exchanges, Shanghai and Hong Kong. The data of Shanghai comes from the WIND database. The data of Hong Kong comes from Hong Kong Stock Exchange.
Shanghai and Hong Kong market. The figure shows the density of optimal sampling frequency realized volatility estimator from Jan. 2008 to Dec. 2014. For All the stocks we use quotes posted on two exchanges, Shanghai and Hong Kong. The data of Shanghai comes from the WIND database. The data of Hong Kong comes from Hong Kong Stock Exchange.
Fig. 14. Annual density of optimal sampling frequency realized volatility estimator of all stock listed on Shanghai and Hong Kong market. The figure shows the the density of optimal sampling frequency realized volatility estimator from Jan. 2008 to Dec. 2014. For All the stocks we use quotes posted on two exchanges, Shanghai and Hong Kong. The data of Shanghai comes from the WIND database. The data of Hong Kong comes from Hong Kong Stock Exchange.
From table 13 to table 14, we can see in Shanghai market, volatility decreased from 2008 to 2010. After jumping to a high level in 2011, the volatility decreases gradually until 2014. In Hong Kong market, volatility decreases from 2008 to 2011 and then increases gradually until 2014.
In 2008, Shanghai market’s volatility is as large as 0.6432. The standard deviation is 2.1999 which is 3 times as high as mean value. The large skewness and kurtosis infer that the cluster of large values exist, and extreme large volatility cause the large standard deviation. Hong Kong market’s volatility, standard deviation, skewness and kurtosis in 2009 are the largest volatility through these 7 years.
In 2009, Shanghai market’s volatility and standard deviation are much smaller than past year, but skewness and kurtosis grow larger. Those are meaning that volatility drops a lot and investors’ behaviors are becoming more similar, but more investors deviates from the normal. For Hong Kong market, not only the mean value and standard deviation, but also skewness and kurtosis declined. We can infer that there were fewer eccentric trades in Hong Kong market.
Shanghai market volatility in 2010 falls slightly 3.14%, but the standard deviation, skewness and kurtosis have risen sharply. Since 2008, even the average volatility is still declining, but the stock market turmoil unabated, there is no consensus on the economic trend. Hong Kong market volatility plummeted 68%. More importantly, we can also find a sharp drop in standard deviation, skewness and kurtosis. Investors in the Hong Kong market have been adapted to the market, fewer and fewer transactions deviate from the market's consensus.
In 2011, the Shanghai market experienced drastic fluctuations, which can be seen from the huge standard deviation, skewness and kurtosis. At the same time, the four major indicators gave investors the impression that they have plunged into the depth of volatility. In the Hong Kong market, the higher skewness and kurtosis tell us that investors are weird and unpredictable. Compared with other 6 years in the table, we can see that it was not an incredible level.
In 2012, the market volatility, standard deviation, skewness and kurtosis in Shanghai all show a sharp decline. Although the volatility is still greater than in 2009 and 2010, the standard deviation is almost the same as in 2010, with skewness and kurtosis being the lowest level since the financial crisis. However, in the Hong Kong market, the volatility is relatively high. This is the first increase since 2008. while the standard deviation, skewness and kurtosis decreased. The opposite is caused by the widening price gap. The lowest percentage point to 95% is shown in Table 13a. In 2013, Shanghai market volatility continues to decline, but the standard deviation increases, skewness and kurtosis jump to a high of 2011. As can be seen from Table 13a, the 25%, 50%, 75% and 95% percentiles of fluctuations in 2013 are smaller than in 2012, but the extreme volatility is extremely high, which means that the high value affects the 2013 stock market. In the meantime, we can see that the volatility in the Hong Kong market has risen slightly (Table14b). From Figure 13 and figure 14, we can see that the Hong Kong stock market has great volatility. Therefore, we speculate that institutional investors often change their investment targets.
Different from other years, all indicators are at a low level. Table 13a confirms this fact: since from 2008 to 2014, from 25% to the maximum, all the data are minimal. Volatility of Shanghai market rises slightly 4%, standard deviation, skewness and kurtosis also rise. In particular, the kurtosis jumps to its second highest level in seven years. As can be seen from Table 13a, 14b, the maximum values of 25%, 50%, 75% and 95% in 2014 are not as big as in 2009. At the same time, we also can see from Figure 13 and Figure 14 that the density map of 2014 is relatively flat.
2.8 Normalized Optimal Sampling Frequency Realized Volatility
It is reasonable for us to normalize it.
Table 15a: Normalized Optimal Sampling Frequency Realized Volatility of Shanghai Market
Table 16a: Normalized Optimal Sampling Frequency Realized Volatility of Hong Kong Market Table 15a and Table 16a are the summary of normalized optimal sampling frequency realized volatility estimator. The normalized optimal sampling realized volatility is normalized by the median value. For All the stocks we use quotes posted on two exchanges, Shanghai and Hong Kong. The data of Shanghai comes from the WIND database. The data of Hong Kong comes from Hong Kong Stock Exchange.
Table 16b: Normalized Optimal Sampling Frequency Realized Volatility of Hong Kong Market Table 15b and Table 16b represent the Mean, Standard Deviation, skewness and kurtosis of normalized optimal sampling frequency realized volatility estimator. The normalized optimal sampling frequency realized volatility is normalized by the median value. For All the stocks we use quotes posted on two exchanges, Shanghai and Hong Kong. The data of Shanghai comes from the WIND database. The data of Hong Kong comes from Hong Kong Stock Exchange.
Fig. 13. Annual density of normalized optimal sampling frequency realized volatility estimator of all stock listed on Shanghai and Hong Kong market. The figure shows the density of normalized optimal sampling frequency realized volatility estimator from Jan. 2008 to Dec. 2014. For All the stocks we use quotes posted on two exchanges, Shanghai and Hong Kong. The data of Shanghai comes from the WIND database. The data of Hong Kong comes from Hong Kong Stock Exchange.
Fig. 14. Annual density of normalized optimal sampling frequency realized volatility estimator of all stock listed on Shanghai and Hong Kong market. The figure shows the density of normalized optimal sampling frequency realized volatility estimator from Jan. 2008 to Dec. 2014. For All the stocks we use quotes posted on two exchanges, Shanghai and Hong Kong. The data of Shanghai comes from the WIND database. The data of Hong Kong comes from Hong Kong Stock Exchange.
In order to compare the volatility of two markets, we normalized the volatility of the optimal sampling frequency.
of Shanghai market and Hong Kong market. Data shows that in 2008, 2009 and 2014, the Hong Kong market fluctuates more widely, but from 2010 to 2013, the rate of declination was smaller. It can be inferred that the impact of the global financial crisis on the Hong Kong market is even more far-reaching. Before the normalization of data, we can find that the market volatility in Shanghai from 2009 to 2014 is larger. This means that investors in the Shanghai market are more volatile than those in Hong Kong. However, the financial crisis has changed the behavior of Hong Kong investors more profoundly. In the Shanghai market, the mean value of the normalized optimal sampling realized volatility is 8.4075 and that of the Hong Kong market is as high as 31.8341. In 2009, we can see that the normalized volatility was 1/4 of that in 2008. Although the normalized volatility in Hong Kong was only 1/8 of that in 2008, it was still double that of the Shanghai market in the same period. After 2009, the Shanghai market fluctuated more than the Hong Kong market. Especially the 2011 Shanghai market volatility is very large. For instance, the Hang Seng Index dropped sharply to 65.4% in 2008, to 14.3% in 2009, to 21.7% in 2011 and to 22% in 2012. Therefore, the drop in prices is not the reason for the sharp fluctuations in 2011. In 2012, the Chinese government ended its quantitative easing policy by launching a real estate control policy to tighten market liquidity.
By analyzing standard deviation, we can see the same characteristic. The standard deviations for 2008, 2009 and 2014 are small, but from 2010 to 2013 are larger. At the same time, we can also see that there is a large standard deviation in the Hong Kong market in 2008, with the standard deviation continuously dropping to 2012 and then gradually rising to 2014. In contrast to the Shanghai market, a larger standard deviation can be seen in 2008, and the standard deviation in 2011 is also high. The standard deviations in 2009, 2010, 2012 and 2013 are lower than those in other years. The smallest standard deviation was 2014. In 2008, the standard deviation of Hong Kong market was as high as 139.4097, while the standard deviation of Shanghai market is only 29.45549. After the crisis, the standard deviation in Hong Kong's market drops sharply, which is 1/11 of 2008, 1.6 times as large as that of Shanghai in 2008, but still three to five times as large as that of Shanghai after the crisis. The standard deviation
of the Shanghai market drops from 29.4549 in 2008 to 7.4558 in 2009. In 2011, the standard deviation of the Shanghai market jumped sharply to 8993.4905, but the market standard in Hong Kong kept in a low level at this time. In 2014, the standard deviation of Shanghai market is the smallest, while the standard deviation of Hong Kong market is on the rise since 2012. In other years, the standard deviation of the Shanghai market is 5.8393~8.9152, while that of the Hong Kong market is 1.8552~3.3503. From this we can conclude that the performance of investors in the Shanghai market is very inconsistent.
By analyzing the data of the third and fourth moments, we can look deeper into the two markets. In 2008, the skewness and kurtosis of the Shanghai market are the smallest in these seven years. Although the skewness and kurtosis of Hong Kong market in 2008 are the largest in these seven years, they are still smaller than those in Shanghai. The skewness and kurtosis of the Shanghai market are on the rise in 2009, while Hong Kong's market is declining. The deviations and kurtosis of the Shanghai market are four times and 110 times that of the Hong Kong market respectively. This means that there are more extremes in 2009, deviating the mean from the median, resulting in larger standard deviations. In 2010, the skewness and kurtosis of both markets declined. However, the Shanghai market drops 21.7% in 2010 and the Hong Kong market rises 5.3%. Other indicators show that the skewness and kurtosis of the Shanghai market jumps to a high level in 2011, inferring the irrationality of investors. Although the skewness and kurtosis of the Hong Kong market increased slightly, it was lower than in 2010 and much lower than that of the Shanghai market. In 2012, both markets have low skewness and kurtosis. Although the Shanghai market index still far exceeds the Hong Kong market index, the skewness of Shanghai market is only 19 times that of Hong Kong market, while kurtosis of Hong Kong market is 520 times that of Shanghai market. In 2013, the indicators of both markets increased. In 2014, the skewness in Shanghai falls down and the Hong Kong market rises up instead. The Hong Kong market has the greatest skewness and kurtosis after the financial crisis.
2.9 Summary of 4 realized volatility estimators
we can see that in Hong Kong market, the density is not as smooth as that in Shanghai market. The reason for this phenomenon is that there are fewer stocks in Hong Kong market and the unit of quote price is different from stock to stock.
The normalized realized volatility estimator is the smallest estimator and ranges from 0.9448 to 2.9341 in Shanghai market and 0.7063 to 2.3494 in Hong Kong market. The standard deviation of the normalized simple realized volatility estimator Shanghai market is 0.8604 to 25.6428 and in Hong Kong market is 0.4036 to 3.8530. The skewness of the Shanghai market ranges from 6.7382 to 287.001 while that of the Hong Kong market ranges from 0.4366 to 8.5365. The kurtosis in the Shanghai market is from 152.6845 to 86956.95256, and in the Hong Kong market is from 3.1658 to 96.4723. Therefore, both the minimum and maximum indices of the simple realized volatility estimator are smaller than the other estimators.
Not only mean value of simple realized volatility, but also other indicators are smaller than other estimators. Although the average of the simple realized volatility estimates in both markets follows the pattern of sharp declines from 2008 to 2010 and then fluctuates within a small area, the other indicators do not follow the same pattern. In Hong Kong market, the standard deviation, skewness and kurtosis follow the same pattern as the mean. In Shanghai market, those three estimators have high value in 2008 and 2011, and fluctuate slightly in other years.
The lower level of simple realized volatility estimators means its movements do not fluctuate like the other estimates. Compared with other estimators, simple realized volatility estimator is larger than absolute level, but after normalization fluctuation plays a less important role compared with other estimators. As we have known, simple realized volatility is an unbiased estimator of volatility without microstructure. Because of the existence of microstructure noise, simple realized volatility can be seen as an accumulative noise estimator. In another word, accumulative noise does not fluctuate dramatically as other indicators do.
market commentary in both markets by analyzing the realized estimates. We give the following summary of the four actual volatility estimates.
Table 17: Relations among Realized Volatility Estimators
Table 17 is the summary of 4 realized volatility estimators. The data of this table represent the relations among Realized Volatility Estimators between Shanghai and Hong Kong markets.
Firstly, in both markets, simple realized volatility estimator, 5 minutes realized volatility estimator, 15 minutes realized volatility estimator, optimal sampling frequency realized volatility estimator are size down. From tables 17, we can find that in Shanghai market, simple realized volatility estimator is the largest estimator, the volatility is 42.02 times of 5 minutes realized volatility, 128.1209 times of 15 minutes realized volatility and 689 times of Bandi Optimal Sampling realized volatility. In the Hong Kong market, simple realized volatility estimator is 137.6942 times as large as 5 minutes realized volatility and 399 times as large as 15 minutes realized volatility. Secondly, there are more extreme tick returns in Shanghai market. As can be seen from Table 17, in Shanghai market 5 minutes realized volatility estimator is 3.921 times as large as 15 minutes realized volatility estimator in Shanghai market and in Hong Kong market 5 minutes’ estimator is 2.899 times as large as 15 minutes realized volatility estimator. Considering the average sampling interval in bother markets are a 54 and 60.2 minutes respectively, 5 minutes realized volatility estimators is 32 times and 140 times respectively as large as Bandi optimal sampling frequency realized volatility estimator. Through the numerical relationship between different estimators, we can find that the shorter the sampling interval, the larger the estimated value of the actual volatility. Due to the great realization of volatility and the extreme realization of an uneven distribution of volatility, shorter sampling intervals result in larger estimates of volatility. In order to show the intraday large return ticks distribution, we use
600030.SH as an example. When we analyze when the maximum 1% tick occurs, we find that there is a bigger tick in the morning and an opening in the afternoon. This explains why the shorter the sampling interval, the larger the realized volatility is.
Fig. 15: Intraday Ticks
Thirdly, we find that the trend of volatility changes is the same no matter what kind of realized volatility estimator is used, especially in the Shanghai market. In the Shanghai market, we can see that all volatility estimators in 2008 and 2011 are very large.
3. Dose Any Other Factors Drive Volatility
3.1 Relationships among Stock Markets
In this section, we will calculate the correlation among the Shanghai Composite Index, the Hang Seng Index, the Nikkei 225 Index and the S & P Index.
As can be seen from Table 18, the US market is not only independent from the Shanghai market, but also independent from the Japanese market, thus reflecting the separation of the stock markets. Although Shanghai and Hong Kong belong to the same country, Hong Kong has a closer relationship with the Japanese market. The low correlation between the United States and other Asian countries is partly due to geographical distance. Hong Kong is closely related to other markets because of the liberation of Hong Kong and the peg to the U.S. dollar. The lower correlation among Shanghai and other markets is because of financial control and limited QFII in China’s capital markets.
Table 18: Correlation among Global Markets
Correlation coefficient is a simple and practical statistical indicator, but cannot reflect the evolution of different markets’ relationship over a period of time. In order to analyze the correlation between different markets, we use the moving correlation coefficient method with 60-day rolling window.
Fig .16 Represent Dynamic Correlations
From Figure 16, we can find that the rolling correlation among Shanghai market, Hong Kong market, Japan market and US market. At the same time, the correlation between Shanghai and Nikkei markets is smaller than that between Hong Kong and Nikkei could be found. It can be seen from figure 16 that the correlation increases and decreases several times, so the correlation instability is intuitively seen.
It can be seen from the figure 16 that the S & P relationship in Shanghai shows a trend of around 0 between 2008 and 2014 and a negative correlation between 2008 and the end of 2014 to the middle of 2014. Therefore, most of this correlation is at the lowest
level.
At the end of 2012, the correlation between the Hong Kong market and the Nikkei market peaked, then dropped sharply before climbing back to early 2014, after dropping back to its lowest level ever since. We can see that the correlation between the Shanghai and Japan markets has declined and is not stable.
From Figure 16, we can find that the Shanghai Hong Kong relation is constant, evolves 0.3 to 0,7. It reached the highest level by the end of 2012. Although it is lower than that of Hong Kong's Nikkei during the same period.
From the above analysis, the characteristic of the data is summarized as follows: 1) High correlation between Shanghai market and Hong Kong market is stable. 2) The relationship between Hong Kong and Japan markets is weakening from
2012
3) The Hong Kong market is more closely linked to the global market than the Shanghai market.
3.2 Transactions
How many transactions a day is considered an indicator of liquidity in the market. As a result, it is a factor closely related to the actual volatility estimator.
Table 20a: Transactions of Hong Kong Market
Table 19a and Table 20a are the transactions of Shanghai and Hong Kong markets. For All the stocks we use quotes posted on two exchanges, Shanghai and Hong Kong. The data of Shanghai comes from the WIND database. The data of Hong Kong coms from Hong Kong Stock Exchange.
Table 19b: Data Summary of Transactions in Shanghai Market
Table 20b: Data Summary of Transactions in Hong Kong Market
Table 19b and Table 20b represent the Mean, Standard Deviation, skewness and kurtosis of transactions. The transactions are normalized by the median value. For All the stocks we use quotes posted on two exchanges, Shanghai and Hong Kong. The data of Shanghai comes from the WIND database. The data of Hong Kong comes from Hong Kong Stock Exchange.
Fig. 17. the data summary of all stock listed on Shanghai and Hong Kong market. The figure shows the density of transactions from Jan. 2008 to Dec. 2014. For All the stocks we use quotes posted on two exchanges, Shanghai and Hong Kong. The data of Shanghai comes from the WIND database. The data of Hong Kong comes from Hong Kong Stock Exchange.
Fig. 18. Annual density of ticks of all stock listed on Shanghai and Hong Kong market. The figure shows the density of transactions from Jan. 2008 to Dec. 2014. For All the stocks we use quotes posted on two exchanges, Shanghai and Hong Kong. The data of Shanghai comes from the WIND database. The data of Hong Kong comes from Hong Kong Stock Exchange.
Shanghai market is considered a very liquid market. From Figure 18, we can find the
difference between the Shanghai market and the Hong Kong market. Transaction number in Shanghai is bigger than in Hong Kong. We can see the average daily transaction number in Shanghai market is range from 1076 to 2126. In 2008, it was 1473 and increased to 2126 in 2009, then decreased gradually to 1076 until 2012. In 2013, the transaction number increased to 1146 and 1618 to 2104. In Hong Kong market, the transaction number is less than the Shanghai market. The number of transactions is between 617 to 807. The largest transaction number in Hong Kong market is even smaller than that in Shanghai market. In the Hong Kong market, the number of transactions in 2008 was 617, then surged to 765 in 2009 and then gradually dropped to 633 in 2014, but the average daily trading volume jumped to a peak of 807 in 2013. The standard variance of transaction number of Shanghai is larger than the Hong Kong market. Due to the smaller average number of transactions in the Hong Kong market, the number of transactions in the Hong Kong market has changed more than in the Shanghai market. In Shanghai market, the standard variance is 1/2 to 2/3 of average daily transaction number. Contrary to Hong Kong market, the standard
variance is almost equal to the average daily transaction number.
Table 19b and table 20b show that the skewness of the Shanghai market ranged from 0.3521 to 1.1428 and that of the Hong Kong market ranged from 2.3510 to 3.1937. So Hong Kong's market is more biased than Shanghai market. Shanghai market happened the largest deviation in 2007 with the smallest transaction number. In Hong Kong market, the largest skewness happens in 2014 when the second lowest trading volume happens. It is well-known that a smaller skewness means fewer observations deviate from the center. We can infer that, there are more extreme values in the Hong Kong market. As can be seen from Table 13 and Table 14, the 1st quarter, median, mean, 3rd, 95% quintile data in Shanghai market is larger than that in Hong Kong market. However, the maximum value of ticks in Hong Kong market is much larger than the Shanghai market.
The kurtosis of transaction number of Shanghai market is also different from that in Hong Kong market. The kurtosis in Shanghai market is between 2.3 and 4.3, most of them are around 3. However, the least kurtosis in Hong Kong market is 11.8930 and the largest is 21.4363. Hence, we can easily conclude that the transaction number in Hong Kong market appears leptokurtic. Due to the budget constraint, individual investors are not less likely trades large volume. We can conclude that individual investors play a significant role in Shanghai market and institutional investors in Hong Kong market plays a significant role in Hong Kong market.
Another fact that we should be concerned about is the maximum volume of
transactions in both markets. Although the trading volume in Shanghai is relatively large, the maximum value of the Hong Kong market has been even greater in the past seven years. In the securities market, unexpected liquidity is always associated with the cash holdings of institutional investors.
From table 19b and table 20b, we can see that the volatility of the Shanghai market in 2008 and 2011 are both very high and the volatility of the Hong Kong market in 2008 and 2014 are very high. Through the analysis of transaction number of two markets, we can find that transaction number of Shanghai market in 2008 and 2011 have similar pattern. In the Shanghai market, 5%,25%, 50%, 75%, 95% percentile transaction
number in 2008 and 2011 are similar. The trading volumes in the most volatile years are neither the largest nor the smallest, which means that high volatility period market does not happen when the market is highly liquid or weakly liquid.
The high liquidity leads individual investors trading frequently in Shanghai market and institutional trading frequently in Hong Kong market. At the same time, we can find there is a kurtosis and skewness in the frequent trading period of Shanghai market. Form Table 13, we see that the maximum transactions in Shanghai market rarely change from 2008 to 2011, implying that the capitals flow to securities equally. In Hong Kong market, we can see that when the market becomes more liquor, the change of kurtosis is unpredictable. But in most instances, the more liquor the market is, the larger the kurtosis is. This means that in Hong Kong market, new capitals are more likely to flow to some certain securities.
3.3 Noise
In this part, we will analyze microstructure noise and its relation with other realized volatility estimators.
Table 21: Noise of Shanghai Market
Table 22: Noise of Hong Kong Market
Table 21 and Table 22 represent the Mean, Standard Deviation, skewness and kurtosis of noise data. The noise data is normalized by the median value. For All the stocks we use quotes posted on two exchanges, Shanghai and Hong Kong. The data of Shanghai comes from the WIND database. The data of Hong
Kong comes from Hong Kong Stock Exchange.
Fig. 19. Annual density of noise data of all stock listed on Shanghai and Hong Kong market. The figure shows the density of noise data from Jan. 2008 to Dec. 2014. For All the stocks we use quotes posted on two exchanges, Shanghai and Hong Kong. The data of Shanghai comes from the WIND database. The data of Hong Kong comes from Hong Kong Stock Exchange.
Fig. 20. Annual density of noise of all stock listed on Shanghai and Hong Kong market. The figure shows the density of noise from Jan. 2008 to Dec. 2014. For All the stocks we use quotes posted on two exchanges, Shanghai and Hong Kong. The data of Shanghai comes from the WIND database. The data of Hong Kong comes from Hong Kong Stock Exchange.
Bandi and Russel (2004) show that ZC[HVW,XY
; → E(1
:) . We can get daily noise since
we know simple realized volatility estimator and trading volume.
The noise in Shanghai market is much smaller than that of Hong Kong market. Since noise can be seen as a daily average tick-return, tick-return is much larger in Hong Kong market. In Hong Kong market. In Shanghai market, 2008 has the largest noise, and largest 2rd 3th 4th moments. In the following years, Shanghai market noise fluctuate from 0.0164 to 0.0225. In Hong Kong market, the market noise is also largest. Then standard deviation of noise of Shanghai market is smaller than that of Hong Kong market. The standard deviation is much larger than mean noise in Hong Kong