A mesocortical dopamine circuit enables the
cultural transmission of vocal behaviour
著者
Masashi Tanaka, Fangmiao Sun, Yulong Li,
Richard Mooney
journal or
publication title
Nature
volume
563
page range
117-120
year
2018-10-17
URL
http://hdl.handle.net/10097/00125837
doi: 10.1038/s41586-018-0636-7A mesocortical dopamine circuit enables the cultural transmission of vocal behavior
1 2
Masashi Tanaka1,2, Fangmiao Sun3,4, Yulong Li3,4,5, and Richard Mooney1*
3 4
1Department of Neurobiology, Duke University, Durham, NC 27710 USA
5
2Present Address: Graduate School of Life Sciences, Tohoku University, Sendai, Miyagi
980-6
8577 Japan
7
3State Key Laboratory of Membrane Biology, Peking University School of Life Sciences,
8
Beijing 100871, China
9
4PKU-IDG/McGovern Institute for Brain Research, Beijing 100871, China
10
5Peking-Tsinghua Center for Life Sciences, Beijing 100871, China
11 12
*Correspondence: [email protected]
The cultural transmission of behavior depends on a pupil’s ability to identify and emulate
14
an appropriate tutor1-4. How the pupil’s brain detects a suitable tutor and encodes the
15
tutor’s behavior is largely unknown. Juvenile zebra finches readily copy songs of adult
16
tutors they interact with, but not songs they listen to passively through a speaker5,6,
17
indicating that social cues generated by the tutor facilitate song imitation. Here we show
18
that neurons in the midbrain periaqueductal gray (PAG) of juvenile finches are selectively
19
excited by a singing tutor and, by releasing dopamine (DA) in a sensorimotor cortical
20
analogue (HVC), help encode tutor song representations used for vocal copying. Blocking
21
DA signaling in the pupil’s HVC during tutoring blocked copying, whereas pairing
22
stimulation of PAG terminals in HVC with song played through a speaker was sufficient
23
to drive copying. Exposure to a singing tutor triggered the rapid emergence of responses
24
to the tutor song in the pupil’s HVC and a rapid increase in the pupil’s song complexity,
25
an early signature of song copying7,8. These findings reveal that a dopaminergic
26
mesocortical circuit detects a tutor’s presence and helps encode the tutor’s performance,
27
facilitating the cultural transmission of vocal behavior.
28 29
The cortical song nucleus HVC is crucial to singing and song learning7,9-12 and receives
30
convergent input from premotor, auditory, and neuromodulatory afferents, including dopamine
31
(DA)-secreting neurons in the midbrain periaqueductal gray (PAG)13-15 (Fig. 1a-c, Extended
32
Data Fig. 1a-c). In the mammalian PAG, DA neurons encode information about social context,
33
arousal in response to behaviorally salient stimuli, or reward16-18, raising the possibility that the
34
PAG to HVC pathway in juvenile finches encodes information about the tutor that facilitates
35
song imitation. To explore this idea, we implanted tetrodes into the PAG of juvenile male
36
finches raised in isolation from a tutor (tutor-naive juveniles; see Methods) (Fig. 1d-k). Most
37
PAG neurons (81.8%: 18/22 neurons from 4 birds) increased their action potential activity in
38
the presence of a singing tutor (Fig. 1e-g, k), whereas PAG activity was unaffected during
39
encounters with non-singing adult male finches or female finches, which do not sing (Fig.
1i-40
j, k). Neural activity in the juvenile’s PAG was not precisely locked to syllables of the tutor
41
song, was variable across different tutor song bouts, and could remain elevated for hundreds of
42
milliseconds after the tutor stopped singing (Extended Data Fig. 2c-f), suggesting that PAG
43
activity evoked by a singing tutor is not simply auditory in nature. Indeed, playback of adult
44
finch song from a speaker, including that of a recent tutor, failed to evoke activity in the
45
juvenile’s PAG (Fig. 1h, k). Moreover, song playback from a speaker in the presence of an
46
adult female bird failed to activate PAG neurons in tutor-naive juveniles (Extended Data Fig.
47
2a,b). Therefore, PAG neurons in juvenile males respond strongly and selectively to a live
singing tutor and thus can signal the presence of a suitable song model.
49
These findings raise the possibility that experience of a singing tutor stimulates DA release
50
from PAG terminals in HVC. We explored this idea by virally expressing a modified dopamine
51
type 2 (D2) receptor in HVC neurons of tutor-naive juvenile males that increases fluorescence
52
upon DA binding (Fig. 2) (AAV 2/9.hSyn.GRABDA1h)19. We then head-fixed these juvenile
53
males in the awake state and used two-photon imaging methods20 to establish that DA levels in
54
HVC increase in the presence of a singing tutor (Fig. 2c-d, i). In contrast, DA-related changes
55
in fluorescence were not detected in the juvenile’s HVC in response to song playback (Fig. 2e,
56
i), or when the juvenile encountered non-singing adult males or females (Fig. 2f, g, i),
57
paralleling the selective enhancement of PAG activity elicited by a singing tutor. Moreover,
58
ablating DA neurons in the pupil’s PAG with 6-hydroxydopamine (6-OHDA21) prevented
tutor-59
evoked DA transients in the pupil’s HVC (Fig. 2h, i), confirming that tutor-evoked DA release
60
in the pupil’s HVC largely originates from the PAG.
61
To explore whether DA signaling in HVC plays a role in song imitation, we used 6-OHDA to
62
lesion DA-releasing fibers in the HVC of juvenile male finches raised continuously with adult
63
male tutors and tracked their song development into adulthood (Fig. 3a-c, Extended Data Fig.
64
3). Lesions of DA-releasing fibers in HVC made near the onset of the sensitive period for tutor
65
song memorization (30 days-post-hatch22 or 30 d) prevented song copying (Fig. 3d-e) without
affecting the overall rate of singing (Extended Data Fig. 4a). As adults, these 6-OHDA treated
67
birds produced abnormally long and acoustically simple syllables, similar to finches raised in
68
isolation from a tutor22 (Extended Data Fig. 4b, c). The 6-OHDA lesions made in HVC in 30 d
69
males are permanent and thus could potentially interfere with tutor song memorization (i.e.,
70
sensory learning), the subsequent phase of song copying (sensorimotor learning), or both.
71
However, 6-OHDA lesions made in the HVC of 45 d males, which have had sufficient tutor
72
experience to enable accurate copying but are just beginning sensorimotor learning22, did not
73
affect the juvenile’s ability to copy a tutor song (Fig. 3d, f).
74
These findings suggest that DA signaling in HVC plays a role in sensory learning but cannot
75
exclude a more general but developmentally restricted (before 45d, e.g.) role for such signaling.
76
Therefore, we used microdialysis methods23 to reversibly block DA receptors in the HVC24 of
77
tutor-naive juvenile males (Age: 43.0 ± 4.9 d [mean ± SD], n = 5) while they were housed with
78
a tutor for 1.5 h on five consecutive days, allowing us to better determine whether DA signaling
79
in HVC is crucial during pupil-tutor interactions, when sensory learning occurs (Fig. 3g-h,
80
Extended Data Fig. 5a-c). Reversibly blocking DA receptors in HVC during but not just after
81
tutoring sessions blocked song copying (Fig. 3h, Extended Data Fig. 5b-c), without affecting
82
juveniles’ attentive behaviors to tutors or tutors’ singing rates (Extended Data Fig. 5d-e,
83
Supplementary Video 1-2). Moreover, reversibly suppressing PAG activity in the pupil with
84
muscimol during daily tutoring sessions also blocked song copying; notably, juveniles in which
PAG was inactivated also failed to orient to their tutors, even though tutors continued singing
86
at normal rates (Extended Data Fig. 5d-h, Supplementary Video 3). Thus, tutor-evoked
87
activation of the pupil’s PAG and concomitant release of DA in HVC are essential to encoding
88
tutor song experience, and PAG activity may be required for the pupil to attend to a singing
89
tutor.
90
The current findings do not exclude the possibility that DA signaling at other sites also
91
contributes to sensory learning. One potential site is the basal ganglia region Area X11, which
92
receives dopaminergic input from the ventral tegmental area and substantia nigra pars compacta
93
(VTA/SNc), as well as from a smaller cohort of TH+ PAG neurons (Extended Data Fig. 1d-g),
94
and where dopamine signaling plays a role in sensorimotor learning25. Nonetheless, infusing
95
DA receptor blockers into Area X of juvenile males during daily tutoring sessions did not affect
96
song copying (Extended Data Fig. 6). Another potential site is the caudal mesopallium (CM),
97
an auditory forebrain region important to song memory26,27. However, blocking DA receptors
98
in the CM of juvenile males during daily tutoring sessions did not block song copying
99
(Extended Data Fig. 5i-k).
100
These results show that DA release from PAGaxon terminals in HVC (PAGHVC terminals)
101
signals the presence of a suitable model and helps encode this model in the pupil’s brain.
102
Consequently, artificially activating PAGHVC terminals should compensate for the absence of a
live tutor and facilitate vocal copying in response to song playback. To test this idea, we used
104
AAVs to express channelrhodopsin-2 (ChR2) bilaterally in the PAG of tutor-naive juvenile
105
males (Fig. 3i-j, Extended Data Fig. 7a-d). Several weeks (33.3 ± 7.4 days [mean ± SD], n =
106
6) later, we implanted optical fibers bilaterally over HVC and optogenetically activated
107
PAGHVC terminals while playing an adult male zebra finch song through a speaker. Pairing
108
PAGHVC terminal stimulation with song playback resulted in a significant level of song copying
109
compared to juveniles that had only been exposed to song playback, or to song playback and
110
optical illumination of HVC in the absence of ChR2 (Fig. 3j, Extended Data Fig. 7b; see
111
Methods). Moreover, pairing song playback with PAGHVC terminal stimulation while infusing
112
DA blockers into HVC did not lead to song copying in tutor-naive juveniles (Extended Data
113
Fig. 7e-g).
114
To explore how tutor-evoked DA release from PAGHVC axon terminals alters HVC to drive song
115
imitation, we implanted tetrodes in the HVC of tutor-naive juveniles and recorded neural
116
activity before and after their initial encounters with a singing tutor (Fig. 4a-f). Spontaneous
117
burst firing in HVC neurons increased within 1 h after the juvenile’s initial exposure to a
118
singing tutor (Fig. 4b-c, e), without any change in their mean firing rates (Extended Data Fig.
119
8d). Because burst firing in HVC is driven by auditory afferents12, this enhanced bursting
120
suggests that tutoring rapidly potentiates auditory inputs to HVC. In fact, brief (35.0 ± 16.8
121
min [mean ± SD]) experience with a singing tutor led rapidly (~1 h) to the emergence of
temporally precise responses in the awake juvenile HVC to tutor song playback (Fig. 4d, f,
123
Extended Data Fig. 8a-c). Furthermore, the mean firing rate of HVC neurons to song playback
124
was unaffected by tutoring (Extended Data Fig. 8e-f), indicating that neural responses in HVC
125
became more tightly locked to specific features in the tutor song. None of these juveniles (n =
126
4) sang during or for several hours after the tutoring session, and thus these physiological
127
changes were not simply the result of auditory feedback associated with vocal rehearsal. In
128
another set of tutor-naive juvenile males, we found that tutoring rapidly reduced the kurtosis
129
of vocal duration (Fig. 4g-h) and increased the mean entropy variance of the juveniles’ songs
130
(Fig. 4i), two early hallmarks of song copying7,8. Notably, blocking DA signaling in the pupil’s
131
HVC with 6-OHDA or DA blockers prevented these physiological and behavioral changes (Fig.
132
4e, f, h-i).
133
The discovery that DA neurons in the pupil’s PAG are strongly and selectively activated by a
134
singing tutor parallels an emerging body of evidence that potentially homologous neurons in
135
the mammal can encode social cues, including those related to reward, context, or novelty16,17.
136
Indeed, the present findings advance a model in which both social cues and the song-related
137
auditory input provided by the singing tutor drive the coincident activation of DA receptors
138
and auditory synapses in HVC, leading to the rapid emergence of auditory representations of
139
the tutor’s song necessary to song imitation10,20 (Extended Data Fig. 10). This coincident
140
encoding mechanism could help ensure that the pupil’s brain selectively forms representations
of songs produced by suitable adult tutors, and not of extraneous auditory stimuli. Although
142
DA-dependent modulation of auditory cortical representations has previously been linked to
143
perceptual learning28, a notable feature of the DA-dependent process of auditory encoding
144
described here is that it occurs in a vocal motor region and rapidly drives vocal imitation. More
145
broadly, DA signaling is enhanced in the motor cortex of primates relative to other
146
mammals29,30, raising the possibility that augmented DA signaling in motor regions of
147
songbirds and primates reflects a convergent neural architecture for promoting motor imitation
148
in response to social models.
149
References
151 152
1 Whiten, A. Social Learning and Culture in Child and Chimpanzee. Annu Rev Psychol
153
68, 129-154, doi:10.1146/annurev-psych-010416-044108 (2017).
154
2 Goldstein, M. H., King, A. P. & West, M. J. Social interaction shapes babbling:
155
Testing parallels between birdsong and speech. Proceedings of the National Academy
156
of Sciences of the United States of America 100, 8030-8035, 157
doi:10.1073/pnas.1332441100 (2003).
158
3 Marler, P. & Tamura, M. Culturally Transmitted Patterns of Vocal Behavior in
159
Sparrows. Science 146, 1483-&, doi:DOI 10.1126/science.146.3650.1483 (1964).
160
4 Fehér, O., Wang, H. B., Saar, S., Mitra, P. P. & Tchernichovski, O. De novo
161
establishment of wild-type song culture in the zebra finch. Nature 459, 564-U594,
162
doi:10.1038/nature07994 (2009).
163
5 Chen, Y., Matheson, L. E. & Sakata, J. T. Mechanisms underlying the social
164
enhancement of vocal learning in songbirds. Proceedings of the National Academy of
165
Sciences of the United States of America 113, 6641-6646, 166
doi:10.1073/pnas.1522306113 (2016).
167
6 Derégnaucourt, S., Poirier, C., Kant, A. V., Linden, A. V. & Gahr, M. Comparisons of
168
different methods to train a young zebra finch (Taeniopygia guttata) to learn a song. J
169
Physiol Paris 107, 210-218, doi:10.1016/j.jphysparis.2012.08.003 (2013). 170
7 Aronov, D., Andalman, A. S. & Fee, M. S. A specialized forebrain circuit for vocal
171
babbling in the juvenile songbird. Science 320, 630-634,
172
doi:10.1126/science.1155140 (2008).
173
8 Derégnaucourt, S., Mitra, P. P., Feher, O., Pytte, C. & Tchernichovski, O. How sleep
174
affects the developmental learning of bird song. Nature 433, 710-716,
175
doi:10.1038/nature03275 (2005).
176
9 Nottebohm, F., Stokes, T. M. & Leonard, C. M. Central Control of Song in Canary,
177
Serinus-Canarius. J Comp Neurol 165, 457-486, doi:DOI 10.1002/cne.901650405
178
(1976).
179
10 Roberts, T. F., Gobes, S. M., Murugan, M., Olveczky, B. P. & Mooney, R. Motor
180
circuits are required to encode a sensory model for imitative learning. Nat Neurosci
181
15, 1454-1459, doi:10.1038/nn.3206 (2012).
182
11 Fortune, E. S. & Margoliash, D. Parallel Pathways and Convergence onto Hvc and
183
Adjacent Neostriatum of Adult Zebra Finches (Taeniopygia-Guttata). J Comp Neurol
184
360, 413-441, doi:DOI 10.1002/cne.903600305 (1995).
185
12 Coleman, M. J. & Mooney, R. Synaptic transformations underlying highly selective
186
auditory representations of learned birdsong. J Neurosci 24, 7251-7265,
187
doi:10.1523/JNEUROSCI.0947-04.2004 (2004).
13 Appeltants, D., Absil, P., Balthazart, J. & Ball, G. F. Identification of the origin of
189
catecholaminergic inputs to HVc in canaries by retrograde tract tracing combined
190
with tyrosine hydroxylase immunocytochemistry. J Chem Neuroanat 18, 117-133
191
(2000).
192
14 Hamaguchi, K. & Mooney, R. Recurrent interactions between the input and output of
193
a songbird cortico-basal ganglia pathway are implicated in vocal sequence variability.
194
J Neurosci 32, 11671-11687, doi:10.1523/JNEUROSCI.1666-12.2012 (2012). 195
15 Kingsbury, M. A., Kelly, A. M., Schrock, S. E. & Goodson, J. L. Mammal-like
196
organization of the avian midbrain central gray and a reappraisal of the intercollicular
197
nucleus. PLoS One 6, e20720, doi:10.1371/journal.pone.0020720 (2011).
198
16 Cho, J. R. et al. Dorsal Raphe Dopamine Neurons Modulate Arousal and Promote
199
Wakefulness by Salient Stimuli. Neuron 94, 1205-1219 e1208,
200
doi:10.1016/j.neuron.2017.05.020 (2017).
201
17 Matthews, G. A. et al. Dorsal Raphe Dopamine Neurons Represent the Experience of
202
Social Isolation. Cell 164, 617-631, doi:10.1016/j.cell.2015.12.040 (2016).
203
18 Flores, J. A., Galan-Rodriguez, B., Ramiro-Fuentes, S. & Fernandez-Espejo, E. Role
204
for dopamine neurons of the rostral linear nucleus and periaqueductal gray in the
205
rewarding and sensitizing properties of heroin. Neuropsychopharmacol 31,
1475-206
1488, doi:10.1038/sj.npp.1300946 (2006).
207
19 Sun, F., Zeng, J., Jing, M. Zhou, J., Feng, J., Owen, S. F., Luo, Y., Li, F., Wang, H.,
208
Yamaguchi, T., Yong, Z., Gao, Y., Peng, W., Wang, L., Zhang, S., Du, J., Lin, D.,
209
Xu, M., Kreitzer, A. C., Cui, G. & Li, Y. A Genetically Encoded Fluorescent Sensor
210
Enables Rapid and Specific Detection of Dopamine in Flies, Fish, and Mice. Cell 174,
211
481-496, doi:10.1016/j.cell.2018.06.042 (2018).
212
20 Roberts, T. F., Tschida, K. A., Klein, M. E. & Mooney, R. Rapid spine stabilization
213
and synaptic enhancement at the onset of behavioural learning. Nature 463, 948-952,
214
doi:10.1038/nature08759 (2010).
215
21 Ungerstedt, U. & Arbuthnott, G. W. Quantitative recording of rotational behavior in
216
rats after 6-hydroxy-dopamine lesions of the nigrostriatal dopamine system. Brain Res
217
24, 485-493 (1970).
218
22 Eales, L. A. Song Learning in Zebra Finches - Some Effects of Song Model
219
Availability on What Is Learnt and When. Animal Behaviour 33, 1293-1300, doi:Doi
220
10.1016/S0003-3472(85)80189-5 (1985).
221
23 Tanaka, M., Singh Alvarado, J., Murugan, M. & Mooney, R. Focal expression of
222
mutant huntingtin in the songbird basal ganglia disrupts cortico-basal ganglia
223
networks and vocal sequences. Proceedings of the National Academy of Sciences of
224
the United States of America 113, E1720-1727, doi:10.1073/pnas.1523754113 (2016). 225
24 Kubikova, L., Wada, K. & Jarvis, E. D. Dopamine receptors in a songbird brain. J
226
Comp Neurol 518, 741-769, doi:10.1002/cne.22255 (2010). 227
25 Hisey, E., Kearney, M. G. & Mooney, R. A common neural circuit mechanism for
228
internally guided and externally reinforced forms of motor learning. Nat Neurosci,
229
doi:10.1038/s41593-018-0092-6 (2018).
230
26 Roberts, T. F. et al. Identification of a motor-to-auditory pathway important for vocal
231
learning. Nat Neurosci 20, 978-986, doi:10.1038/nn.4563 (2017).
232
27 London, S. E. & Clayton, D. F. Functional identification of sensory mechanisms
233
required for developmental song learning. Nat Neurosci 11, 579-586,
234
doi:10.1038/nn.2103 (2008).
235
28 Bao, S., Chan, V. T. & Merzenich, M. M. Cortical remodelling induced by activity of
236
ventral tegmental dopamine neurons. Nature 412, 79-83, doi:10.1038/35083586
237
(2001).
238
29 Berger, B., Gaspar, P. & Verney, C. Dopaminergic innervation of the cerebral cortex:
239
unexpected differences between rodents and primates. Trends Neurosci 14, 21-27
240
(1991).
241
30 Williams, S. M. & Goldman-Rakic, P. S. Widespread origin of the primate
242
mesofrontal dopamine system. Cereb Cortex 8, 321-345 (1998).
243 244
Acknowledgements
245
We thank Jordan Hatfield for constructing AAV2/9-CAG-GRABDA1h. We also thank Stephen
246
Nowicki, Susan Peters, Christopher Sturdy, Fan Wang, and Scott Soderling for critical
247
discussion and for reading earlier versions of this manuscript. This work was supported by
248
JSPS Postdoctoral Fellowship for Research Abroad (M.T.), the National Basic Research
249
Program of China 973 Program Grant 2015CB856402 (Y.L.), the American BRAIN Initiative
250
project 1U01NS103558-01 (Y.L.), NIH Grant 1R01-NS-099288 (R.M.), and NSF
IOS-251
1354962 (R.M.).
252
Author contributions
M.T. and R.M. designed experiments. F.S. and Y.L. developed DA sensors, M.T. performed
254
experiments and analyzed data. M.T. and R.M. wrote the manuscript.
255
Data availability
256
The datasets generated and analyzed during the current study are available from the
257
corresponding author on reasonable request.
258
Competing interests
259
F.S. and Y.L. have filed patent applications whose value might be affected by this publication.
260
Correspondence and requests for materials should be addressed to R.M.
261
Figure legends
263
264
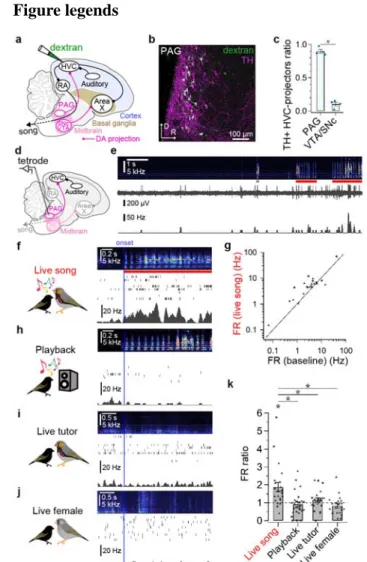
Figure 1 | Recordings of PAG activity.
265
a, Schematics of dextran injection into HVC. b, PAG neurons labeled with dextran (green) and
266
TH antibody (pseudo-colored magenta) (~0.5 mm lateral, R: rostral, V: ventral). c, Proportion
267
of double-labeled neurons (dextran and TH) in the midbrain (χ2-test: χ2(1) = 623.02, P < 0.001,
268
n = 4 hemispheres from 3 birds). d, Schematics of tetrode recordings from PAG neurons. e, 269
PAG unit activity during live tutor songs (red bar) (gray bar: an isolated tutor call) (top: sound
270
spectrogram, middle: voltage recording, bottom: firing rate). f, PAG unit activity aligned to the
271
onset of tutor songs (top: averaged spectrogram, middle: spike raster, bottom: mean firing rate).
272
g, Mean firing rate (FR) during live tutor songs as a function of baseline FR of PAG neurons.
273
h-j, PAG unit activity aligned to the onset of song playback (h), encounters with a live,
non-274
singing tutor (i), encounters with a live female (j), shown as in f. k, Mean FR of PAG neurons
275
normalized to baseline FR (two-sided paired t-test: Live song: t(21) = 3.439, P = 0.002;
276
Playback: t(25) = 0.278, P = 0.783; Live tutor: t(21) = 1.270, P = 0.218; Live female: t(19) =
277
1.339, P = 0.196; n = 26 neurons, 5 birds). Error bars indicate mean ± SEM.
278 279
280
Figure 2 | Imaging of DA in HVC.
281
a, Schematics of two-photon imaging of DA sensors (GRABDA1h) in HVC. b, Two-photon
282
image of HVC neurons expressing DA sensors. c, Fluorescence changes (ΔF/F) of GRABDA1h
283
in a juvenile's HVC neuron in response to live tutor songs (red bars) d, ΔF/F aligned to the
284
onset of live tutor songs (gray: individual, black: mean). e-h, ΔF/F aligned to the onset of song
285
playback (e), encounters with a live, non-singing tutor (f), encounters with a live female (g),
286
and live tutor songs after 6-OHDA injection into PAG (h). i, Mean ΔF/F of HVC neurons
(two-287
sided paired t-test: Live song: t(4) = 3.660, P = 0.022; Playback: t(4) = 0.261, P = 0.807; Live
288
tutor: t(4) = 1.092, P = 0.336; Live female: t(4) = 1.589, P = 0.187; Live song after 6-OHDA
289
injection into PAG: t(7) = 1.122, P = 0.324; n = 13 neurons, 5 birds). Error bars indicate mean
290
± SEM.
291 292
293
Figure 3 | Chemical blockade and optogenetic activation of DA signaling in HVC.
294
a, DA fibers in HVC (pseudo-colored magenta: TH) (~2.4 mm lateral). b, Timeline and
295
schematics of 6-OHDA injection into HVC. c, Loss of DA fibers in HVC after 6-OHDA
296
injection at 29 d, as in a (~2.4 mm lateral). d, From top to bottom, spectrograms of a song from
297
the tutor bird and songs from 90-d pupil birds that received injection into HVC of vehicle,
6-298
OHDA at ~30 d, or 6-OHDA at ~45 d (red bars denote abnormally long syllables. See Extended
299
Data Fig. 4b-c). e, Absence of song copying following injection of 6-OHDA into HVC at ~30
300
d (Tukey-Kramer test: vehicle: n = 7, 6-OHDA: n = 7; at 90 d: P < 0.001). f, Normal levels of
301
song copying were achieved following injection of 6-OHDA into HVC at ~45 d (Tukey-Kramer
test: vehicle: n = 7 [same birds as in e], 6-OHDA at 45 d: n = 6; at 90 d: P = 1.000). g, Timeline
303
of DA blocker infusion into HVC using microdialysis. h, Tutor song similarity of 90-d pupils
304
that received infusion into HVC of vehicle during tutoring (n = 5), DA blockers during tutoring
305
Kramer test: vs. vehicle: P = 0.011, n = 5), D1-type blocker during tutoring
(Tukey-306
Kramer test: vs. vehicle: P < 0.001, n = 5), or DA blockers after tutoring (Tukey-Kramer test:
307
vs. vehicle: P = 1.000; n = 5). i, Schematics of PAGHVC terminal activation paired with song
308
playback. j, Song copying is facilitated by pairing playback with PAGHVC terminal activation
309
in tutor-naive juveniles (Tukey-Kramer test: ChR2: n = 6; control: n = 6; at 90 d: P = 0.023).
310
Horizontal red dashed lines in e, f, h, and j show song similarity between 90-d untutored birds
311
to unrelated adults (See Extended Data Fig. 4b-c). Error bars indicate mean ± SEM.
312 313
314
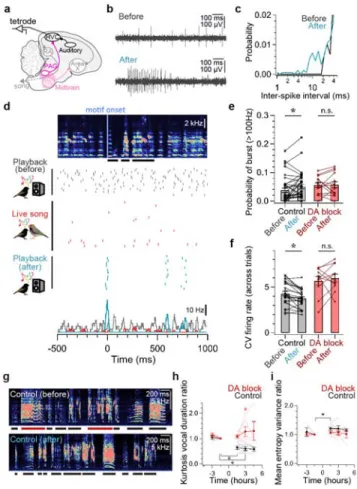
Figure 4 | Changes in HVC activity and song features after live tutoring.
315
a, Schematic of HVC recordings in pupils. b-c, Spontaneous HVC unit activity (b) and the
316
histogram of the interspike intervals before (black) and after (cyan) live tutoring (c). d, HVC
317
unit activity aligned to tutor song motif onset (top: averaged spectrogram; middle: raster,
318
bottom: mean FR across trials; horizontal bars: syllables). e, Probability of burst activity (>100
319
Hz) increased after live tutoring in control juveniles (two-sided paired t-test: t(34) = 2.490, P
320
= 0.018, n = 35 neurons, 4 birds), but not in juveniles with 6-OHDA injected into HVC
sided paired t-test: t(13) = 0.774, P = 0.453, n = 14 neurons, 2 birds). f, Coefficients of variance
322
(CV) of firing rate across trials increased in control juveniles (two-sided paired t-test: t(25) =
323
4.080, P < 0.001, n = 26 neurons, 4 birds), but not in juveniles with 6-OHDA injected into
324
HVC (two-sided paired t-test: t(10) = 0.640, P = 0.537, n = 11 neurons, 2 birds). g,
325
Spectrograms of juvenile songs before (top) and after (bottom) live tutoring (red bar: long
326
vocalization). h, After live tutoring, kurtosis of vocal duration decreased in control juveniles
327
(two-sided paired t-test: 1.5 h: t(5) = 5.563, Bonferroni corrected P = 0.008, n = 6), but not in
328
juveniles with 6-OHDA or DA blockers injected into HVC (two-sided paired t-test: 1.5 h: t(5)
329
= 1.364, Bonferroni corrected P = 0.692, n = 6). i, After live tutoring, mean Wiener entropy
330
variance (EV) increased in control juveniles (two-sided paired t-test: at 1.5 h: t(5) = 4.059,
331
Bonferroni corrected P = 0.029, n = 6), but not in juveniles with 6-OHDA or DA blockers
332
injected into HVC (two-sided paired t-test: at 1.5 h: t(5) = 1.432, Bonferroni corrected P =
333
0.635, n = 6). Juveniles did not sing during tutoring (0-1.5 h. See Extended Data Fig. 9). Error
334
bars indicate mean ± SEM.
335 336
Methods
337
Animal model
338
Juvenile male (15-90 d), adult male (>200 d), and adult female (>200 d) zebra finches
339
(Taeniopygia guttata) were obtained from the Duke University Medical Center breeding
340
facility. All experimental procedures were in accordance with the NIH guidelines and approved
341
by the Duke University Medical Center Animal Care and Use Committee. Birds were kept
342
under a 14/10-h light/dark cycle with free access to food and water. Data were collected from
343
96 birds (Supplementary Table).
344
Song analysis
345
Songs were automatically recorded with Sound Analysis Pro (SAP2011)31 in a soundproof box.
346
Vocalizations of >10 ms were detected by thresholding of the recorded sounds. Imitation of the
347
tutor song was quantified as percent similarity (asymmetrical similarity) between the song
348
motifs from pupil birds and their tutors using SAP201131 with default parameters for zebra
349
finches, and reported as tutor song similarity. First, the song motif (a stereotyped sequence of
350
syllables constituting an adult zebra finch song) of each bird was determined as the most
351
frequently observed syllable sequence. Then, percent similarity was calculated for
352
representative song motifs randomly chosen from pupils and their tutor, and averaged across
353
≥10 comparisons to report as tutor song similarity. For immature subsongs that do not have a
354
stereotyped song motif, we used randomly chosen part of subsongs with the duration similar to
355
the tutor song motif for calculating percent similarity. For isolated birds in Extended Data Fig.
356
4c, percent similarity was calculated between the song motifs from isolated birds and unrelated,
357
normally raised adult zebra finches. A song bout was detected as successive vocalizations with
358
≥3 syllables (to exclude call bouts) separated by an inter-bout interval of >400 ms. Kurtosis of
359
vocal duration and Wiener entropy variance (EV) were calculated based on all the song bouts
360
in each 90-minute time window.
361
Tutoring of juvenile birds
362
Juvenile birds were raised by their parents with their siblings until ~45 d in experiments
363
depicted in Fig. 3a-f. Otherwise, juvenile birds were separated from their parents and siblings
364
at 15-30 d (i.e., tutor-naive juveniles), and encountered an unfamiliar adult male (tutor) only
365
during tutoring sessions. During a tutoring session, a juvenile bird and tutor were separated by
366
a plastic grating or transparent glass, so they could acoustically and visually interact but direct
367
physical interactions were prevented. The tutor was either manually introduced into the
368
neighboring chamber by an experimenter, or presented through an electric glass whose
369
transparency can be remotely controlled. Attention of juvenile birds to the tutor was quantified
370
as the time that juvenile birds were awake and near the tutor without foraging, drinking,
371
preening, or singing, and normalized to the total time of observation (>5 min) during tutoring
sessions. Untutored isolated birds depicted in Extended Data Fig. 4b-c were kept isolated from
373
adult males until 90 d.
374
General surgery
375
Detailed procedures of surgery were previously provided23. Briefly, juvenile birds were
376
anesthetized with 2% isoflurane inhalation and placed on a custom stereotaxic apparatus with
377
a heat blanket. Target cites for injection and implantation were determined by stereotaxic
378
coordinates and multiunit activity. Stereotaxic coordinates were [0.0 mm rostoral, 2.4 mm
379
lateral, and 0.5 mm ventral] for HVC; [3.4 mm rostral, 0.5 mm lateral, and 6.3 mm ventral
380
(head angle: 58°)] for PAG; [5.8 mm rostral, 1.6 mm lateral, and 3.0 mm ventral (head angle:
381
40°)] for Area X; and [1.3 mm rostral, 1.2 mm lateral, and 0.5 mm ventral] for CM. Reagents
382
or viruses were injected using Nanoject-II (Drummond Scientific). Viral injection was
383
performed bilaterally with the volume of 483-966 nL per hemisphere. Viruses were obtained
384
from the Penn Vector Core (Pennsylvania, USA), UNC Vector Core (Chapel Hill, USA),
385
Janelia Virus Service Facility (Ashburn, USA), and Vigene Biosciences (Rockville, USA).
386
Experiments were performed >30 d after the viral injection. Birds with unsuccessful injection
387
or implantation were discarded from the analysis.
388
Injection of 6-OHDA
389
Juvenile birds received bilateral injection of 200-450 nL 6-OHDA solution into HVC at either
390
~30 d (mean ± SD: 30.1 ± 4.2 d, range: 25-34 d, n = 7) or ~45 d (mean ± SD: 44.5 ± 3.0 d,
391
range: 39-47 d, n = 6). The solution was PBS-based and included 5-20 mM 6-OHDA
392
hydrochloride (Santa Cruz, sc-203482), 10 mM L-ascorbic acid (MilliporeSigma, A92902),
393
and 1 µM desipramine hydrochloride (Tocris, 3067), which was included as an inhibitor for
394
noradrenaline and serotonin transporters to protect noradrenergic and serotonergic neurons at
395
the injection site. Control birds received injection of PBS with 10 mM ascorbic acid and 1 µM
396
desipramine at ~30 d (mean ± SD: 29.3 ± 3.6 d, range: 22-32 d, n = 7). Drugs were dissolved
397
into PBS immediately before injection in place of equimolar NaCl (Working solution: ~300
398
mOsm, pH 7.3). After injection, birds were returned to their original home cage until ~45 d
399
when they were isolated in a soundproof box until 90 d.
400
Microdialysis infusion of drugs
401
Tutor-naive juveniles (~45 d, mean ± SD: 43.8 ± 5.5 d, range: 32-57 d, n = 34) received bilateral
402
implantation of a microdialysis probe. After 1-3 d of implantation (mean ± SD: 45.5 ± 5.8 d,
403
range: 33-60 d, n = 34), tutoring sessions were conducted for 5 consecutive days. Each tutoring
404
session consisted of 90-minute tutor presentation. Drug was infused into the target area (HVC,
405
Area X, CM, or PAG) either 90 minutes before or immediately after the tutor presentation, and
406
washed with saline 180 minutes after the injection (Fig. 3g). The tutor bird typically sang >30
407
motifs in a session (See Extended Data Fig. 5e). For a session in which the tutor did not sing
408
any song, an additional tutoring session was conducted on the next day. As a blocker for D1-
409
and D2-type receptors, 5 mM R(+)-SCH-23390 hydrochloride (MilliporeSigma, D054) and 5
mM S-(-)-sulpiride (Tocris, 0895) were respectively used and dissolved into saline. To
411
inactivate PAG, 2.5 mM muscimol (MilliporeSigma, M-1523) dissolved into saline was infused
412
into the PAG.
413
Histology and imaging
414
Birds were deeply anesthetized with intramuscular injection of 20 μL Euthasol (Virbac) and
415
transcardially perfused with PBS, followed by perfusion with 4% (wt/vol) paraformaldehyde
416
(PFA) in PBS. The removed brain was post-fixed and cryoprotected with 30% (wt/vol) sucrose
417
and 4% (wt/vol) PFA in PBS overnight. Frozen sagittal sections (thickness of 50 μm) were
418
prepared with a sledge microtome (Reichert) and collected in PBS. For immunohistochemistry,
419
sections were washed twice in PBS, permeabilized with 0.3% Triton X-100 in PBS (PBST) for
420
1 h, blocked with 10% Blocking One Histo (06349-64, Nacalai Tesque) in PBST for 1 h, and
421
incubated with rabbit primary antibody for TH (1:500, AB152; MilliporeSigma) or rabbit
422
primary antibody for DBH (1:2000, #22806; ImmunoStar) in PBST with 10% Blocking One
423
Histo at 4 °C overnight. Then, sections were washed three times in PBST and incubated with
424
anti-rabbit secondary antibody (1:500; Jackson ImmunoResearch) in PBST at room
425
temperature for 1 h, followed by three washes in PBS. Sections were coverslipped with
426
Fluoromount-G (SouthernBiotech), and then imaged with a confocal microscope (SP8; Leica)
427
through a 20x objective lens controlled by LAS X software (Leica). To label PAG neurons that
428
project to HVC or Area X, dextran Alexa Fluor 488 (D-22910; ThermoFisher) was injected
429
into HVC or Area X of juvenile birds (Age: mean ± SD: 35.3 ± 7.0 d, range: 28-42 d, n = 3 for
430
HVC, Age: mean ± SD: 47.7 ± 15.3 d, range: 36-65 d, n = 3 for Area X) 4–7 d before perfusion.
431
Retrogradely labeled neurons were manually counted in PAG and SNc/VTA, each of which
432
was densely packed with TH-positive (TH+) neurons. Images were shown as max-projected
433
images of sagittal sections. To quantify TH+ fibers in HVC, TH+ fibers in HVC shelf/NCL,
434
and DBH+ fibers in HVC, the fiber density was calculated in >0.04 mm2 areas from each region
435
as the fraction of areas with the fluorescence more than [mean + 10 SD] of the background
436
fluorescence. For analysis on HVC shelf/NCL, a >0.04 mm2 region located ~0.6 mm ventral
437
from HVC was manually selected.
438
Two-photon imaging and analysis
439
Viruses coding DA sensors (AAV2/9-hSyn-GRABDA1h or AAV2/9-CAG-GRABDA1h),
440
developed in Yulong Li's lab19, were injected into HVC of tutor-naive juveniles (~30 d, mean
441
± SD: 32.6 ± 5.3 d, range: 25-39 d, n = 5), and HVC was imaged after implantation of a
head-442
post and cranial window >30 days later (mean ± SD: 66.6 ± 6.0 d, range: 60-73 d, n = 5). To
443
ablate DA-releasing PAG neurons, 200 nL 6-OHDA solution (10 mM 6-OHDA, 10 mM
L-444
ascorbic acid, and 1 µM desipramine hydrochloride) was injected into PAG 2 days before
445
imaging. Images were collected at 15.5 Hz with a resonant scanning two-photon microscope
446
(Neurolabware) that applies a mode-locked titanium sapphire laser (Mai Tai DeepSee) at 920
447
nm through a 16x objective lens (0.8 NA water immersion, Nikon). The objective lens was
covered with black cloth to prevent room light from being detected by the photomultipliers.
449
During imaging, a head-fixed bird in a dim room experienced playback of an adult zebra finch
450
(tutor) song bout (3 seconds. 7 introductory notes and 3 motifs comprising 5 syllables),
451
encounters with an adult male tutor, encounters with an adult female bird, and a singing tutor
452
with a randomized order. Images were acquired >10 trials for each condition, and regions of
453
interest (ROIs) were automatically or manually selected after image alignment with MATLAB
454
programs (Scanbox). After subtraction of background fluorescence in an annular region
455
surrounding each ROI, signals were calculated as mean fluorescence within each ROI. Then,
456
ΔF/F of the ROI was calculated for each trial as 100 * (F(t) - F0) / F0 [%], where F(t) was a 457
time series of ROI signals, and F0 was the average of baseline ROI signals for the 5 s-period 458
just before the onset of stimulus presentation. Mean ΔF/F was calculated for the 5 s-period
459
after the onset of stimulus presentation, and averaged across trials in each condition.
460
Optogenetics
461
Tutor-naive juvenile birds received injection of either AAV2/9-CAG-ChR2-mCherry,
AAV2/1-462
CAG-ChR2-mCherry, or AAV2/9-CAG-NRX-ChR2-YFP to PAG at ~35 d (mean ± SD: 34.0
463
± 4.8 d, range: 30-40 d, n = 9). Laser was bilaterally applied through optic fibers (core: 200
464
µm; Thorlabs) implanted to HVC. Juvenile birds received a tutoring session per day for 5
465
consecutive days starting at ~60-70 d (mean ± SD: 64.0 ± 4.9 d, range: 61-71 d, n = 9). In each
466
tutoring session, a juvenile bird experienced playback of a song bout (mean amplitude: 70 dB
467
SPL, 7 introductory notes and 3 motifs comprising 5 syllables) 10 times (30 motifs) within 30
468
minutes. To block DA signaling in HVC, DA blockers were infused into HVC with
469
microdialysis probes 90 minutes before the tutoring session, and washed with saline
470
immediately after the tutoring session (n = 3). Experimental birds received repetitive laser
471
stimulation (10 ms; 20 Hz) throughout the playback. Control birds consisted of a group that
472
received injection of viruses coding GFP and implantation of optic fibers (n = 2,
scAAV2/9-473
CMV-GFP or AAV2/9-CAG-GFP) at ~35 d (mean ± SD: 36.5 ± 6.4 d, range: 32-41 d, n = 2),
474
a group that did not receive viral injection but implantation of optic fibers (n = 2), and a group
475
that did not receive injection, implantation, or laser stimulation (n = 2). These groups listened
476
to playback in the same way as experimental birds (Age: mean ± SD: 58.5 ± 8.5 d, range:
54-477
73 d, n = 6), and were analyzed together since we did not find significant differences in learning
478
abilities between these groups.
479
Chronic recording from PAG and HVC
480
Tetrodes (A2x2-tet-3/10mm-150-150-121, NeuroNexus) were implanted into the HVC or the
481
PAG of tutor-naive juveniles (Age: mean ± SD: 51.3 ± 13.4 d, range: 27-71 d, n = 11). Birds
482
were habituated to a dummy probe (1.5-2 g) on the head for ~7 d before the implantation. Data
483
were collected with a universal serial bus (USB) interface board (RHD2000; Intan
484
Technologies) after band-pass filtering (0.2–10 kHz) and sampling at 30 kHz with a small
485
amplifier board (RHD2132 16-Channel; Intan Technologies) on the bird’s head. Unit activity
was sorted in a semi-automated fashion with a custom C++ software using a support vector
487
machine algorithm (M.T.). Unit activity with a mean amplitude >3 SD of noise was used for
488
subsequent analysis. Recording of song-related activity was triggered by xpctarget in
489
MATLAB (MathWorks). To block DA signaling in HVC, juvenile birds received an injection
490
of 6-OHDA into HVC 2-5 days before tetrode recording from the same HVC. Mean FR of PAG
491
neurons was calculated for >10 trials with >0.5 seconds after the onset of singing or song
492
playback and 5 s after presentation of a male or female bird, and averaged after normalization
493
with mean spontaneous FR calculated for >10 seconds before the presentation of stimuli.
494
Probability of burst activity in HVC neurons was calculated for >300 s spontaneous activity
495
before and after exposure to a live tutor. CV FR across trials of HVC neurons was calculated
496
for 50 ms-bin with a hop size 1 ms across >15 trials, and reported as average of CV FR from
497
all the bins in the motif (>0.5 seconds) if the mean FR during playback was >0.05 Hz. For data
498
analysis, Igor Pro (WaveMetrics), MATLAB, and Microsoft Excel were used.
499
Statistics
500
Error bars and values in the text indicate mean ± standard error of mean (SEM), unless
501
otherwise noted. Two-way ANOVA was performed in MATLAB to examine significance of
502
the main effect of 6-OHDA (F(2,85) = 53.10, P < 0.001) (Fig. 3e-f), DA blockers to HVC, DA
503
blockers to CM, and muscimol to PAG (F(5,99) = 23.17, P < 0.001) (Fig. 3h and Extended
504
Data Fig. 5c, h, k), DA blockers to Area X (F(1,30) = 0.22, P = 0.640) (Extended Data Fig. 6c),
505
optogenetic activation of PAG terminals in HVC (F(2,47) = 16.61, P < 0.001) (Fig. 3j and
506
Extended Data Fig. 7f), followed by post-hoc Tukey-Kramer test to report significant
507
difference between conditions at each age window. To examine the different proportion of
508
labeled neurons in PAG and VTA/SNc, χ2-tests were performed. Two-way ANOVA was
509
performed in MATLAB to examine significance of the main effect of blockage of DA signaling
510
on kurtosis syllable duration (F(1,39) = 19.69, P < 0.001) (Fig. 4h), entropy variance (F(1,39)
511
= 4.84, P = 0.034) (Fig. 4i), and song rate (F(1,39) = 0.16, P = 0.691) (Extended Data Fig. 9),
512
followed by Tukey-Kramer test to report significant difference between conditions at each time
513
window, and by paired t-test with Bonferroni correction to report significant difference between
514
before and after exposure to tutor songs. One-way ANOVA was performed in MATLAB to
515
examine the main effect of different conditions in Fig. 1k and Extended Data Fig. 2b (F(4,93)
516
= 6.84, P < 0.001), Fig. 2i (F(4,23) = 10.31, P < 0.001), Extended Data Fig. 3c (F(2,12) =
517
13.42, P < 0.001), Extended Data Fig. 3d (F(2,12) = 0.14, P = 0.870), Extended Data Fig. 4a
518
(F(2,17) = 0.28, P = 0.757), Extended Data Fig. 5d (F(2,7) = 30.40, P < 0.001), and Extended
519
Data Fig. 5e (F(2,10) = 0.78, P = 0.486), each followed by Tukey-Kramer test to report
520
significant difference between conditions. In other analyses, paired t-test (Figs. 1k, 2i, 4h,i,
521
Extended Data Figs. 2b, 8d-f) or unpaired t-tests (Extended Data Figs. 3e, 4c) were performed
522
in Microsoft Excel. Multiple data from a bird are indicated with the same markers in Figs.
523
1c,g,k, 2i, 4e,f and Extended Data Figs. 1b,c,e,f,g, 2b, 3c-e, 8d-f. Statistical tests performed
were two-sided. Asterisks show P < 0.050.
525
Code availability
526
Custom code or software is available from the corresponding author upon reasonable request.
527
Method references
528
31 Tchernichovski, O., Nottebohm, F., Ho, C. E., Pesaran, B. & Mitra, P. P. A procedure
529
for an automated measurement of song similarity. Anim Behav 59, 1167-1176,
530
doi:10.1006/anbe.1999.1416 (2000).
531 532
Extended Data figure legends
533
534
Extended Data Figure 1 | Distribution of HVC-projecting neurons and Area X-projecting
535
neurons in the midbrain.
536
a, From left to right, a max-projected image of serial sagittal sections visualized with a confocal
537
microscope, showing a lateral part of PAG (lPAG) (~1.0 mm lateral), a medial part of PAG
538
(mPAG, ~0.2 mm lateral), SNc (~1.2 mm lateral), and VTA (~0.2 mm lateral), each of which
539
was labeled with dextran injected into HVC (green) and an antibody for TH (pseudo-colored
540
magenta). Similar results were obtained in 4 independently repeated experiments (R: rostral,
541
V: ventral). b, Proportion of HVC-projecting neurons in PAG and VTA/SNc (χ2-test: χ2(1) =
542
406.54, P < 0.001, n = 4 hemispheres from 3 birds). c, Proportion of TH-positive (TH+)
543
neurons in HVC-projecting neuron subsets in PAG and VTA/SNc (χ2-test: χ2(1) = 204.62, P <
544
0.001, n = 4 hemispheres from 3 birds). d, From left to right, a max-projected image of serial
545
sagittal sections visualized with a confocal microscope, showing PAG (~0.6 mm lateral), SNc
546
(~0.6 mm lateral), and VTA (~0.2 mm lateral), each of which was labeled with dextran injected
547
into Area X (green) and an antibody for TH (pseudo-colored magenta). Similar results were
548
obtained in 3 independently repeated experiments. e, Proportion of double-labeled neurons
549
(dextran and TH) in PAG and SNc/VTA (χ2-test: χ2(1) = 493.92, P < 0.001, n = 3 hemispheres
550
from 3 birds) in birds that received injection of dextran into Area X. f, Proportion of Area
X-551
projecting neurons in PAG and VTA/SNc (χ2-test: χ2(1) = 472.07, P < 0.001, n = 3 hemispheres
552
from 3 birds). g, Proportion of TH+ neurons in Area X-projecting neuron subsets in PAG and
553
VTA/SNc (χ2-test: χ2(1) = 55.14, P < 0.001, n = 3 hemispheres from 3 birds). Error bars indicate
554
mean ± SEM.
555 556
557
Extended Data Figure 2 | Juvenile male PAG activity in response to song playback in the
558
presence of a female bird and live songs of a male bird.
559
a, Tutor-naive juvenile male finch PAG activity aligned to the onset of 35 presentations of song
560
playback in the presence of an adult female bird (top: averaged sound spectrogram, middle:
561
spike raster plot, bottom: mean firing rate). b, Mean firing rate (FR) during presentation of
562
song playback in the presence of a female bird, normalized to baseline FR (two-sided paired
t-563
test: t(7) = 0.620, P = 0.555; n = 8 neurons from 2 birds). c, PAG activity during a tutor song
564
bout (top: sound spectrogram, middle: voltage recording, bottom: firing rate, blue bar: song
565
motif). d, PAG unit activity aligned to the offset of a live tutor's song bouts (red bar: live song),
566
shown as in a. e, A max-projected image of serial sagittal sections visualized with a confocal
567
microscope, showing the site of tetrode recordings in PAG (~0.8 mm lateral of the midline). f,
568
PAG unit activity aligned to the onset of live tutor's song motifs, shown as in a. Note that the
569
tutor often sings multiple motifs within a single bout, thus some motifs precede (and follow)
570
the alignment time. Error bars indicate mean ± SEM.
571 572
573
Extended Data Figure 3 | Effects of 6-OHDA injection into HVC on DA fibers in HVC
574
and surrounding regions and on noradrenergic/adrenergic fibers in HVC
575
a, From left to right, a max-projected image of serial sagittal sections visualized with a confocal
microscope, showing HVC with TH immunolabeling (~2.4 mm lateral), HVC shelf and
577
caudolateral nidopallium (NCL) just ventral to HVC with TH immunolabeling (~2.4 mm
578
lateral), and HVC with dopamine beta-hydroxylase (DBH) immunolabeling (~2.4 mm lateral)
579
in control birds, which received injection of vehicle into HVC. Similar results were obtained
580
in 5 independently repeated experiments (orientation is similar to b). b, From left to right, a
581
max-projected image of serial sagittal sections visualized with a confocal microscope, showing
582
HVC with TH immunolabeling (~2.4 mm lateral), HVC shelf and NCL just ventral to HVC
583
with TH immunolabeling (~2.4 mm lateral), and HVC with DBH immunolabeling (~2.4 mm
584
lateral) in birds that received injection of 6-OHDA into HVC 2 days before tissue fixation.
585
Similar results were obtained in 4 independently repeated experiments (D: dorsal, R: rostral).
586
c, Density of TH-positive (TH+) fibers in HVC of control birds (n = 5 hemispheres from 3
587
birds) was higher than that of birds that received injections of 6-OHDA 2 days before fixation
588
(Tukey-Kramer test: P = 0.002) (n = 4 hemispheres from 2 birds), and that of birds that received
589
injections of 6-OHDA ~60 days before fixation, as in Fig. 3b-c (Tukey-Kramer test: P = 0.002)
590
(n = 6 hemispheres from 4 birds). d, Density of TH+ fibers in HVC shelf and NCL in control
591
birds (n = 5 hemispheres from 3 birds), birds that received injection of 6-OHDA 2 days before
592
fixation (n = 4 hemispheres from 2 birds), and birds that received injection of 6-OHDA ~60
593
days before fixation, as in Fig. 3b-c (n = 6 hemispheres from 4 birds). e, Density of
DBH-594
positive (DBH+) fibers in HVC in control birds (n = 4 hemispheres from 2 birds) and birds that
595
received injection of 6-OHDA 2 days before injection (n = 4 hemispheres from 2 birds) was
596
not significantly different (two-sided unpaired t-test: t(7) = 0.379, P = 0.716). Error bars
597
indicate mean ± SEM.
598 599
600
Extended Data Figure 4 | Ablation of DA terminals in HVC did not affect song rate but
601
decreased song imitation to the level of birds raised in isolation from a tutor.
602
a, The song rates of birds that received injection of vehicle (n = 7), 6-OHDA at ~30 d (n = 7),
603
and 6-OHDA at ~45 d (n = 6) were not significantly different (one-way ANOVA: F(2,17) =
604
0.283, P = 0.757). b, Spectrograms from a 90-d bird that was raised in isolation from a tutor
605
(top) and from a 90-d bird that was normally tutored but received injection of 6-OHDA into
606
HVC at 30 d (bottom). c, Similarity of 90-d untutored (Isolated) birds’ songs to songs of
607
unrelated adult zebra finches that had been normally tutored (n = 3) was not significantly
different from tutor song similarity of 90-d pupils that received injection of 6-OHDA into HVC
609
at ~30 d (n = 7) (two-sided unpaired t-test: t(9) = 0.013, P = 0.990), but was significantly
610
different from tutor song similarity of 90-d pupils that received injection of vehicle at ~30 d (n
611
= 7) (t(9) = 3.028, P = 0.014), or from tutor song similarity of 90-d pupils that received injection
612
of 6-OHDA into HVC at ~45 d (n = 6) (two-sided unpaired t-test: t(8) = 3.314, P = 0.011) (song
613
data from birds injected with 6-OHDA into HVC at ~30 d is same as Fig. 3e; song similarity
614
data from birds injected in HVC with vehicle at ~30 d or 6-OHDA at ~45 d are not shown here
615
but are shown in Fig. 3f). Error bars indicate mean ± SEM.
616 617
618
Extended Data Figure 5 | Effects of infusing DA blockers into HVC or CM and infusing
619
muscimol into PAG on song copying.
620
a, Schematics showing infusion of DA blockers into HVC. b, From top to bottom, sound
621
spectrograms of a song of a tutor bird, a 90-d pupil that received infusion of vehicle during
622
tutoring sessions, a 90-d pupil that received infusion of both D1- and D2-type DA blockers
(DA blockers) during tutoring sessions, a 90-d pupil bird that received infusion of D1-type
624
blocker during tutoring sessions, and 90-d pupil that received infusion of both D1- and
D2-625
type DA blockers after tutoring sessions. c, Developmental changes in tutor song similarity of
626
pupils that received infusion of both D1- and D2-type DA blockers (DA blockers) into HVC
627
during tutoring sessions (top, n = 5), a D1-type blocker into HVC during tutoring sessions
628
(middle, n = 5), or DA blockers into HVC immediately after tutoring sessions (bottom, n = 5).
629
Asterisks indicate P < 0.050 with Tukey-Kramer test (See Methods). d, Proportion of time that
630
juvenile birds attended to the tutor during tutoring sessions was not significantly different
631
between birds that received vehicle (n = 3) or DA blockers into HVC (n = 4) (Tukey-Kramer
632
test: P = 0.871). The attention time of juvenile birds that received infusion of muscimol into
633
PAG (n = 3) was lower than that of control birds (Tukey-Kramer test: P = 0.001) and that of
634
birds that received injection of DA blockers into HVC (Tukey-Kramer test: P < 0.001). e,
635
Singing rates of the tutor bird to pupils that received vehicle into HVC (n = 5) were not different
636
from that to pupils that received injection of DA blockers into HVC (n = 5) or muscimol into
637
PAG (n = 3) (one-way ANOVA: F(2,10) = 0.776, P = 0.486). f, Schematics showing infusion
638
of muscimol into PAG. g, A sound spectrogram of a song of a 90-d pupil that received infusion
639
of muscimol into PAG during tutoring sessions. A sound spectrogram of the tutor song is shown
640
in b. h, Tutor song similarity of pupil birds that received infusion of vehicle into HVC and
641
birds that received infusion of muscimol blockers into PAG were significantly different
(Tukey-642
Kramer test: vehicle: n = 5, muscimol to PAG: n = 3; at 90 d: P = 0.007). i, Schematics showing
643
infusion of DA blockers into CM (DA blockers possibly diffused into both the medial and
644
lateral CM). j, A sound spectrogram of a song of a 90-d pupil that received infusion of DA
645
blockers into CM during tutoring sessions. A sound spectrogram of the tutor song is shown in
646
b. k, Tutor song similarity of pupil birds that received infusion of vehicle into HVC and birds
647
that received infusion of DA blockers into CM were not significantly different (Tukey-Kramer
648
test: vehicle: n = 5, DA blockers to CM: n = 3; at 90 d: P = 1.000). Horizontal red dashed lines
649
in c, h, and k show song similarity between 90-d untutored birds and unrelated adult male zebra
650
finches that had been raised with normal exposure to a tutor (See Extended Data Fig. 4b-c).
651
Error bars indicate mean ± SEM.
652 653
654
Extended Data Figure 6 | Infusion of DA blockers into Area X in juvenile males did not
disrupt song copying.
656
a, Schematics (top) and schedule (bottom) of infusion of DA blockers into Area X. b, Sound
657
spectrograms of a song of a tutor (top), a 90-d bird that received infusion of vehicle into Area
658
X during tutoring sessions (middle), and a 90-d bird that received infusion of DA blockers into
659
Area X during tutoring sessions (bottom). c, Tutor song similarity of pupil birds that received
660
infusion of vehicle into Area X and birds that received infusion of DA blockers into Area X
661
were not significantly different (Tukey-Kramer test: vehicle: n = 4, DA blockers: n = 4; at 90
662
d: P = 1.000). The horizontal red dashed line shows song similarity between 90-d untutored
663
birds and unrelated adult male zebra finches that had been raised with normal exposure to a
664
tutor (See Extended Data Fig. 4b-c). Error bars indicate mean ± SEM.
665 666
667
Extended Data Figure 7 | Optogenetic activation of PAGHVC terminals paired with song
668
playback.
669
a, Schematics (left) and schedule (right) of optogenetic stimulation of PAGHVC terminals paired
670
with song playback. b, Sound spectrograms of song playback used in tutoring sessions (top), a
671
song of a 90-d pupil tutored by song playback without viral injection and laser stimulation
672
(upper middle), and 90-d pupils that received activation of PAGHVC terminals paired with song
673
playback (lower middle and bottom). c, From left to right, a max-projected image of serial
sagittal sections of PAG (left, ~0.5 mm lateral), showing PAG neurons expressing both ChR2
675
(green) and TH (pseudo-colored magenta) (arrows), SNc (middle, ~0.8 mm lateral), and VTA
676
(right, ~0.3 mm lateral). Similar results were obtained in 6 independently repeated experiments.
677
d, Multiunit activity in PAG, showing time-locked response to laser stimulation at 2 Hz (top)
678
and 20 Hz (bottom). e, Schematics of optogenetic stimulation of PAGHVC terminals paired with
679
song playback while infusing DA blockers into HVC. f, Tutor song similarity of pupils that
680
received activation of PAGHVC terminals paired with song playback while infusing DA blockers
681
into HVC (red, n = 3) was not different from control birds shown in Fig. 3j (Tukey-Kramer
682
test: at 90 d: P = 1.000), but lower than that received activation of PAGHVC terminals paired
683
with song playback shown in Fig. 3j (Tukey-Kramer test: at 90 d: P = 0.019). g, A sound
684
spectrogram of a 90-d pupil that received optogenetic activation of PAGHVC terminals paired
685
with song playback while infusing DA blockers into HVC. A sound spectrogram of the song
686
playback used in tutoring sessions is shown in b. Error bars indicate mean ± SEM.
687 688
689
Extended Data Figure 8 | Spike activity of HVC neurons in juvenile male zebra finches
690
before and after their first exposure to live tutor songs.
691
a-c, Action potential activity of an HVC neuron to tutor song playback before exposure to a
692
singing tutor (a), to live tutor songs (b), and to tutor song playback after exposure to live tutor
693
songs (c) (top: sound spectrogram, bottom: voltage recording, bottom right: exemplar 50 spikes
694
[gray] and their average [black]. circle: individual spike. blue bar: tutor song motif). d,
695
Spontaneous firing rate (FR spont) of HVC neurons of juvenile males before and after exposure
696
to live tutor songs (two-sided paired t-test: Mean FR. Before: 1.6 ± 0.3 Hz; After: 1.6 ± 0.4 Hz;
t(34) = 0.794, P = 0.433, n = 35, 4 birds). e, Firing rate of juvenile male HVC neurons during 698
playback of tutor songs (FR during playback) before and after exposure to live tutor songs
699
(two-sided paired t-test: Mean FR. Before: 2.0 ± 0.6 Hz; After: 2.1 ± 0.6 Hz; t(34) = 0.468, P
700
= 0.643, n = 35, 4 birds). f, Changes in firing rate (ΔFR) of juvenile HVC neurons in response
701
to playback of tutor songs before and after exposure to live tutor songs (two-sided paired
t-702
test:ΔFR. Before: 0.5 ± 0.4 Hz; After: 0.5 ± 0.2 Hz; t(34) = 0.079, P = 0.937, n = 35, 4 birds).
703 704
705
Extended Data Figure 9 | Song rates of juvenile birds before and after their first tutoring
706
sessions.
707
a, Ratio of song bouts produced before and after the first tutoring session in control birds (black,
708
n = 6) and in birds that received injection of 6-OHDA injections into HVC several days prior 709
to the tutoring session or that were infused with DA blockers into HVC immediately before
710
and during the tutoring session (red, n = 6) . Error bars indicate mean ± SEM.
711 712
713
Extended Data Figure 10 | Summary diagram.
714
a, The song of a live adult tutor (i.e., a suitable model) activates auditory afferents and
DA-715
releasing PAG afferents to HVC, leading to potentiation and stabilization of auditory synapses
716
in HVC. This plastic change forms temporally precise coding of the tutor songs and increases
717
the occurrence of bursting activity in HVC, which rapidly alters temporal and spectral features
718
of the pupil's vocalization in manner that drives imitation. b, Playback of an adult male song
719
without social cues (i.e., extraneous sound) only activates auditory afferents in HVC. The
720
activation of these auditory inputs by itself can neither alter HVC activity nor drive song
721
learning, similar to the condition where DA signaling in the pupil’s HVC is blocked during the
722
juvenile’s exposure to a live, singing tutor.
Supplementary Video 1 | Social interaction of a pupil with vehicle in HVC
725
Social interaction of a juvenile bird that received infusion of vehicle into HVC during a tutoring
726 session. 727 https://www.dropbox.com/s/xzftjpq1z8ebutg/ 728 729
Supplementary Video 2 | Social interaction of a pupil with DA blockers in HVC
730
Social interaction of a juvenile bird that received infusion of DA blockers into HVC during a
731 tutoring session. 732 https://www.dropbox.com/s/u7faje7dgawptpi/ 733 734
Supplementary Video 3 | Social interaction of a pupil with muscimol in PAG
735
Social interaction of a juvenile bird that received infusion of muscimol into PAG during a
736 tutoring session. 737 https://www.dropbox.com/s/9vy9pkgh52vuc0i/ 738 739