遺伝子工学的手法を用いた組換え作物の新規検知に関する研究
114
0
0
全文
(2)
(3) CONTENTS GENERAL INTRODUCTION CHAPTER 1. 1. 10. Development of pBT63, a positive control plasmid for qualitative detection of genetically modified rice. CHAPTER 2. 28. Development and evaluation of a novel DNA extraction method suitable for processed foods. CHAPTER 3. 47. A novel detection system for the genetically modified canola (Brassica rapa) line RT73. CHAPTER 4. 73. Quantification and identification of genetically modified maize events in non-identity preserved maize samples in 2009 using and individual kernel detection system. GENERAL CONCLUSION. 93. REFERENCES. 95. LIST OF PUBLICATIONS. 107. ACKNOWLEDGEMENT. 111.
(4) GENERAL INTRODUCTION. Genetic modification is a technique that involves extracting DNA from cells, altering their genetic composition and order, and expressing a functional gene in the same or different organism [1]. Genetically modified (GM) crops refer to crops or their descendants produced in such a manner, and these have widely used and harvested in agriculture. The area for the plantation of GM crops has rapidly increased in recent years; in 2012, the area was approximately 100 times larger (170.3 million hectares) compared to 1996, when full-scale commercial growing was initiated. In 2012, a total of 28 countries, including 20 and 8 developing and developed countries, respectively, were growing GM crops. Although GM crops require a high degree of production techniques and were grown only in developed countries during the early stages, the popularization of these particular plants has recently, led to rapid increase in its production in developing countries. The rate of increase in the area for plantation was 1.6 million hectares or 3% in developed countries versus 8.7 million hectares or 11% in developing countries. As a result, this was the first time the distribution ratio of global plantation area skewed towards developing countries, with 52% occurring in developing countries versus 48% for developed countries. In particular, Brazil has undergone four consecutive years of increases, including a 21% (6.3 million hectares) increase in 2011 for a total of 36.6 million hectares of plantations. The global increase in plantation area for GM crops in 2012 (10.3 million hectares) was at least two-fold higher than that of Japan’s total cultivated area (4.54 million hectares) and continues to grow. Furthermore, Japan’s largest importer of grains, the United States of America, is also the world’s largest grower of GM crops, with a plantation area of 69.5 million hectares in 2012 (representing 41% of the world’s total plantation area for GM crops) [2]. Japan relies on the import of 65% of its soy beans. -1-.
(5) and 75% of its maize from the United States, increasing the likelihood that GM crops would be integrated into the food industry [3]. International guidelines for establishing the safety of GM crops in the food industry are determined by the CODEX Commission. In Japan, a safety assessment system of GM crops was initiated under various laws and regulations. Safety inspections are currently in progress for foodstuffs under the Food Sanitation Act and feed under the Feed Safety Act (laws and regulations related to the improvement of quality and maintenance and safety of feed). Additionally, the environmental impact of using GM crops is being assessed under the Law Concerning the Conservation and Sustainable Use of Biological Diversity through Regulations on the Use of Living Modified Organisms (Cartagena Protocol). In general, only those GM crops that have received approval under these safety acts can be distributed. However, of the feeds that have been assessed as safe under inspection systems as strict as Japan’s (conducted by the Ministry of Agriculture, Forestry and Fisheries), approximately 1% is comprised of GM crops [4]. Moreover, the formulation of a product labeling system has been investigated, with the objective of supporting consumer choice as GM crops become available. In April 2001, the Act on Standardization and Proper Quality Labeling of Agricultural and Forestry Products (JAS Law) was established. Furthermore, a similar labeling requirement was established under the Food Sanitation Act, with the aim of displaying the presence or absence of GM crops in food items. Under this act, if a food item contains soy beans (including soy beans in a pod and bean sprouts), maize, potato, canola, cottonseed, alfalfa, sugar beet, and papaya that are distributed as GM crops and is one of the first three ingredients by weight or if the component weight is greater than 5% of the total, then such GM crops and their derivatives must be identified in the product label [5]. On the other hand, the use of non-GM crops should still be included in the product label; however,. -2-.
(6) to include such a label, the food product must use appropriately separated ingredients and have a certificate for each of the following steps: growing, harvest, storage, and export [6]. Accordingly, non-GM crops that have been appropriately classified and distributed are being actively procured by domestic markets in the food industry to cater to consumer trends towards non-GM foods. Oftentimes, distribution centers do not use non-GM crops-specific silos and tankers due to economic reasons, and the same equipment is cleaned for subsequent use in handling both types of products. For this reason, GM crops can remain in silos and tankers after storage or transportation, and there is a possibility of unintentional mixing of GM and non-GM crops, especially in distribution centers of countries that process large volumes of GM crops such as the United States. Accordingly, industries handling grains and seeds conduct independent scientific investigations in addition to securing administrative guarantees through certificates of compliance and quality control. Recently, a number of food fraud issues have arisen, thus increasing the interest of consumers for food labeling. A confirmed mislabel can have large negative impacts on the industry’s brand image and the resulting economic consequences could be significantly damaging. Based on this information, a simple investigative test for GM crops was required by the administrative and industry organizations in Japan, and a variety of methods have been developed and investigated. There are two types of analyzing techniques developed for GM crops: that analyzes recombinant 1) proteins and 2) DNA. 1) Existence of recombinant proteins in GM crops can be detected directly, thus allowing the development of a simple analyzing system. Those are enzyme-linked immunosorbent assay (ELISA) and immunochromatography are representative analyzing techniques for GM crops, and assay kits based on these principles are currently available [7, 8]. In particular,. -3-.
(7) immunochromatography only requires a test strip to be immersed in the sample, simplifying the procedure and rapidly giving results without the need for setting up special equipment. Due to its simplicity, this technique is most often used as a corroborative test for distribution processing in identity preserved (IP) handling, primarily in countries producing GM crops. However, the method for detecting recombinant proteins can only confirm the presence of the target protein, whereas GM events containing the same recombinant DNA cannot be distinguished. Moreover, this method is capable of detecting contamination of up to 0.1%, although some proteins are unstable and often undergo denaturation in processed foods, making protein detection extremely difficult and highly sensitive [9]. 2) In contrast, recombinant DNA can be detected after amplification, avoiding the issues associated with protein detection. Methods for DNA amplification include polymerase chain reaction (PCR) [10, 11] and loop-mediated isothermal amplification (LAMP) [12]. In these methods, the region of amplification can be selected, allowing GM event-specific amplification and detection of DNA sequences, as well as guaranteeing traceability. Moreover, DNA is generally more stable at high temperatures compared to proteins, so some level of detectability can be maintained depending on the region of amplification even when the DNA has undergone fragmentation during the processing stage. For this reason, most of the GM crop detection methods in Japan and the European Union rely on DNA detection, using the technologically popularized PCR method. The specificity and sensitivity of PCR is dependent on the purity of template DNA, reaction temperature, composition of the reaction buffer, and primers; therefore, the development of a reliable method of detection will require careful consideration of these parameters. In Japan, qualitative PCR has been used to detect the presence of GM crops, whereas quantitative PCR has been used to measure the rate of contamination by GM crops. In qualitative. -4-.
(8) PCR, the target DNA is PCR amplified using primers and products are separated by agarose gel electrophoresis. GM events are confirmed if a band matching the size of the target DNA is detected. Additionally, the specific tests for GM events must include PCR of endogenous genes (i.e., soybean: soybean lectin gene; maize: starch synthases IIb gene) as a control reaction for the method of examination (sample breakdown, DNA extraction, and PCR) [13]. On the other hand, GM detection by quantitative PCR involves measuring the copy number of the endogenous gene and recombinant gene using fluorescent probes and real-time PCR. In the EU, the ratio of the copy number for the endogenous gene to the recombinant gene is used as the GM contamination rate. In Japan, a conversion factor is used to convert the copy number ratio to a weighted ratio of contamination rate, which has been published in the ISO standard for detecting GM crops: ISO21570-2005 Foodstuffs – Methods of analysis for the detection of genetically modified organisms and derived products – Quantitative nucleic acid based methods. The GM contamination rate is calculated by substituting the conversion factor and measured value of the unknown sample into the following equation [14, 15]: × 1. GM contamination rate (%) =. × 100. Furthermore, because approval for GM crops differs according to country, some GM crops may be approved by the import partner country, but not by Japan. A standard analytical method for unapproved GM crops can be found in the notice, “Investigative methods for unapproved recombinant DNA-applicable foodstuffs”, published by the Ministry of Health, Labour and Welfare. The development and addition of methods for the detection of new, unapproved GM crops and their events will be required when the possibility of contamination becomes evident. In this study, we focused on the following four points in detecting recombinant DNA in. -5-.
(9) GM crops: 1. False positive results due to contamination of the positive control; 2. Complexity of methods of DNA extraction from processed foods; 3. Investigation of GM canola RT73 Brassica rapa (RT73 B. rapa), where species identification and recombinant DNA detection must be performed from a single seed; and 4. Determination of distribution conditions of GM maize from the United States, including its methodology. We resolved these issues using genetic engineering techniques to further improve the accuracy of GM crop detection technology. The following is a detailed explanation of each method. 1.. Generally, positive and negative control reactions are indispensable in DNA detection analysis to ensure that there are no contaminations, switching, or mixing of samples during the assay. Because PCR can amplify DNA up to 107 copies, adequate consideration must be given to DNA contamination due to a variety of reasons. For example, sample grinding, DNA extraction, preparation of PCR solutions, and electrophoresis should all be performed in separate rooms, with each room maintained in a clean state. However, in the fields where PCR is routinely performed, the positive control was not always included in the analysis, thus leading to issues where the absence of GM crops could not be confirmed. The objective of this study was to actively promote the use of control reactions and increase the precision of detection methods. By improving the plasmid DNA sequence used for positive control, we developed a new method for easily distinguishing between false positives due to contamination and true positives derived from genomic DNA.. 2.. DNA extraction and purification from samples is important to detect recombinant DNA in processed foods. However, several points such as incomplete extraction, leading to insufficient. -6-.
(10) amounts of DNA required for GM detection, and insufficient purification, leading to contamination from impurities that impede the PCR reaction, lead to inaccurate results. In GM detection, the methods for DNA extraction from plants include using cetyltrimethylammonium bromide (CTAB), a silica spin column, or an anion exchange resin. These methods of DNA extraction were developed and used depending on the crop species or degree of food processing. On the other hand, DNA in processed foods is often fragmented chemically, physically, or biologically, and normal methods of DNA extraction are ineffective in isolating the target DNA. Therefore, the development of a method of DNA extraction and refining with superior operability and less variability has been the focus of research interest. In this study, we established and optimized a method of DNA extraction, as well as conditions for refining processed foods that contain soybeans and maize allowing to isolate an adequate amount of quality DNA for use in GM detection. 3. The distribution of unapproved GM crops across the market place is due to human error at the research stage, specifically during seed management or production. This has caused concerns regarding for food safety. There have been several cases of documented contamination of unapproved GM crops, including inappropriate shipping of GM maize Bt10 (March 2005) [16], cultivation of insect-resistant GM rice in China (Hubei) (April 2005) [17], contamination of LL RICE601 (Liberty Link Rice 601) in the United States (August 2006) [18], contamination of GM maize DAS59132 in the United States (February 2008) [19], contamination of GM flax FP967 (October 2009) [20], contamination of GM papaya PRSVYK in Taiwan (February 2011) [21], and contamination of PRSV-SC in Thailand (July 2013), etc. As mentioned before, in these cases, the development of a detection method appropriate for each GM event is required. The case of contamination of GM canola RT73 B. rapa reported. -7-.
(11) by the government of Canada in December 2005 signifies that the methods developed thus far are inappropriate. GM canola RT73 B. rapa is a hybrid strain between herbicide resistant RT73 Brassica napus (RT73 B. napus), which was already determined to be safe, and the non-GM canola (B. rapa). Planting had ceased in Canada in 2000, thus safety tests were not conducted in Japan based on the assumption that the grain was no longer being distributed. In order to analyze RT73 B. rapa, species identification between B. rapa and B. napus, as well as detection of GM canola-specific regions must be carried out using the same seed. To secure the reliability of the test, it was necessary to test several batches of seeds (numbering between ten and 100) in one lot individually and establish a systematic detection method. Additionally, the seeds of canola are extremely small and full of lipids; therefore, the development of extraction methods must consider these characteristic points. This incident occurred in Canada, Japan’s largest import partner for canola, and the inability to establish a method of detection led to continued inability to perform the necessary detection tests required by law. Accordingly, in this study, we developed a new method of DNA extraction and real-time PCR to manage multiple canola samples and combined these to establish a detection method for GM canola RT73 B. rapa. 4.. According to the GM food label regulation of Japan, inclusion of non-labeled GM crops cannot exceed the weighted ratio of 5%. However, using the quantitative detection methods outlined thus far, a higher GM contamination ratio will be calculated for stacked events containing multiple copies of exogenous genes produced through GM plant hybridization. For example, contamination with a hybrid species between herbicide-resistant GM maize and insect-resistant GM maize could result in a higher contamination ratio if a common sequence (CaMV 35S promoter region) is again used for quantification used in the screening. Therefore,. -8-.
(12) to avoid this, we modified the DNA extraction method to detect the GM canola RT73 B. rapa outlined in 3) for use with a single maize kernel. We then combined it with previously described methods of real-time PCR and multiplex PCR to develop a method capable of identifying and quantifying groups of GM maize that contain stacked events.. -9-.
(13) CHAPTER 1 Development of pBT63, a positive control plasmid for qualitative detection of genetically modified rice. - 10 -.
(14) 1. Introduction. Genetically modified (GM) crop production has been steadily increasing globally. As of 2012, the cultivation area for GM crops was 170.3 million hectares, a 100-fold increase from when the first GM crop was commercialized in 1996 [2]. Today, GM crops for food and feed use have been produced in 28 countries worldwide. International guidelines for assessing the safety of the industrial use of GM organisms (GMOs) have been established [22, 23]. The standards of the Food Sanitation Law have also been revised to restrict distribution of GM foods that have not been assessed for safety in Japan. This law has been implemented according to Notification No. 232 (May 1, 2000) and No. 233 (May 1, 2000), issued by the Ministry of Health, Labour and Welfare (MHLW) of Japan. In addition, since April 2001, safety assessment and labeling of GM foods have been legally required [24, 25]. This situation demanded the development of testing methods for unauthorized GM foods. We have developed PCR-based detection methods for unauthorized GM foods that have been adopted as standard Japanese methods. One is the detection method for GM Shanyou 63 (Bt63) [26-29], which is a GM rice variety developed in China that has been conferred insecticidal activity by the introduction of the cry1Ac gene of Bacillus thuringiensis (Bt). Our Bt63 detection method was widely used to prevent the importation and distribution of unauthorized Bt63 in the Japanese market [8, 17, 30-33], until replaced by the real-time PCR-based qualitative method described in Notification No. 116-4 (Nov. 16, 2012) issued by the MHLW [34, 35]. For GM product testing laboratories, a reliable reference material is indispensable as a positive control to ensure accurate test results. However, it is quite difficult to obtain enough of genuine unauthorized GM crops or their purified genomic DNA. Plasmid DNA including PCR. - 11 -.
(15) target sequences are frequently used instead, because they can be easily replicated within Escherichia coli and steadily supplied [36-41]. Especially in Japan, plasmid DNA is required as DNA templates for positive controls in the standard testing methods for authorized GM events (GM maize lines MON810, Bt11, GA21, Event176, and T25; GM soybean lines GTS40-3-2, MON89788, and A2704-12; GM papaya line 55-1; and GM potato lines Bt6, SPBT02-05, RBMT21-129, RBMT21-350, and RBMT22-82) [5, 14, 42-45] and for unauthorized GM events (GM rice lines Shanyou 63 (Bt63), NNBt, CpTI, and LL601; GM maize lines Bt10 and CBH351; GM canola line RT73; and GM papaya lines PRSV-YK and PRSV-SC) [21, 46-48]. In practice, extra precautionary procedures and cleaning have been required in testing laboratories to reduce the risk of contamination [5, 49]. Japanese regulations impose restrictions on the distribution of unauthorized GMOs, and in fact, the test results of qualitative analyses for unauthorized GMOs are negative in most cases. In this situation, contamination from positive control plasmids is a more frequent cause of positive results than contamination by ground seeds, DNA extracts or PCR products in the tests. Consequently, special caution should be implemented to avoid false-positive results when conducting such tests. However, there are currently no practical ways of confirming whether a positive test result was derived from contamination by positive control plasmids or another source. We have developed a positive control plasmid for the testing of the unauthorized GM rice line Bt63. In order to eliminate false detection caused by control plasmid contamination, we introduced a restriction site in the middle of the PCR target sequence of the positive control plasmid. Then, restriction enzyme treatment allowed us to discriminate between true and false positive detection. To our knowledge, this is the first report of the development of a system to assess whether PCR products are derived from a positive control plasmid or a true GMO sample.. - 12 -.
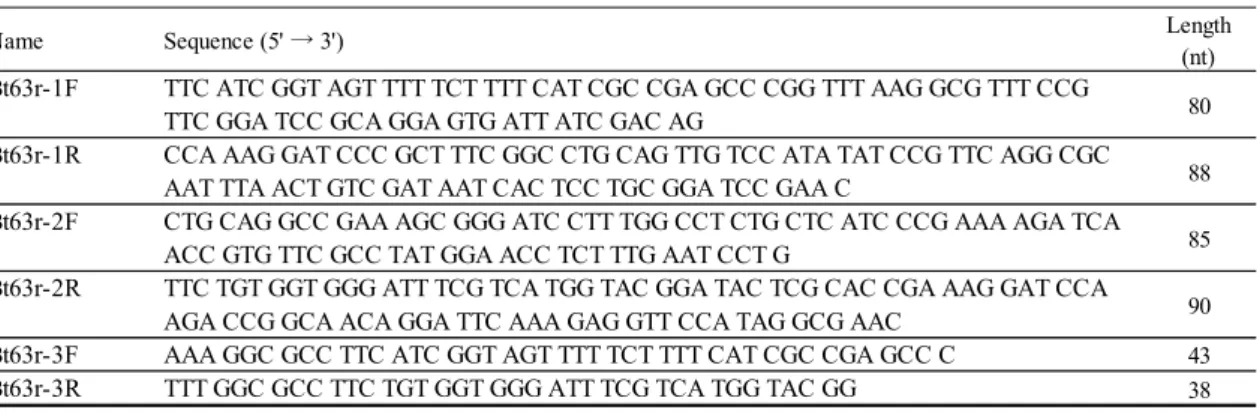
(16) 2. Materials and methods 2.1 Sample For the detection of the rice endogenous sequence sucrose phosphate synthase (SPS), we used genomic DNA of the Koshihikari cultivar (Oryza sativa) purchased at a local market in Toyama. DNA extracted from Bt63-positive rice vermicelli, obtained by the National Institute of Health Sciences, Japan, was used as a positive control for Bt rice. The plasmid pRICE4, which is commercially available as the GM Rice Detection (IR) Rice Positive Control Plasmid 2 (Nippon Gene, Tokyo, Japan), was used for comparing amplification efficiency with that of the positive control plasmid developed in this study. Unless otherwise noted, all reagents were analytical grade and were used without further purification.. 2.2 Plasmid Construction 2.2.1 First PCR PCR primers for the construction of pBT63 were synthesized by Nippon Gene Material Co., Ltd. (Toyama, Japan). The first PCR, with four PCR primers binding the template to construct pBT63, was performed under the following conditions. A 50 µL reaction solution was prepared consisting of 5.0 µL 10× GeneTaq Universal Buffer, 0.2 mmol/L dNTP, 0.625 units GeneTaq FP polymerase (Nippon Gene) and 0.2 µmol/L each primer (Bt63r-1F, Bt63r-1R, Bt63r-2F, Bt63r2R) (Table 1-1). PCR was performed with the GeneAmp PCR System 9700 (Life Technologies, Carlsbad, CA, USA). The reaction conditions were 5 min at 95°C, 30 cycles of 30 s at 95°C, 30 s at 60°C, and 2 min at 72°C, followed by a final extension at 72°C for 15 min, then storage at 4°C. The PCR product obtained was separated by electrophoresis in a 3% agarose gel.. - 13 -.
(17) 2.2.2 Second PCR The second PCR was carried out in a 50 µL reaction solution consisting of 5.0 µL 10× GeneTaq Universal Buffer, 0.2 mmol/L dNTP, 0.625 units GeneTaq FP, 0.2 µmol/L each primer (Bt63r-3F and Bt63r-3R) (Table 1-1), and 1.0 µL of the amplified product obtained in the first PCR. Thermal cycling conditions were set for 5 min at 95°C, 30 cycles of 30 s at 95°C, 30 s at 60°C, and 2 min at 72°C, followed by a final extension at 72°C for 15 min, then storage at 4°C. The PCR product obtained was separated by electrophoresis in a 3% agarose gel, then excised and purified with a MinElute Gel Extraction Kit (QIAGEN, Hilden, Germany).. Table 1-1 The synthetic oligonucleotide sequences used for construction of pBT63 Length (nt). Name. Sequence (5' → 3'). Bt63r-1F. TTC ATC GGT AGT TTT TCT TTT CAT CGC CGA GCC CGG TTT AAG GCG TTT CCG TTC GGA TCC GCA GGA GTG ATT ATC GAC AG CCA AAG GAT CCC GCT TTC GGC CTG CAG TTG TCC ATA TAT CCG TTC AGG CGC AAT TTA ACT GTC GAT AAT CAC TCC TGC GGA TCC GAA C CTG CAG GCC GAA AGC GGG ATC CTT TGG CCT CTG CTC ATC CCG AAA AGA TCA ACC GTG TTC GCC TAT GGA ACC TCT TTG AAT CCT G TTC TGT GGT GGG ATT TCG TCA TGG TAC GGA TAC TCG CAC CGA AAG GAT CCA AGA CCG GCA ACA GGA TTC AAA GAG GTT CCA TAG GCG AAC AAA GGC GCC TTC ATC GGT AGT TTT TCT TTT CAT CGC CGA GCC C TTT GGC GCC TTC TGT GGT GGG ATT TCG TCA TGG TAC GG. Bt63r-1R Bt63r-2F Bt63r-2R Bt63r-3F Bt63r-3R. 80 88 85 90 43 38. 2.2.3 TA Cloning TA cloning was performed under the following conditions. A total volume of 20 µL was prepared with 0.5 µL pGEM-T Vector (Promega, Madison, WI, USA), 4.5 µL of the insert DNA solution and 10 µL 2× ligation mix from the Ligation-Convenience Kit (Nippon Gene). After incubation at 16°C for 30 min, 10 µL of the solution was added to 100 µL of DH5 competent cells and incubated on ice for 30 min. The cells were heat-shocked for 1 min at 42°C, followed by storage on ice for 3 min. After sufficient cooling, 400 µL Hi-Competence Broth (Nippon Gene). - 14 -.
(18) was added and the cells cultured for 1 h at 37°C. The culture solution was diluted 50 times with Hi-Competence Broth, and 100 µL of the solution was plated on Luria-Bertani (LB) agar medium that. included. ampicillin. [50],. 5-bromo-4-chloro-3-indolyl-β-D-galactopyranoside. and. isopropylthio- -galactoside, allowing blue/white screening [51]. After culturing for 16 h at 37°C, white colonies were used for direct colony PCR. The 10 µL reaction solution included the following: 1.0 µL 10× GeneTaq Universal Buffer, 0.2 mmol/L dNTP, 0.2 µmol/L each primer pair (Universal 64-F: 5’-CACGACGTTGTAAAACGACGGCCAGTGAATT-3’ and Universal 64-R: 5’-GGAAACAGCTATGACCATGATTACGCCAAGC-3’), and 0.625 units GeneTaq FP. Reaction conditions were 5 min at 95°C, 30 cycles of 30 s at 95°C, 30 s at 60°C, and 2 min at 72°C, followed by a final extension at 72°C for 7 min, then storage at 4°C. The PCR product obtained was separated by electrophoresis in a 3% agarose gel to determine whether the target insert sequence was present. Clones in which the insert sequence was confirmed were subcultured in 5.0 mL liquid LB and shaken for 16 h at 37°C. Cells were then collected by centrifugation, and the plasmid DNA was purified with a QIAprep Spin Miniprep Kit (QIAGEN). The DNA concentration of the plasmid was determined by measuring the UV absorbance at 260 nm with a DU-800 spectrophotometer (Beckman Coulter, Miami, FL, USA). 2.2.4 Coning into pUC19 To cut the insert from the plasmid DNA obtained from TA cloning, we used the restriction enzyme NarI (Nippon Gene) to cut its recognition sequence, which had been placed at both ends of the insert. After incubating with NarI for 4 h at 37°C, the digested DNA was separated by agarose electrophoresis. After confirmation of the length of the insert, the DNA was excised from the gel, purified with a MinElute Gel Extraction Kit, and dissolved in 20 µL Buffer AE.. - 15 -.
(19) pUC19 was preliminarily cut with NarI, and purified using phenol/chloroform/isoamyl alcohol (25:24:1) (PCI)[52]. The plasmid was dephosphorylated with bacterial alkaline phosphatase (Nippon Gene) in order to inhibit self-ligation. Ligation, transformation, and plasmid purification were performed under the same conditions described for TA cloning. 2.2.5 Sequence To confirm the DNA insertion sequence of the plasmid DNA obtained through the procedures described above, a sequencing sample was prepared with the primers used for direct colony PCR (Nar1-F for pUC19: 5’-TTGTACTGAGAGTC-CACCATATGCGGTGG-3’ and Nar1R for pUC19: 5’-CATAATAGCGAAGAGGCCCGCACC-3’) according to the manufacturer’s instructions for the DYEnamic ET Terminator Cycle Sequencing Kit (GE Healthcare, Freiburg, Germany). Sequencing was performed with an ABI PRISM 310 Genetic Analyzer (Life Technologies).. 2.3 Preparation of positive control plasmid, pBT63 2.3.1 Preparation of pBT63 A clone in which the designed sequence was appropriately inserted was subcultured in 600 mL (300 mL × 2) liquid LB and shaken for 15 h at 37°C. Cells were then collected by centrifugation, and the plasmid DNA was purified with a QIAGEN Plasmid Mega Kit (QIAGEN). DNA concentration was determined by measuring the UV absorbance at 260 nm. 2.3.2 Linearization of pBT63 pBT63 was linearized with NdeI and PstI (Nippon Gene), as there were no recognition sites for NdeI or PstI in the insert DNA of pBT63. After reacting for 16 h at 37°C, linearization of pBT63 was confirmed by 1.0% agarose gel electrophoresis. PCI purification was carried out. - 16 -.
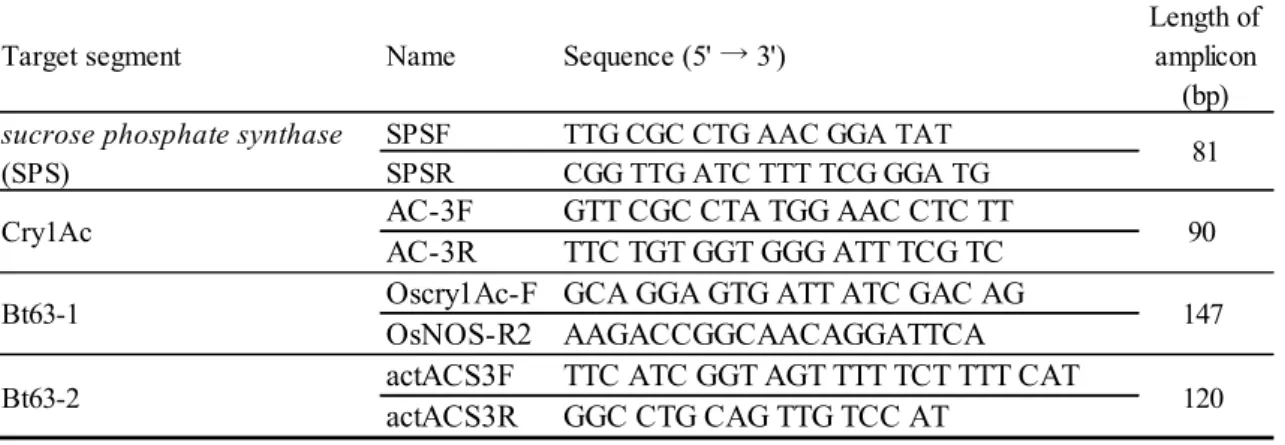
(20) twice. An equal amount of chloroform was then added to the collected upper layer, followed by stirring and centrifugation. A one-tenth volume of 3.0 M sodium acetate solution (pH 5.2) and an equal amount of isopropyl alcohol were added to the collected upper layer. After inverting and centrifuging, the supernatant was discarded. After washing with 70% ethanol, the precipitate was vacuum-dried and dissolved in 100 µL TE (10 mmol/L Tris-HCl, pH 8.0, 1 mmol/L EDTA). The DNA concentration was determined, and the linearized pBT63 solution was diluted to 1.0 ng/µL with TE containing ColE1 DNA at a concentration of 5.0 ng/µL, which was then stored at -20°C.. 2.4 Evaluation of pBT63 2.4.1 PCR amplification All primer pairs shown in Table 1-2 were synthesized by Nippon Gene Material Co., Ltd. The 25 µL PCR solution consisted of 2.5 µL 10× PCR Buffer II, 0.16 mmol/L dNTP, 1.5 mmol/L MgCl2, 0.6 µmol/L each primer pair, 0.8 units/µL AmpliTaq Gold DNA Polymerase (Life Technologies), and 5 µL pBT63. The PCR conditions for the rice endogenous sequence SPS were 10 min at 94°C, 45 cycles of 30 s at 94°C, 30 s at 56°C, and 30 s at 72°C, followed by a final extension at 72°C for 7 min, then storage at 4°C. The PCR conditions for the primer pairs AC-3F and 3R, and Oscry1Ac-F and OsNOS-R2 were as follows: 10 min at 95°C, 45 cycles of 30 s at 95°C, 30 s at 60°C, and 30 s at 72°C, followed by the final extension at 72°C for 7 min, and stored at 4°C. The PCR conditions for the primer pair of actACS3F and 3R were the same as those for SPS detection, except for the number of cycles, which was 35 instead of 45[17, 46, 47]. A 4 µL aliquot of each PCR product derived from each primer pair was mixed with 1.0. - 17 -.
(21) µL 6× loading buffer Orange G (Nippon Gene), then electrophoresed in a 3.0% agarose X (Nippon Gene) gel including 50 µg/100 mL ethidium bromide with TAE (40 mM Tris-acetate, 1 mM EDTA) as a running buffer for 30 min at a constant voltage of 100 V. After electrophoresis, images were acquired using a UV irradiation instrument.. Table 1-2 Primer sequences for GM rice Bt63 detection and length of amplicons. Target segment. Name. Sequence (5' → 3'). sucrose phosphate synthase (SPS). SPSF SPSR. TTG CGC CTG AAC GGA TAT CGG TTG ATC TTT TCG GGA TG. AC-3F AC-3R Oscry1Ac-F OsNOS-R2 actACS3F actACS3R. GTT CGC CTA TGG AAC CTC TT TTC TGT GGT GGG ATT TCG TC GCA GGA GTG ATT ATC GAC AG AAGACCGGCAACAGGATTCA TTC ATC GGT AGT TTT TCT TTT CAT GGC CTG CAG TTG TCC AT. Cry1Ac Bt63-1 Bt63-2. Length of amplicon (bp) 81 90 147 120. 2.4.2 Restriction enzyme digestion of pBT63-derived PCR products We obtained PCR products using pBT63 and rice vermicelli-derived DNA as templates. To 25 µL of each PCR product, 20 units of BamHI was added with incubation at 37°C for 30, 60, and 120 min. Aliquots (5.0 µL) of the reaction solutions were electrophoresed in agarose gels and examined to determine whether pBT63-derived amplified products had been cut as designed. 2.4.3 Comparison of amplification efficiency We evaluated whether there was any significant impact on amplification efficiency due to differences in template sequence by comparing the amplification curves of pBT63 and pRICE4, which also includes the rice endogenous sequence SPS and was amplified with SPSF and SPSR primers. We compared amplification curves based on real-time PCR using the intercalation method. - 18 -.
(22) A 25 µL reaction solution was prepared with 12.5 µL 2× GeneAce SYBR qPCR Mix Low ROX (Nippon Gene), 0.5 µM SPSF and SPSR primers, and 2.5 µL pBT63 or pRICE4. pRICE4 was diluted with ColE1/TE to a concentration of 50 copies/µL. Real-time PCR was performed in triplicate with the ABI PRISM 7500 Fast Sequence Detection System (Life Technologies). Reaction conditions were 10 min at 95°C and 45 cycles of 30 s at 95°C, 1 min at 60°C.. - 19 -.
(23) 3. Results and discussion 3.1 Plasmid Construction 3.1.1 Design of positive control plasmid In PCR testing processes, although including a positive control test is preferable, the use of a positive control could itself cause contamination. To solve this problem, we developed a system to easily assess whether or not the PCR products obtained in testing for Bt63 rice are derived from the positive control. We selected four target sequences, namely SPS, Cry1Ac, Bt631, and Bt63-2. SPS is an endogenous reference gene for rice and was used as a positive control to confirm successful DNA extraction. Cry1Ac was used for screening for Bt rice events. Bt63-1 and the Bt63-2 were used to identify Bt63 rice. To distinguish between PCR products derived from genomic DNA of Bt63 and those from the positive control plasmid, we inserted a restriction enzyme recognition site into the control plasmid. BamHI was chosen as the most appropriate restriction enzyme because of its adequate enzymatic activity in PCR mixtures, low cost, and absence of a BamHI recognition site in the original PCR target sequences. We changed the internal sequences of the PCR targets into artificial sequences including a BamHI recognition sequence, keeping the primer annealing regions and the length of the amplicon unchanged. Moreover, the BamHI recognition sequence was placed in the center of the amplicon to easily detect the digested PCR products using agarose gel electrophoresis. We designed the sequences of the four PCR target regions to overlap, as shown in Figure 1-1. Consequently, we designed an insert of 257 bp, which is 181 bp shorter than if the four sequences had been connected in tandem.. - 20 -.
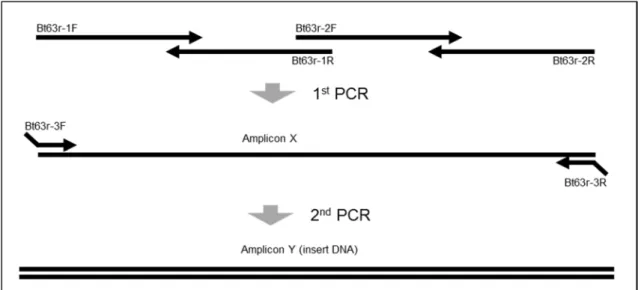
(24) Figure 1-1 Construction of positive control plasmid pBT63 Schematic of pBT63. Except for the primers defined in the legend at the lower bottom of the figure, the primers are mock sequences that are not tandemly arranged and overlap for the purpose of shortening the sequence of the designed insert. SPSF and SPSR are primers that amplify the endogenous rice SPS gene, AC-3F and AC-3R are primers that amplify Cry1Ac, Oscry1Ac-F and OsNOS-R2 are primers that specifically amplify the junction region of the cry1Ac gene and the NOS terminator in Bt rice, and actACS3F and actACS3R are primers that specifically amplify the junction region of the 5’-intron and the cry1Ac gene in Bt rice. 3.1.2 Design of primers and adjustment of insert sequence As shown in Table 1-1, the insert sequence was covered by four primers (Bt63r-1F, Bt63r-1R, Bt63r-2F, Bt63r-2R) and we designed these primers to overlap approximately 27-30 bp between pairs to allow amplification of the entire sequence by PCR. As shown in Figure 1-2, the insert sequences were prepared in two rounds of PCR. A smeared band was obtained from the first round of PCR products (Figure 1-3A). Many amplified products were detected around 111147 bp and 242 bp, and were considered to respectively be the DNA amplified by 2 or 4 primers. In the second PCR, the insert sequence was amplified using primers designed at the two ends of. - 21 -.
(25) the insert (Bt63r-3F, Bt63r-3R), and the NarI recognition sequence that would be used to join the insert to pUC19 was added using PCR as shown in Figure 1-2. The PCR products obtained were detected as a single band following agarose gel electrophoresis (Figure 1-3B). To clone the designed sequence, we performed TA cloning of the insert. Multiple (20) positive clones were obtained, and these were sequenced. We chose a clone that had a sequence identical to that designed. An insert sequence with cohesive ends was obtained by digestion with NarI. The insert was cloned into pUC19, and multiple clones were obtained. The cloned plasmid DNA in pUC19 was sequenced using primers Nar1-F and Nar1-R. As shown in Figure 1-4, the plasmid DNA was entirely consistent with the designed sequence. The plasmid was named pBT63.. Figure 1-2 Outline of process for construction of insert DNA using PCR 1. Amplicon X was produced in the first PCR amplification using four long synthetic oligonucleotide primers (80-90 mers). 2. Amplicon Y (insert DNA) was produced in the second PCR amplification using tailed primers.. - 22 -.
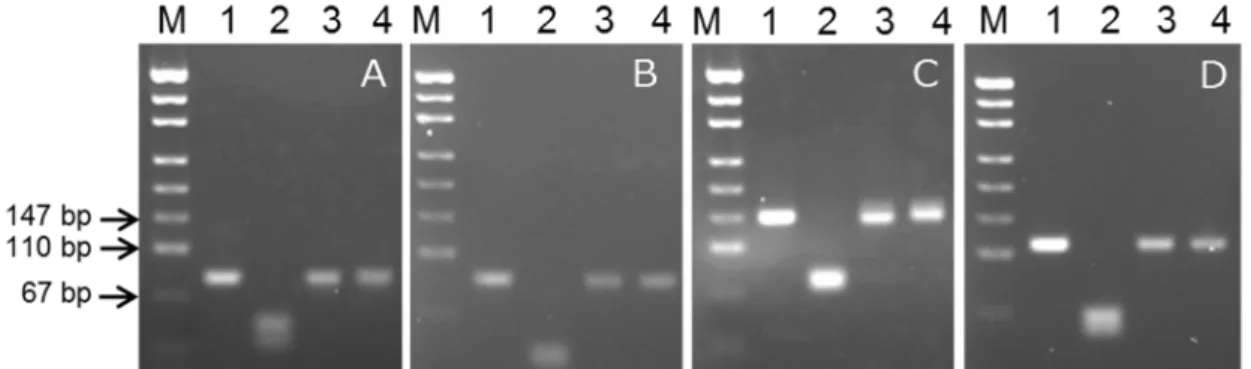
(26) Figure 1-3 Agarose gel electrophoresis of PCR product used for preparing insert DNA of pBT63 Lane M: pUC19/MspI digest; lane A: first PCR products; lane B: second PCR products.. Figure 1-4 pBT63 insert sequence Position and orientation of primers are indicated. A staggered line through the sequence marks a restriction enzyme site.. - 23 -.
(27) 3.2 Preparation of positive control plasmid, pBT63 E. coil DH5 transformed with pBT63 was cultivated in 600 mL (300 mL × 2) of liquid LB. After the plasmid DNA was extracted, its concentration was determined using UV absorbance. The DNA yield was 2.19 mg, and the 260/230 nm and 260/280 nm ratios were 2.33 and 1.98, respectively. pBT63 (219 µg) was then digested with NdeI and PstI for linearization. The DNA yield was 150 µg, and the 260/230 nm ratio and the 260/280 nm ratios were 2.44 and 1.96, respectively. The linearized pBT63 was diluted to 0.1, 0.01 and 0.001 pg/µL. To prevent nonspecific adsorption of the DNA to the microtube, TE including ColE1 DNA as a carrier was used for dilution. PCR was performed using 5 L of the linearized pBT63 with each primer pair shown in Table 1-2. Analysis of the PCR products confirmed the absence of nonspecific amplification at 0.5, 0.05 and 0.005 pg (157k, 15.7k and 1.57k copies) of pBT63 with all primer pairs, and the lengths of the amplicons were identical, as designed (data not shown). These results indicated that amplification was appropriate for the evaluated range of plasmid concentrations. To obtain precise results, we thereafter used 0.01 pg/ L of linearized pBT63 in ColE1/TE solution, which was the median plasmid concentration.. 3.3 Evaluation of positive control 3.3.1 PCR amplification To evaluate the validity of the positive control plasmid pBT63, we tested all four primer pairs for detection of Bt63 rice. As shown in Table 1-2, a PCR product with the target length was amplified without producing any nonspecific PCR products, as shown in Figure 1-5A-D. Accordingly, the results showed that pBT63 functions adequately as a positive control to check for preparation of test samples and to act as a size indicator of the target amplicon using. - 24 -.
(28) electrophoresis. 3.3.2 BamHI digestion of PCR products derived from positive control plasmid In this study, we inserted a recognition site for BamHI into nearly the center of the target amplicon sequence to detect false-positive reactions derived from contamination by positive control plasmid. We examined whether BamHI digested PCR products of four types of target sequences after simply adding the restriction enzyme to the PCR buffer and incubating at 37°C, with no optimizing of the buffer for the enzyme. We judged that sufficient digestion occurred following incubation for 30 min (data not shown). Next, we checked whether genomic DNAderived PCR products were unintentionally cut with BamHI. For the rice endogenous sequence SPS, the genomic DNA of rice variety Koshihikari was used as a positive control for rice genomic DNA. The PCR product derived from genomic DNA of Koshihikari was not digested by incubation with BamHI for 30 min at 37°C (data not shown). Then, we examined whether contamination of a PCR reaction buffer by pBT63 could be detected using each PCR product amplified with the four pairs of PCR primers shown in Table 1-2. As a reference for Bt63-positive results, the genomic DNA of Bt63-positive rice vermicelli was used. As shown in Figure 1-5AD, all the PCR products derived from pBT63 were digested by the restriction enzyme, while the PCR products derived from Bt63-positive rice vermicelli remained intact after BamHI digestion. The SPS fragment was digested with 43- and 38 bp-fragments, Cry1Ac with 41- and 49 bpfragments, Bt63-1 with 68- and 79-fragments, and Bt63-2 with 55- and 65 bp-fragments. These results showed that the positive control plasmid pBT63 can confirm whether or not contamination occurred from the positive control using a simple procedure.. - 25 -.
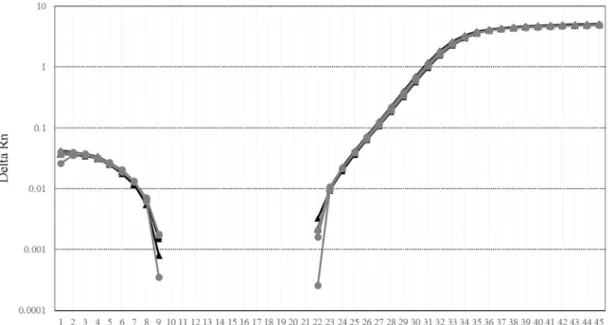
(29) Figure 1-5 Distinguishing true positives from false positives in the detection of Bt rice by digesting PCR products using the restriction enzyme BamHI. Lanes show the products of each template DNA with the primer pairs indicated in parentheses. A: SPS (SPSF and SPSR); B: cry1Ac (AC-3F and AC-3R); C: Bt63-1 (Oscry1Ac-F and OsNOS-R2); D: Bt63-2 (actACS3F and actACS3R). Lane M: pUC19/MspI digest; lane 1: PCR products of positive control; lane 2: PCR products of positive control digested with BamHI; lane 3: PCR products of genomic DNA from Bt rice vermicelli; lane 4: PCR products of genomic DNA from Bt rice vermicelli digested with BamHI.. 3.3.3 Amplification efficiency In pBT63, a 43 bp segment of the 81 bp amplified using the SPS primer pair (53.1% of the full length) is an artificial sequence. On the other hand, in pRICE4, the all sequence of the 81 bp amplified using the SPS primer pair is an endogenous rice sequence. We compared the difference in amplification efficiency that could be attributed to the differences in base sequence of the two sequences using real-time PCR. As shown in Figure 1-6, similar amplification curves were observed for pBT63 and pRICE4. Although we drastically changed the internal sequences of the respective PCR targets, the amplification efficiency was unchanged. The results strongly suggested a possibility that other target region to be amplified can be changed. Our approach to eliminate false-positive detection would be applicable not only for Bt63 rice testing but also for other PCR-based testing.. - 26 -.
(30) Figure 1-6 Comparison of real-time amplification of mock SPS sequence in pBT63 and real SPS sequence in pRICE4. Three replicates of each sample were amplified.. - 27 -.
(31) CHAPTER 2 Development and evaluation of a novel DNA extraction method suitable for processed foods. - 28 -.
(32) 1. Introduction. DNA analyses based on molecular biological techniques, such as polymerase chain reaction (PCR), are widely performed for food testing to detect genetically modified organisms (GMOs), allergens, pathogenic microorganisms and so on [14, 53, 54]. PCR analysis is generally comprised of four steps, i.e., sample grinding as pretreatment, DNA extraction, PCR and electrophoresis analysis. Of these steps, the DNA extraction step tends to be the most labor-intensive. An easy and fast DNA extraction method is highly desirable for efficient food testing. So far, methodologies enabling DNA extraction and purification from biological materials have been established. The Cetyltrimethylammonium bromide (CTAB)-based method [55, 56], the anion exchange resin-based method [57], and the silica membrane-based method [58] are practical, and a variety of DNA extraction kits based on these methods are commercially available. From the viewpoint of consumer protection, it is important to test end products in food supply chain, many of which are processed foods. DNA in processed foods appears to be fragmented or degraded by physical, chemical, and/or biological factors during processing [59]. Additionally, processed foods are composed of numerous materials and/or ingredients. Hence, successful DNA extraction from processed foods is difficult. In fact, the currently existing DNA extraction methods have several drawbacks, including unstable yield, long handling time, complex operation, and/or use of toxic organic solvents such as phenol and chloroform. So, we attempted to develop a DNA extraction method for processed foods that is easier to use and faster. Previously, we developed a silica membrane-based DNA extraction kit for raw grain materials, named GM quicker 2 kit [18]. The kit is recognized as simple and reliable, and was adopted as part of the Japanese official testing method for GMO in food [60, 61]. In this study,. - 29 -.
(33) we developed a DNA extraction method suitable for processed foods based on the GM quicker 2 kit. Comparative evaluation of the developed method and the currently existing DNA extraction methods was also performed.. - 30 -.
(34) 2. Materials and methods 2.1 Samples Three kinds of processed soybean products (soy milk, roasted soybean flour, miso) and three kinds of processed maize products (canned whole kernel sweet corn, corn snack, dried soup mix) were purchased at a local market in Toyama, Japan. As the pretreatment for DNA extraction, miso and canned whole kernel sweet corn were combined with an equal volume of distilled water and ground using a knife mill Grindomix GM200 (Retsch, Dusseldorf, Germany). Corn snack was ground using the knife mill Grindomix GM200 directly. Soy milk, roasted soybean flour and dried soup mix were used without pretreatment.. 2.2 Optimization of buffer condition for DNA recovery from processed foods GM quicker 2 kit (NIPPON GENE, Tokyo, Japan) was used as the base technology for developing the new DNA extraction method. One gram of sample was transferred to a 50 ml polypropylene centrifuge tube (Sarstadt, Nuembrecht, Germany), and 1.0 ml (for soy milk) or 4.0 ml (for roasted soybean flour) of GE1 buffer, 20 l (for soy milk) or 40 l (for roasted soybean flour) of proteinase K solution (20 mg/ml), 2 l of. amylase solution (60 units/ l) and 10 l of. RNase A solution (100 mg/ml) were added and vortexed. The mixture was incubated at 65°C for 30 min, with vortexing every 10 min during incubation. Then, 200 l (for soy milk) or 400 l (for roasted soybean flour) of 0.3 or 1.0 M potassium acetate (pH 3.5, 4.5 or 5.5) or 2.0 M potassium acetate (pH 3.7, 4.5 or 5.5) was added to the mixture, and mixed well by inverting. The mixture was centrifuged for 10 min at 4,000. g using a KUBOTA 3780 (KUBOTA, Tokyo, Japan) and. 800 l of supernatant was transferred to a 2 ml microcentrifuge tube. Six hundred microliters of. - 31 -.
(35) 8.0 M guanidine hydrochloride (condition A), or 300 l of 8.0 M guanidine hydrochloride and 300 l of 2-propanol (condition B) was added to the supernatant and mixed well by inverting. The mixture was centrifuged for 5 min at 10,000. g, and first, half of the supernatant (about 700. l) was transferred to the spin column. The spin column was centrifuged for 1 min at 10,000. g,. and the filtrate was removed. The remaining supernatant was transferred to the same spin column, and the spin column was centrifuged for 1 min at 10,000. g. After removing the filtrate, 600 l. of GW buffer was added to the spin column, and the spin column was centrifuged for 1 min at 10,000. g. After removing the filtrate, the spin column was re-centrifuged for 1 min at 10,000. g and placed in a correction tube. The DNA was eluted by the addition of 50 l of TE (10 mM Tris-HCl, pH8.0, 1 mM ethylenediaminetetraacetate (EDTA)) buffer (pH 8.0), incubation for 3 min at room temperature and centrifugation for 1 min at 10,000. g. The DNA extraction was. subjected to real-time PCR assay as described below.. 2.3 Optimization of proteinase K treatment for lysing processed foods Soy milk and roasted soybean flour samples were employed in determining the optimal amount of proteinase K for DNA extraction from processed foods. One gram of sample was transferred to a 50 ml polypropylene centrifuge tube and 1.0 ml (for soy milk) or 4.0 ml (for roasted soybean flour) of GE1 buffer, 0, 10, 20, 40, 80 l of proteinase K solution (20 mg/ml), 2 l of -amylase solution (60 units/ l) and 10 l of RNase A solution (100 mg/ml) were added and vortexed vigorously. The mixture was incubated at 65°C for 0, 15, 30, 45, 60 min with vortexing every 15 min during incubation. Then, 200 l (for soy milk) or 400 l (for roasted soybean flour) of 2.0 M potassium acetate (pH 3.7) was added to the mixture, and mixed well by inverting. The mixture was centrifuged for 10 min at 4,000. - 32 -. g using a KUBOTA 3780, and 800.
(36) l of supernatant was transferred to a 2 ml microcentrifuge tube. Six hundred microliters of 8.0 M guanidine hydrochloride was added to the supernatant and mixed well by inverting. The mixture was centrifuged for 5 min at 10,000. g, and half of the supernatant (about 700 l) was. transferred to the spin column. The spin column was centrifuged for 1 min at 10,000. g, and the. filtrate was removed. The remaining supernatant was transferred to the same spin-column, and the spin column was centrifuged for 1 min at 10,000. g. After removing the filtrate, 600 l of. GW buffer was added to the spin column, the spin column was centrifuged for 1 min at 10,000 g. After removing the filtrate, the spin column was re-centrifuged for 1 min at 10,000. g, and. placed in a correction tube. The DNA was eluted by the addition of 50 l of TE (pH 8.0), incubation for 3 min at room temperature and centrifugation for 1 min at 10,000. g. The DNA. extracts were subjected to real-time PCR assay as described below.. 2.4 Development of a novel DNA extraction method for processed foods 2.4.1 DNA extraction from wet processed foods (soy milk, miso, canned whole kernel sweet corn) One gram of sample (ground and mixed with water) was transferred to a 50 ml polypropylene centrifuge tube, then 1.0 ml of GE1 buffer, 20 l of proteinase K solution (20 mg/ml), 2 l of -amylase solution (60 units/ l) and 10 l of RNase A solution (100 mg/ml) were added and vortexed vigorously. The mixture was incubated at 65°C for 30 min, with vortexing every 5 min during incubation. Then, 200 l of 2.0 M potassium acetate (pH 3.7) was added to the mixture and mixed well by inverting. The mixture was centrifuged for 10 min at 4,000. g. using a KUBOTA 3780, and 800 l of supernatant was transferred to a 2 ml micro centrifuge tube. Six hundred microliters of 8.0 M guanidine hydrochloride was added to the supernatant and. - 33 -.
(37) mixed well by inverting. The mixture was centrifuged for 5 min at 10,000. g, and half of the. supernatant (about 700 l) was transferred to the spin column. The spin column was centrifuged for 1 min at 10,000. g, and the filtrate was removed. The remaining supernatant was transferred. to the same spin-column, and centrifuged for 1 min at 10,000. g. After removed the filtrate, 600. l GW buffer was added to the spin column, and the spin column was centrifuged for 1 min at 10,000. g. After removing the filtrate, the spin column was re-centrifuged for 1 min at 10,000. g, and placed in a correction tube. The DNA was eluted by the addition of 50 l of TE (pH 8.0), incubation for 3 min at room temperature and centrifugation for 1 min at 10,000. g.. 2.4.2 DNA extraction from dry processed foods (roasted soybean flour, corn snack, dried soup mix) One gram of sample was transferred to a 50 ml polypropylene centrifuge tube, and 4.0 ml of GE1 buffer, 20 l of proteinase K solution (20 mg/ml), 2 l of -amylase solution (60 units/ l) and 10 l of RNase A solution (100 mg/ml) were added and vortexed. The mixture was incubated at 65°C for 30 min, with vortexing every 5 min during incubation. Then, 500 l of 2.0 M potassium acetate (pH 3.7) was added to the mixture and mixed well by inverting. Afterwards, the same procedure as 4.1 was performed.. 2.5 Conventional DNA extraction methods for processed foods 2.5.1 Silica membrane-based method The silica membrane-based method was performed with the DNeasy® Plant Maxi kit (QIAGEN, Hilden, Germany) as described in the Japanese Agricultural Standard (JAS) analytical test handbook. According to the handbook, protocols A and B were applied to processed food made from soybean and maize, respectively [5].. - 34 -.
(38) 2.5.2 CTAB-based method The CTAB-based method was performed as described in the JAS analytical test handbook [5]. 2.5.3 CTAB/Silica membrane-based method The CTAB/Silica membrane-based method was performed with the DNeasy® mericonTM Food kit (QIAGEN) as described in the manufacturer’s protocol for small DNA fragments. 2.5.4 Anion exchange resin-based method The anion exchange resin-based method was performed with the Genomic-tip 20/G kit (QIAGEN) as described in the JAS analytical test handbook [5].. 2.6 Estimation of amount and quality of extracted DNA The concentration of DNA solutions was determined by both UV absorption and fluorescence detection of DNA intercalation. The UV absorbance at 260 nm was measured using a DU-800 spectrophotometer (Beckman Coulter, FL, USA). Fluorescence intercalator detection was carried out using the PicoGreen ® dsDNA Quantitation Kit (Molecular Probes, OR, USA) according to the manufacturer’s protocol. The fluorescence of DNA sample was measured at 520 nm after excitation at 480 nm using a InfiniteTM F200 (Tecan, Mannedorf, Switzerland).. 2.7 Agarose gel electrophoresis of extracted DNA Agarose gel electrophoresis was carried out with 1% (w/v) Agarose S gel (NIPPON GENE) in Tris-acetate-ethylenediaminetetraacetate (TAE) buffer with 0.5 g/ml of ethidium bromide. Ten microliters of solution including 250 ng of DNA was mixed with 2 l of 6. loading buffer,. and the samples were subjected to electrophoresis at a constant voltage (100 V) for approximately. - 35 -.
(39) 30 min in TAE buffer. After the electrophoresis, the gel was photographed under UV radiation using a densitograph system (ATTO, Tokyo, Japan).. 2.8 Real-time PCR assay of extracted DNA For processed soy foods, the copy number of the taxon-specific gene encoding the soy lectin1 (Le1) was analyzed by real-time PCR. For processed maize foods, the taxon-specific sequence encoding the maize starch synthase IIb gene (SSIIb) was analyzed. The PCR amplification was carried out in 25 μl total reaction volume containing 2.5 μl of a DNA extract, 12.5 μl of TaqMan® Universal PCR Master Mix (Life Technologies, CA, USA), 0.5 μM of the primer pair and 0.2 μM of double dye-labeled probe. PCR amplifications were performed using the following program: preincubation at 50°C for 2 min and 95°C for 10 min, 45 cycles of denaturation at 95°C for 30 sec, and annealing and extension at 59°C for 1 min. The GM maize detection SSIIb03 (for endogenous gene) oligonucleotide set and the GM soybean detection Le1 (for endogenous gene) oligonucleotide set (NIPPON GENE) were used as primers and probes. The oligonucleotide probes were labeled with 6-carboxyfluorescein (FAM) and 6carboxytetramethyl-rhodamine (TAMRA) at the 5’ and 3’ ends, respectively. The ABI PRISMTM 7500 Fast Sequence Detection System (Life Technologies) was used as the real-time PCR instrument.. - 36 -.
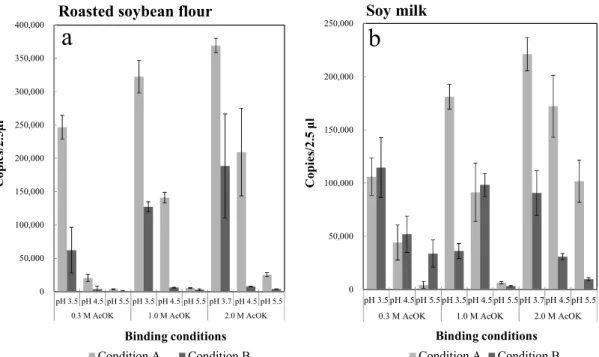
(40) 3. Results and discussion 3.1 Development of new DNA extraction method for processed foods 3.1.1 Optimization of buffer condition for DNA recovery from processed foods To mix a sample sufficiently and recover supernatant, adequate volumes of GE1 buffer were different for dry and wet processed foods. Therefore, processed foods were fell into two categories, dry and wet materials, based on its water content. We chose roasted soybean flour and soy milk as representative samples of dry and wet materials, respectively, in order to determine the optimal condition for efficient DNA extraction and purification from both kinds of processed food. First, several different buffer conditions were compared concerning binding efficiency of DNA to the silica membrane (Figure 2-1). Copy numbers of Le1 measured using real-time PCR were used as an indicator of DNA yield. For extraction of proteins and saccharides, potassium acetate buffer of various concentrations and pH were prepared. To boost DNA binding to the silica membrane, guanidine hydrochloride was used as a chaotropic agent. For condition A, 8.0 M of guanidine hydrochloride was used in accordance with the original report of the silica membranebased method by Boom R. et al [58]. For condition B, a mixture of equal volumes of 8.0 M of guanidine hydrochloride and 2-propanol was used, the same as for the GM quicker 2 kit. The results indicated that extracted DNA bound to the silica membrane most efficiently under condition A with using 2.0 M potassium acetate buffer (pH 3.7). Thus 2.0 M potassium acetate (pH 3.7) and guanidine hydrochloride (condition A) were selected as buffers for the developed method. Adoption of condition A, which does not require 2-propanol, is expected to simplify the DNA extraction process.. - 37 -.
(41) 400,000. Roasted soybean flour. 250,000. a. Soy milk. b. 350,000 200,000. Copies/2.5 μl. Copies/2.5μl. 300,000. 250,000. 200,000. 150,000. 150,000. 100,000. 100,000 50,000 50,000 0. 0 pH 3.5 pH 4.5 pH 5.5 pH 3.5 pH 4.5 pH 5.5 pH 3.7 pH 4.5 pH 5.5 0.3 M AcOK. 1.0 M AcOK. pH 3.5 pH 4.5 pH 5.5 pH 3.5 pH 4.5 pH 5.5 pH 3.7 pH 4.5 pH 5.5 0.3 M AcOK. 2.0 M AcOK. 2.0 M AcOK. Binding conditions. Binding conditions Condition A. 1.0 M AcOK. Condition A. Condition B. Condition B. Figure 2-1 Real-time PCR analysis of DNA extracts obtained under the various buffer conditions. A, roasted soybean; B, soy milk. Error bars indicate the standard deviation for three replicates. AcOK means potassium acetate.. 3.1.2 Optimization of proteinase K-treatment condition Optimal volume of proteinase K and incubation time were examined (Figure 2-2). Figure 2-2 shows that DNA can be extracted efficiently from roasted soybean flour using more than 10 μl of proteinase K for a longer than 30 min-digestion, and from soy milk using more than 10 μl of proteinase K for a longer than 15 min-digestion. In Figure 2-2, the copies numbers at 0 min were increased depending on the amount of proteinase K. We speculated that the proteinase K reacted during a short time until the reaction stop by the acidic potassium acetate buffer. To make the developed method applicable for a variety of foods that differ in protein content, a 20 μl volume of proteinase K and 30 min digestion time were selected.. - 38 -.
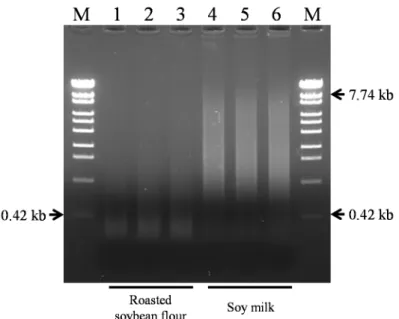
(42) 450,000 400,000. Roasted soybean flour. 250,000. a. b. 200,000. Copies/2.5 μl. 350,000. Copies/2.5 μl. Soy milk. 300,000 250,000. 150,000. 200,000 100,000 150,000 100,000. 50,000. 50,000. 0 μl. 10 μl. 20 μl. 40 μl. 80 μl. Proteinase K(20 mg/ml). 0. 0 min 15 min 30 min 45 min 60 min 0 min 15 min 30 min 45 min 60 min 0 min 15 min 30 min 45 min 60 min 0 min 15 min 30 min 45 min 60 min 0 min 15 min 30 min 45 min 60 min. 0 min 15 min 30 min 45 min 60 min 0 min 15 min 30 min 45 min 60 min 0 min 15 min 30 min 45 min 60 min 0 min 15 min 30 min 45 min 60 min 0 min 15 min 30 min 45 min 60 min. 0. 0 μl. 10 μl. 20 μl. 40 μl. 80 μl. Proteinase K(20 mg/ml). Figure 2-2 Real-time PCR analysis of DNA extracts obtained under the various proteinase K digestion conditions. A, roasted soybean; B, soy milk. Error bars indicate the standard deviation for three replicates.. 3.2 Evaluation of extracted DNA from processed foods by agarose-gel electrophoresis Extracted DNA from roasted soybean flour and soy milk generated by the developed method were analyzed by agarose gel electrophoresis (Figure 2-3). For DNA extracted from soy milk, smears of DNA fragments were observed in the range between 0.42 kb and 7.74 kb. On the other hand, only DNA fragments shorter than 0.42 kb were obtained from DNA extracted from roasted soybean flour. These results show that various length of DNA fragments, from short to long, can be recovered by the developed method.. - 39 -.
(43) Figure 2-3 Analysis of DNA fragmentation using ethidium bromide-stained agarose gel electrophoresis. Lane M, λ/Sty I digest (OneSTEP Marker 6, NIPPON GENE); Lane 1 to 3, DNA extracts from roasted soybean flour; Lanes 4 to 6, DNA extracts from soy milk.. 3.3 Evaluation of extracted DNA from processed foods by absorbance measurements and PicoGreen® assay UV absorbance at 260 nm is the most commonly used for DNA quantitation method; however, it is possible that the proteins or saccharides remaining in the DNA extracts may result in inaccurate readings. Meanwhile, although the PicoGreen® assay takes longer operation time and higher cost, it can detect double stranded DNA with high specificity. We measured DNA concentration using these two different methodologies. The DNA samples were extracted from processed foods (soy milk, roasted soybean flour, miso, canned whole kernel sweet corn, corn snack and dried soup mix) using the newly developed method and four other methods (Silica membrane-based, CTAB-based, CTAB/Silica membrane-based and anion exchange resin-based method). Then, the amounts of DNA were analyzed in triplicate (Table 2-1). In the official GMO testing methods12), the use of DNA diluted to 10 ng/ l is recommended. The developed method. - 40 -.
(44) and anion exchange resin-based method gave us above 10 ng/ l of DNA, while the other 3 methods showed insufficient DNA yield from several samples. Meanwhile, the anion exchange resin-based method showed large differences in the results of roasted soybean flour and dried soup mix, suggesting that impurities remained in the DNA extracts. These results support that the developed method is a better choice in terms of stable DNA yield and purity.. Table 2-1 Comparison of DNA yields by five DNA extraction methods. Absorbance measurements. Sample name. Extraction method New silica membrane-based method. Roasted soybean flour. Silica membrane-based method CTAB-based method CTAB/Silica membrane-based method Anion exchange resin-based method New silica membrane-based method Silica membrane-based method. Soy milk. CTAB-based method CTAB/Silica membrane-based method Anion exchange resin-based method New silica membrane-based method. Miso. Silica membrane-based method CTAB-based method CTAB/Silica membrane-based method Anion exchange resin-based method. Canned whole kernel sweet corn. New silica membrane-based method Silica membrane-based method CTAB-based method CTAB/Silica membrane-based method Anion exchange resin-based method New silica membrane-based method Silica membrane-based method. Corn snack. CTAB-based method CTAB/Silica membrane-based method Anion exchange resin-based method New silica membrane-based method Silica membrane-based method. Dried soup mix. CTAB-based method CTAB/Silica membrane-based method Anion exchange resin-based method. DNA Conc. (ng/μl). ®. PicoGreen assay DNA Conc. (ng/μl). (i). (i). Means. S.D.. Means. S.D.. 105.62 119.15 240.08 42.30 2218.50 80.18 8.57 18.50 35.88 272.90 44.77 7.62 7.38 5.53 171.28 71.42 636.70 127.23 6.02 604.83 50.25 121.07 22.23 6.43 238.68 224.80 173.97 64.10 27.08 1661.33. 7.05 20.59 56.00 1.86 43.49 6.46 6.74 1.37 1.10 15.77 1.24 2.14 0.51 0.53 7.67 7.46 198.36 13.72 0.53 21.88 2.81 13.70 5.06 0.32 20.21 29.20 47.15 4.45 3.35 119.05. 119.86 88.04 46.01 25.39 535.92 49.90 3.97 6.79 14.04 160.91 92.36 9.17 15.93 5.76 337.07 89.19 20.12 17.17 4.65 401.44 19.88 14.31 6.73 1.71 113.37 165.36 133.09 38.17 18.02 405.99. 4.98 6.11 9.54 0.84 11.68 4.86 3.80 0.42 1.19 6.28 4.42 3.32 1.13 0.55 1.50 13.32 0.40 2.01 0.70 10.61 3.50 1.36 0.88 0.04 8.99 6.76 36.55 4.31 1.86 6.86. (i) S.D. means standard deviation. n = 3.. - 41 -.
(45) 3.4 Evaluation of extracted DNA from processed foods by Real-time PCR analysis DNA extracted from processed soy and maize foods were analyzed by real-time PCR without adjustment of DNA concentration (Tables 2-2 and 2-3). Although the anion exchange resin-based method showed high DNA concentration (Table 2-1), the DNA sample from roasted soybean flour did not show DNA amplification in the real-time PCR analysis. We speculated that the failed DNA amplification was attributed to PCR inhibition. To evaluated PCR inhibition in real-time PCR analyses, therefore, the DNA samples which were diluted 10-fold with TE buffer were also analyzed by real-time PCR and then, the obtained copy numbers were multiplied by 10 for comparison with the measurement results of the undiluted samples (Table 2-2 and 2-3). In case of the DNA samples from canned whole kernel sweet corn and dried soup mix, the calculated copy numbers from diluted samples were more than 100-fold higher, suggesting that undiluted samples caused PCR inhibition. Meanwhile, all the DNA extracts obtained by the developed method were not subject to PCR inhibition even in the undiluted state. To compare the DNA extraction methods in terms of DNA extraction efficiency, total DNA copies obtained from 1 gram of the respective initial samples were calculated (Tables 2-2 and 23). Regarding the DNA samples which showed PCR inhibition i.e., DNA samples from roasted soybean flour, canned whole kernel sweet corn and dried soup mix by the anion exchange resinbased method, the copy numbers obtained from diluted samples were adopted for the calculation. The measured copy number in 2.5 l of DNA sample was multiplied by the elution volume and divided by the weight of the initial sample. The calculated total copy numbers by the developed method was the highest for miso, the second highest for the canned whole kernel sweet corn and corn snack and the third highest for the other three processed food samples. We concluded that. - 42 -.
(46) the developed method was comparatively good in terms of the DNA yield from a certain amount of starting material.. 3.5 Comparison of DNA extraction methods in terms of handling To compare the usability of the DNA extraction methods, handling time, the number of pipette operations and use of toxic organic solvent were assessed and are summarized in Table 24. This survey revealed that the newly developed silica membrane-based method permitted the shortest handling time and the smallest number of pipette operations. Additionally, the method did not require toxic organic solvents. It is clear that our new silica membrane-based method is superior in terms of user-friendliness.. - 43 -.
(47) Table 2-2 Real-time PCR analysis of DNA extracts from processed soy foods. Sample name. Extraction method New silica membrane-based method Silica membrane-based method. Roasted soybean flour. CTAB-based method CTAB/Silica membrane-based method Anion exchange resin-based method New silica membrane-based method Silica membrane-based method. Soy milk. CTAB-based method CTAB/Silica membrane-based method Anion exchange resin-based method New silica membrane-based method Silica membrane-based method. Miso. CTAB-based method CTAB/Silica membrane-based method Anion exchange resin-based method. Le1 copy number/2.5 l Means 49325.63 50006.84 11821.04 21518.22 9109.98 8082.47 6674.50 3707.23 N.D. 301189.00 135828.44 138207.22 13472.48 8586.11 15667.50 10901.33 10106.03 4618.56 418532.00 347826.67 2792.68 2432.71 228.12 202.85 262.10 172.20 149.88 79.30 5361.06 5217.98. Sample. (ii). (ii). (ii). (ii). S.D. 1951.63 3323.63 1951.04 2967.09 2042.37 1921.79 577.10 170.70. 3. weight (g). Elution volume (μl). (ii). 1.0. 50. 986.51. (ii). 1.0. 100. 472.84. (ii). 0.2. 100. 1822.00. (ii). 2.0. 100. 133.49. (ii). 2.0. 50. 3011.89. (ii). 1.0. 50. 2716.57. (ii). 1.0. 100. 538.90. (ii). 0.2. 100. 3133.50. (ii). 2.0. 100. 202.12. (ii). 2.0. 50. 4185.32. (ii). 1.0. 50. 55.85. (ii). 1.0. 100. 9.12. (ii). 0.2. 100. 52.42. (ii). 2.0. 100. 3.00. (ii). 2.0. 50. 53.61. (i). Total ×10 copies /1 g sample. (iii) (ii). (ii). (ii). (ii). (ii). (ii). (ii). (ii). (ii). (ii). (ii). 18924.38 16608.37 4649.92 10837.53 10052.22 1156.56 813.29 846.67 332.49 21997.07 54309.70 230.39 109.09 71.28 117.24 16.58 42.04 3.15 22.21 907.34 238.50. (ii). (i) S.D. means standard deviation. (ii) DNA samples were diluted 10-fold with TE buffer, and the obtained quantitative value was multiplied by 10. (iii) N.D. means not detected. - 44 -.
(48) Table 2-3 Real-time PCR analysis of DNA extracts from processed maize foods. Sample name. Extraction method New silica membrane-based method Silica membrane-based method. Canned whole kernel sweet corn. CTAB-based method CTAB/Silica membrane-based method Anion exchange resin-based method New silica membrane-based method Silica membrane-based method. Corn snack. CTAB-based method CTAB/Silica membrane-based method Anion exchange resin-based method New silica membrane-based method Silica membrane-based method. Dried soup mix. CTAB-based method CTAB/Silica membrane-based method Anion exchange resin-based method. SSⅡb copy number/2.5 l. Sample. Means. weight (g) (ii). 1.0. 50. 170.53. (ii). 1.0. 100. 61.47. (ii). 0.2. 100. 125.61. (ii). 2.0. 100. 6.37. (ii). 2.0. 50. 198.88. (ii). 1.0. 50. 15.00. (ii). 1.0. 100. 8.37. (ii). 0.2. 100. 13.99. (ii). 2.0. 100. 1.43. (ii). 2.0. 50. 20.46. (ii). 1.0. 50. 4106.22. (ii). 1.0. 100. 5166.91. (ii). 0.2. 100. 3283.01. (ii). 2.0. 100. 437.50. (ii). 2.0. 50. 11217.62. S.D. 508.66. 8526.71 5108.83 1536.81 1257.50 628.06 519.58 318.56 117.32 4.17 19887.52 749.86 603.87 209.30 200.51 69.95 89.82 71.32 49.21 2046.13 1786.51 205311.00 194405.44 129172.68 119840.50 16415.04 13302.74 21875.12 11439.08 3232.16 1121762.22. (ii). (ii). (ii). (ii). (ii). (ii). (ii). (ii). (ii). (ii). (ii). (ii). (ii). (ii). (ii). 992.13 118.15 87.62 15.31 29.78 72.60 58.00 4.53 1642.11 82.81 82.00 102.54 64.59 9.47 18.95 10.87 13.37 122.63 259.51 12155.67 24353.90 30538.63 34993.75 1886.49 721.43 2858.30 1149.47 1493.46 45616.94. 3. Elution volume (μl). (i). Total ×10 copies /1 g sample. (ii). (ii). (i) S.D. means standard deviation. (ii) DNA samples were diluted 10-fold with TE buffer, and the obtained quantitative value was multiplied by 10. - 45 -.
(49) Table 2-4 Summary of operation procedures of the DNA extraction methods. DNA extraction method Method name New silica membrane-based method. Commercially available kit GM quicker 2 kit. Anion exchange resin-based method. DNeasy mericon. (ii). 26. -. (ii). 19. -. 19. Phenol and chloroform. 11. Chloroform. 40. -. 130 min TM. Food kit. Genomic-tip 20/G. 70 min (ii). 130 min (+12-24 hours). (i) Approximate time needed for DNA extraction from one sample. (ii) DNA precipitant was suspended for 12-24 hours. (iii) When using micropipettes up to 5 ml. (ⅳ) Toxic organic solvents as designated by the Poisonous and Deleterious Substances Control Act of Japan.. - 46 -. ). -. 160 min (+12-24 hours). DNeasy Plant Maxi kit. (. Toxic organic solvent ⅳ. 11. ®. Silica membrane-based method (protocol B, for maize). ®. 60 min 190 min (+12-24 hours). DNeasy Plant Maxi kit. CTAB-based method. (iii). pipette operations. ®. Silica membrane-based method (protocol A, for soybean). CTAB/Silica membrane-based method. The number of. (i). Handling time.
(50) CHAPTER 3 A novel detection system for the genetically modified canola (Brassica rapa) line RT73. - 47 -.
(51) 1. Introduction. In recent years, great advances have been made in food biotechnology including transgenic crop breeding and genetic modification for food production. In some countries, however, the acceptance of genetically modified (GM) food by consumers remains controversial, and concerns about safety persist among the public. GM products have been approved for use in animal feed and human food in some countries, based on individual criteria for safety assessment. In the European Union (EU), the approval and use of GM food and feed are stipulated by the provisions of European Community (EC) regulations 1829/2003 and 1830/2003 [62, 63]. Japan has also announced a mandatory safety assessment of GM foods and processed foods containing GM ingredients. Since April 1, 2001, any GM food that has not been approved is prohibited from import or sale in Japan. Methods for the qualitative detection of regulated and unapproved GM foods are therefore required. We previously reported techniques for the qualitative detection of GM maize, potatoes, papayas, rice, and flax, which included polymerase chain reaction (PCR) methods and a histochemical assay [17, 19, 20, 64-73]. Canola is the source of 13% of the world’s oilseed, and is second only to soybean in terms of its contribution to global oilseed production [74]. GM canola was reported to be one of the four principal GM crops worldwide, and to occupy 6.4 million hectares representing 5% of the global crop area in 2009 [75]. Other members of the Brassica genus include a wide variety of commercially cultivated species, including broccoli, cauliflower, cabbages, kale, Brussels sprouts, wong-bok, turnips, kohlrabi, swedes, rutabagas, and mustards. The GM Roundup Ready canola (B. napus) line RT73 (also known as GT73), which is tolerant to the herbicide glyphosate, was developed by the Monsanto Company (St. Louis, MO). - 48 -.
(52) To produce RT73 B. napus, one exogenous recombinant DNA molecule that contained two exogenous herbicide-tolerance gene cassettes, the CP4 5-enolpyruvylshikimate-3-phosphate synthase gene (CP4-EPSPS) and the glyphosate oxidoreductase gene from Achromobacter sp. strain LBAA (GOX v247) was transformed into the rapeseed genome [76]. These genes confer novel tolerance to glyphosate, which can control or suppress economically important weeds in canola production. RT73 B. napus has been approved for environmental release, and for use in feed and food worldwide. However, seed companies have developed three B. rapa canola (RT73 B. rapa) lines (ZSR500, ZSR502, and ZSR503) derived from interspecific crosses with RT73 B. napus, which have not been approved in Japan as the effects of crossing species are unclear (http://www.inspection.gc.ca/english/plaveg/bio/dd/dd9821e.shtml). On December 21, 2005, the Japanese government reported the possibility of importing unapproved Canadian GM canola into Japan. The RT73 B. rapa lines have been approved in Canada, and were cultivated there in 2004 and 2005. According to online information, this GM canola accounted for 0.009% of the total planted acreage, and it was deleted from the seed registry in 2003 (http://www5d.biglobe.ne.jp/ ∼ cbic/english/2006/journal0602.html). Although GM canola is unlikely to be cultivated in the future, the possibility of contamination by pollen and seed spillage remains. The potential for unapproved GM canola to be exported into Japan is therefore likely to exist for some time. To detect and identify RT73 B. rapa contamination in imported canola samples, it is necessary both to distinguish B. rapa and B. napus and, simultaneously, to detect an RT73specific sequence in individual kernels. The present study developed a novel system for detecting contamination by RT73 B. rapa in canola grain samples by single-kernel analysis, which comprised DNA extraction from individual canola kernels, the discrimination of B. napus and B.. - 49 -.
(53) rapa, and the identification of an RT73-specific sequence.. - 50 -.
(54) 2. Materials and methods 2.1 Plant Materials The GM canola line RT73 (RT73 B. napus) and non-GM B. napus (Eagle) were kindly supplied by the Monsanto Company, St. Louis, MO. The following non-GM Brassica lines were purchased from the National Institute of Agrobiological Sciences Genebank (Tsukuba, Ibaraki, Japan): the Wase syokuyou aburana, Maruba natane, Gokuwase natanena, Wakana, Niida aona, Nozawana, Shin kuro mizuna, Shinobu fuyuna, and Narusawana lines of B. rapa; the Westar, Nugget, and N-404 lines of B. napus; the Awasa selection line of B. carinata; the Kaichoy line of B. juncea; the Debre zeit local line of B. nigra; and the Badger ball head year line of B. oleracea. The B. rapa lines C147, C148, C149, C150, and C155, which were originally grown in Canada, were kindly supplied by the Tohoku University Brassica Seed Bank (Sendai, Miyagi, Japan).. 2.2 Grinding of Individual Canola Kernels. Canola kernels were ground using a Multibeads shocker (MB601NIHS) with a 96 deepwell plate (PTD-96), a cap mat for a 96 deep-well plate (CPD-96), and disruption medium (MC96415R; all from Yasui Kikai Co., Osaka, Japan) at 1500 rpm for 20 s [77, 78]. To remove contamination by powder or broken seeds, the kernels were washed with 5% (w/v) sodium dodecyl sulfate (SDS), rinsed with distilled water (DW), and dried at 65 °C for 1 h in the incubation box before being ground.. 2.3 Oligonucleotide Primers and Probes for Duplex Real-Time PCR. To analyze the acetyl-CoA carboxylase (ACCg8) genes of B. rapa and B. napus, we. - 51 -.
図

+7


関連したドキュメント
今日のお話の本題, 「マウスの遺伝子を操作する」です。まず,外から遺伝子を入れると
厳密にいえば博物館法に定められた博物館ですらな
「 Platinum leaf counter electrodes for dye-sensitized solar cells 」 Kazuhiro Shimada, Md. Shahiduzzaman,
「 Platinum leaf counter electrodes for dye-sensitized solar cells 」 Kazuhiro Shimada, Md. Shahiduzzaman,
Mapping Satoshi KITAYAMA and Hiroshi YAMAKAWA Waseda University,Dept.of Mech.Eng.,59‑314,3‑4‑1,Ohkubo,Shinjuku‑ku Tokyo,169‑8555 Japan This paper presents a method to determine
再生可能エネルギーの中でも、最も普及し今後も普及し続けるのが太陽電池であ る。太陽電池は多々の種類があるが、有機系太陽電池に分類される色素増感太陽 電池( Dye-sensitized
第四章では、APNP による OATP2B1 発現抑制における、高分子の関与を示す事を目 的とした。APNP による OATP2B1 発現抑制は OATP2B1 遺伝子の 3’UTR
マーカーによる遺伝子型の矛盾については、プライマーによる特定遺伝子型の選択によって説明す
