Japan Advanced Institute of Science and Technology
JAIST Repository
https://dspace.jaist.ac.jp/Title
Rotational and vibrational state distribution of
H_2 activated on a heated tungsten filament
Author(s)
Umemoto, Hironobu; Ansari, S. G.; Matsumura,
Hideki
Citation
Journal of Applied Physics, 99(4):
043510-1-043510-6
Issue Date
2006-02-22
Type
Journal Article
Text version
publisher
URL
http://hdl.handle.net/10119/4523
Rights
Copyright 2006 American Institute of Physics.
This article may be downloaded for personal use
only. Any other use requires prior permission of
the author and the American Institute of Physics.
The following article appeared in Hironobu
Umemoto, S.G. Ansari, and Hideki Matsumura,
Journal of Applied Physics, 99(4), 043510 (2006)
and may be found at
http://link.aip.org/link/?JAPIAU/99/043510/1
Rotational and vibrational state distributions of H
2activated on a heated
tungsten filament
Hironobu Umemoto,a兲S. G. Ansari, and Hideki Matsumura
School of Materials Science, Japan Advanced Institute of Science and Technology, Asahidai, Nomi, Ishikawa 923-1292, Japan
共Received 22 August 2005; accepted 3 January 2006; published online 22 February 2006兲 The rotational and vibrational state distributions of H2activated on a heated tungsten filament were determined by employing a coherent anti-Stokes Raman scattering technique to examine the contribution to the catalytic chemical vapor deposition process. The rotational excitation could be confirmed and the distribution was Boltzmann-like. When the filament temperature was 2700 K and the H2pressure was over 1.3 kPa, the rotational temperature monitored 5 cm under the filament was
around 1200 K; it showed a sharp decrease below 670 Pa and it was 700 K at 67 Pa. This decrease in the rotational temperature suggests the importance of relaxation processes on the chamber walls. The first vibrationally excited H2molecules could also be identified at pressures over 670 Pa and the
vibrational temperature was not much different from the rotational one. This vibrational temperature is much lower than those in typical H2plasma, showing that the direct vibrational excitation of H2
on hot filaments is inefficient compared to its dissociation to two H atoms. © 2006 American
Institute of Physics.关DOI:10.1063/1.2173044兴
I. INTRODUCTION
One of the merits of catalytic chemical vapor deposition 共Cat-CVD, often called hot-wire CVD or hot filament CVD兲,
compared with conventional plasma-enhanced CVD
共PECVD兲, is the absence of charged species, such as ions and electrons, in the gas phase. With Cat-CVD, it is possible to prepare thin films without plasma damage.1–3Plasma dam-age can also be avoided in remote PECVD, in which the discharge and the deposition areas are separated.4,5 One of the possible differences between remote PECVD and Cat-CVD is the contribution of metastable excited species. For example, metastable N共22DJ兲 and N2共A3⌺u+兲, and possibly
N2共a
⬘
1⌺u−兲, can initiate reactive processes in nitrogen after
glow.6–8However, none of the excited states of H or H2are
metastable, except for H共22
S1/2兲 and H2共c3⌸u,= 0兲. 9
Since the electronic energies of H共22
S1/2兲 and H2共c3⌸u,= 0兲 are
much higher than the dissociation energy of the H–H bonds,
it may react with H2 molecules to rapidly produce two H
atoms in the presence of H2. H共22S1/2兲 may also be
colli-sionally relaxed to short-lived 22PJresonance states easily.
Then, the active species in remote plasma processes of H2
and those in catalytic activation may be similar; H共12 S1/2兲
and vibrationally excited H2共X1⌺g
+兲 should be the only active
species in these systems. One of the differences is in the H-atom population. In general, the population of H atoms in
catalytic decomposition is higher than in plasma
decomposition,10–12although high-density H atoms can also
be obtained by plasma under some conditions.4,13–16In addi-tion, there may also be a difference in the vibrational state distributions of H2. Vibrationally excited H2may be another
key species in discussing the difference between PECVD, both remote and conventional, and Cat-CVD. In general, the reaction rate constant increases with vibrational excitation.
Especially, the vibrational quantum of H2 is large and the
effect is large. For example, the vibrational excitation of H2
increases the rate constants for O共23PJ兲+H2 and
OH共X2⌸
J兲+H2 by more than two orders of magnitude.17,18
The rotational and vibrational state distributions of H2
after plasma excitation have been extensively
characterized.19–26The vibrational temperatures are, in gen-eral, more than 2000 K and the distribution is non-Boltzmann for highly excited levels. The rotational distribu-tions are not necessarily Boltzmann-like either but are generally cooler than the vibrational ones. The excitation of H2 on heated filaments, on the other hand, has been studied
less extensively,12,27–29and few studies have reported on vi-brational excitation. Hall and co-workers have shown that
highly vibrationally excited H2 molecules are produced in
hot filament excitation.27,29They monitored H−ions formed
by the dissociative attachment of electrons to H2molecules.
This technique is sensitive for detecting highly vibrationally excited H2 but is less sensitive for vibrational ground-state and first-excited-state H2.
In the present study, the rotational and vibrational state distributions of H2were examined after excitation on heated tungsten filaments. Since the most populated excited state must be the lowest one, H2共= 1兲, a coherent anti-Stokes
Raman scattering共CARS兲 technique was employed to
deter-mine the populations of the= 0 and= 1 levels, whereis the vibrational quantum number. Other techniques, such as
laser-induced fluorescence 共LIF兲 and resonant-enhanced
multiphoton ionization 共REMPI兲, are sensitive to detect
highly vibrationally excited H2 but are hard to apply to
= 0 and = 1 levels. Recently, we have reported that vibra-tionally excited CN radicals, CN共= 1兲, can be identified in
the catalytic decomposition of HCN.30The vibrational
tem-perature was 1900 K when the filament temtem-perature was 2300 K. If this is the case, the vibrational population ratio
a兲Electronic mail: [email protected]
关H2共= 1兲兴/关H2共= 0兲兴 should be 0.04, which is comparable
to that observed in typical plasma processes. Although no vibrationally excited states have been observed for SiH and
NH in the decomposition of SiH4 and NH3, respectively,
these species may not be the nascent products on the cata-lyzer surfaces.31,32
II. EXPERIMENT
A conventional CARS technique was employed to deter-mine the rotational and vibrational state distributions of H2.33,34The vacuum and laser systems were similar to those
described elsewhere.10,30–32,35,36A resistively heated tungsten
wire 共Nilaco 99.95%, 0.5 mm in diameter, and 170 cm in
length兲 was used to activate flowing molecular hydrogen in a vacuum chamber with a 45 cm internal diameter that was evacuated with a turbomolecular pump through a butterfly valve. The distance between the filament and the showerhead was 19 cm while that from the chamber bottom was 12 cm. The shortest distance between the filament and the chamber
sidewalls was 10 cm. The flow rate of H2 was fixed at 100
SCCM 共standard cubic centimeter per minute兲 共1 SCCM
= 6.9⫻10−7 mol s−1兲 while the pressure was changed
be-tween 27 Pa and 2.7 kPa by adjusting the butterfly valve. In CARS measurements, the second harmonic of a Q-switched
neodymium-doped yttrium aluminum garnet共Nd:YAG兲 laser
共Spectra Physics PRO-190-10兲 at 532 nm was split into two
parts. One part was used to pump a dye laser 共Lumonics
HD-500兲 whose output around 684 nm was used as the tun-able Stokes beamS. The Stokes pulse energy was 6 mJ. The
remaining part, 10 mJ/ pulse, was used directly as the pump
beam P. CARS spectra were recorded by monitoring the
intensity of the anti-Stokes signal beam AS= 2P−S
around 435 nm. The pump and the Stokes beams were
com-bined, made collinear at a beam combiner共dichroic mirror兲,
and focused into the chamber using a 400 mm focal length achromatic lens. The pump beam was optically delayed for proper temporal overlap with the dye laser beam. The anti-Stokes signal was separated from the pump and the anti-Stokes beams with a Pellin-Broca prism and was detected with a
photomultiplier tube 共Hamamatsu Photonics R212UH兲
through two glass filters 共Toshiba V-42 and C-40C兲 and a
monochromator 共JASCO CT25C兲. The slits of the
mono-chromator were widely opened to ensure the wavelength in-dependence of the detection sensitivity. This was checked by monitoring the nonresonant CARS signals in air. Neutral density filters were used when necessary. The photomulti-plier signal was amplified and processed with a boxcar
averager-gated integrator system 共Stanford Research
Sys-tems SR240/ SR250/ SR280兲 and was transferred to a
com-puter 共IBM PC300PL兲. The wave number of the dye laser
output was checked with a wave meter共Burleigh VA-5500兲.
The typical filament temperature was 2700 K, while the dis-tance between the filament and the detection zone was 5 cm.
H2 共Takachiho 99.999 95%兲 was used from a cylinder
with-out further purification.
III. RESULTS
Figure 1 shows typical CARS spectra when the filament was heated and unheated. When the filament was heated up to 2700 K, rotational levels up to J = 9 could be observed for the vibrational ground state, where J is the rotational quan-tum number. Vibrationally excited hydrogen, H2共= 1兲, could
also be identified for J = 1 and J = 3, although the signal in-tensities were three orders of magnitude weaker than those for H2共= 0兲. Figure 2 illustrates the H2pressure dependence
of the square root of the CARS signal intensity, showing the absence of signal saturation. Figure 3 shows the Boltzmann plots of the rotational distributions of H2共= 0兲 obtained
un-der three conditions. In this figure, the logarithm of the square root of the Raman signal intensity divided by the rotational degeneracy, 2J + 1, nuclear spin degeneracy, 1 or 3, and the J dependent part of the third-order nonlinear suscep-tibility, 6 + J共J+1兲/共2J−1兲共2J+3兲,28is plotted against the ro-tational energy. The three plots in Fig. 3 are all linear, sug-gesting that the rotational distributions are Boltzmann-like.
FIG. 1. Q-branch CARS spectra of H2.共a兲 H2pressure of 1.3 kPa without heating the filament;共b兲 H2pressure of 2.7 kPa with heating the filament up to 2700 K. The distance between the filament and the detection zone was 5 cm. The wavelength dependence of the Stokes laser intensity has been corrected.
FIG. 2. Square root of the CARS signal intensity of H2共= 0 , J = 3兲 as a function of H2pressure. The filament temperature was 2300 K. The intercept corresponds to the off-resonant CARS signal caused by air.
Similar plots could be obtained under other conditions, and the rotational temperatures are summarized in Table I. The rotational temperature when the filament was not heated was determined to be 310± 30 K, while those when the filament temperature was 2700 K were more than 1000 K in the
pres-ence of more than 670 Pa of H2. The error limits in the
rotational temperatures are standard deviations.
Our data analysis procedure of the CARS spectra was similar to those employed by Chen et al.,28 Shaub et al.,33 and Andrews et al.37In general, the CARS signal intensity is proportional to the products of the square of the third-order nonlinear susceptibility共3兲, the Stokes laser pulse intensity, and the square of the pump laser intensity. The pump laser intensity at 532 nm was fixed during the measurements. The Stokes laser intensity was around 10% weaker at shorter wavelength. The wavelength dependence was corrected in Fig. 1. The third-order nonlinear susceptibility 共3兲 can be expressed by a function of J and. It should be noted that
共3兲depends little on J but is proportional to+ 1. In other
words, the sensitivity to detect H2共= 1兲 is four times larger than for H2共= 0兲. Strictly speaking, the signal intensity de-pends on both the line-shape functions of the lasers and on a
factor that in turn depends on the frequencies and the focus-ing conditions.34 However, these factors were not taken into account in the present analysis. The error caused by such ignorance must be small since we could obtain a room-temperature rotational distribution when the filament was not heated. In general, in CARS measurements, only the popu-lation difference between the two molecular levels, such as 关H2共+ 1兲兴−关H2共兲兴, can be determined. However, since the
signal intensity corresponding to H2共= 1兲 was much smaller than that corresponding to H2共= 0兲, the contribution of the = 1 level was ignored in the evaluation of the population of the= 0 level, while that of the= 2 level was ignored in the evaluation of the= 1 level population.
CARS signals corresponding to H2共= 1 , J = 1兲 and
H2共= 1 , J = 3兲 could be identified at 3917 and 3888 cm−1,
respectively, as shown in Fig. 1. Other signals, such as those attributable to J = 2 or J = 5, were below the detection limit. The relative population of H2共= 1兲 and H2共= 0兲 was
evalu-ated from the populations of the J = 1 and J = 3 levels by
assuming the same rotational temperatures for the= 0 and
= 1 states. The results are summarized in Table I. It is rather difficult to evaluate the error limits for the vibrational popu-lation ratios, but ±20% may be inevitable. If we extrapolate the population ratios to typical CVD pressure conditions, such as 10 Pa, the population of H2共= 1兲 is estimated to be
0.7± 0.2% of that for H2共= 0兲. Under typical filament
tem-peratures for Cat-CVD, such as 2000 K, this population ratio should be much less.
We also tried to determine the rotational and the vibra-tional distributions by reducing the distance between the fila-ment and the detection zone to 2 cm. The relative population of H2共= 1兲 was slightly higher than it was at 5 cm. For
example, it was 0.014 when the filament temperature was
2700 K and the H2 pressure was 670 Pa. However, it was
found that the rotational Boltzmann plots are nonlinear. Similar results were obtained at other pressure conditions. The spatial distribution of rotationally excited H2must have been inhomogeneous.
It might be considered that only part of the H2 intro-duced into the chamber collides with the filament, and this is
FIG. 3. Rotational Boltzmann plots of H2共= 0兲. The H2pressures and the filament temperatures were 1.3 kPa and room temperature共䊊兲, 1.3 kPa and 2700 K共䊐兲, and 2.7 kPa and 2700 K 共쎲兲.
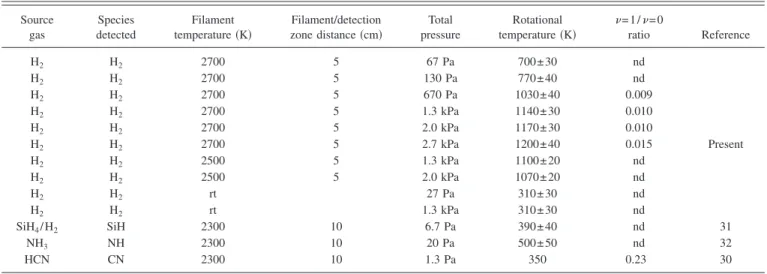
TABLE I. Rotational and vibrational population distributions of diatomic molecules in catalytic decomposition systems. nd: vibrationally excited levels were not detected. rt: room temperature.
Source gas Species detected Filament temperature共K兲 Filament/detection zone distance共cm兲 Total pressure Rotational temperature共K兲 = 1 /= 0 ratio Reference H2 H2 2700 5 67 Pa 700± 30 nd H2 H2 2700 5 130 Pa 770± 40 nd H2 H2 2700 5 670 Pa 1030± 40 0.009 H2 H2 2700 5 1.3 kPa 1140± 30 0.010 H2 H2 2700 5 2.0 kPa 1170± 30 0.010 H2 H2 2700 5 2.7 kPa 1200± 40 0.015 Present H2 H2 2500 5 1.3 kPa 1100± 20 nd H2 H2 2500 5 2.0 kPa 1070± 20 nd H2 H2 rt 27 Pa 310± 30 nd H2 H2 rt 1.3 kPa 310± 30 nd SiH4/ H2 SiH 2300 10 6.7 Pa 390± 40 nd 31 NH3 NH 2300 10 20 Pa 500± 50 nd 32 HCN CN 2300 10 1.3 Pa 350 0.23 30
the reason for the low population of H2共= 1兲. However, this
is not the case. It is possible to estimate how many times a hydrogen molecule collides with the filament before being evacuated. Since the area of the filament was 2.7⫻10−3m2, the number of collisions in unit time in the presence of 1.3 kPa of H2, 9.4⫻1022 m−3at 103K, is 2.0⫻1023 s−1. The H2
flow rate was 100 SCCM, that is, 4.2⫻1019 s−1. This ratio,
5⫻103, should be a measure of the number of collisions.
Although the above is a rough estimation, it may be con-cluded that all the molecules introduced collide with the fila-ment many times before being evacuated.
IV. DISCUSSION
Tables II and III summarize the rotational temperature and the ratio of the H2共= 1兲 population to that of H2共= 0兲 in hot filament and plasma excitation. Although the state dis-tributions must depend on the experimental conditions, such as the chamber geometry and total pressure, it can be con-cluded that the H2共= 1兲/H2共= 0兲 population ratio is smaller in hot filament excitation than in plasma excitation. Table IV compares the vibrational temperatures for highly excited lev-els,艌2. The temperature for plasma excitation is not nec-essarily higher than that for hot filament excitation in this case.
The cause of the vibrational excitation of H2 has been discussed extensively. In hot filament excitation, it is now well recognized that the highly vibrationally excited levels are produced on the chamber walls by a recombination pro-cess. Eenshuistra et al. found that the vibrational population ratio 关H2共= 5兲兴/关H2共= 4兲兴 depends little on the filament
temperature and concluded that the direct production of highly vibrationally excited H2on a hot filament is minor.38
They have proposed the Eley-Rideal process, in which H2共兲
is formed by the recombination of H atoms adsorbed on the surface with those coming from the gas phase. Their conclu-sion was further supported by Schermann et al., who showed that the vibrational state distribution remains constant when the filament temperature is changed.29 Schermann et al. also proposed the presence of a physisorbed H-atom layer on the chemisorbed one to explain the high vibrational excitation. This Eley-Rideal mechanism has also been supported by the-oretical calculations.39 In plasma, similar excitation pro-cesses must also be possible,25although collisional activation by electrons of energies in excess of 10 eV must also play some roles.23
The production processes of the first excited level, H2共= 1兲, on the other hand, may be different. In plasma
excitation, it has been proposed that low energy electrons, whose kinetic energy is less than 1 eV, collide with unexcited molecules to generate vibrational excitation.19,20This mecha-nism is consistent with the present result that the 关H2共
= 1兲兴/关H2共= 0兲兴 population ratio is smaller in the hot
fila-ment excitation where no free electrons are present. If low vibrational states such as H2共= 1兲 are also produced by the
recombination of two H atoms, the vibrational population ratio关H2共= 1兲兴/关H2共= 0兲兴 should be higher in hot filament excitation than in plasma, since more H atoms are expected to be produced in hot filament excitation. This is not the case as is shown in Tables II and III. The low vibrational states in plasma processes must be produced by collisions with sub-excited electrons. On hot filaments, dissociation to two H atoms should be more predominant than vibrational excita-tion for H2. The vibrational temperature of CN radicals pro-duced by the catalytic decomposition of HCN is higher than those of H2observed in the present work, although the
fila-ment temperature was lower.30 This may be because CN
TABLE II. Rotational and vibrational distributions of H2in hot filament excitation. Detection
technique
Filament temperature/ electric power
Filament/detection
zone distance共cm兲 Total pressure
Rotational temperature共k兲
= 1 /= 0 ratio
共vibrational temperature兲 Reference
CARS 2820 K / 2 kW 0.65 2.7 kPa 1590 28
H−monitoring 1770 K 6.7 Pa 700 0.002共960 K兲 29
CARS 2373 K 0.4 4.7 kPa共0.5%CH4兲 1600 12
CARS 2700 K / 3.0 kW 5 2.7 kPa 1200 0.015共1420 K兲 Present
67 Pa 700 0.007a共1200 K兲
aExtrapolated value.
TABLE III. Rotational and vibrational distributions of H2in plasma excitation. Detection technique Electric power/ voltage/current Total pressure Rotational temperature共k兲 = 1 /= 0 ratio
共vibrational temperature兲 Reference
CARS 90 V / 10 A 5.5 Pa 530 0.082共2390 K兲 19 REMPI 100 V / 10 A 1.2 Pa 390 0.090共2480 K兲 20 CARS 37.5 A 40 Pa 800a 0.037a共1800 K兲 22 1380b 0.091b共2500 K兲 CARS 0.5 W cm−3 200 Pa 600 0.22共3980 K兲 26 2.0 W cm−3 1.07 kPa 800 0.14共3000 K兲 aAxial position: 150 mm. bAxial position: 25 mm.
bonds are not broken on hot filaments and the vibrational excitation does not compete with the bond dissociation. In addition, CN radicals may deposit on chamber walls with a high efficiency and the vibrational temperature may be fro-zen. On the other hand, H2共兲 must be deactivated without
deposition.
The decrease not only in the rotational temperature but also in the vibrational temperature with the decrease in the H2pressure, as is shown in Table I, suggests the importance
of the relaxation processes on chamber walls, which were water cooled. Collisional relaxation in the gas phase may play some roles but is less important. This is consistent with the small rate constant for the vibrational relaxation of H2共兲
by H2.40Although the rate constant increases exponentially
with temperature, the rate constant at 1000 K is still in the order of 10−15cm3s−1.41
The rate constant for the vibrational relaxation by H is rather large because this may proceed via a chemical atom-transfer process, H + H2共= 1兲→H2共= 0兲
+ H.42,43However, the H-atom density may not be enough for this process to be important. Another possible explanation to the total pressure dependence of the rotational and vibra-tional temperatures is the contribution of termolecular H-atom recombination processes in the gas phase. The re-combination rate of two H atoms to produce rotationally and vibrationally excited H2 molecules must be larger at higher
pressures, although the termolecular rate constant is rather small, 3.8⫻10−33cm−6s−1 at 1200 K.44
However, if this is the case, as has been discussed above, more excitation is expected in hot filament than in plasma. The much lower vibrational temperature in the present system suggests that the recombination processes in the gas phase are less impor-tant.
V. CONCLUSIONS
The vibrational population ratio 关H2共= 1兲兴/关H2共= 0兲兴
in hot filament excitation is much lower than those observed in hydrogen plasma, even when the filament temperature is as high as 2700 K. The recombination reactions of two H atoms on the chamber walls may be important to produce highly vibrationally excited H2but are not important in the
production of H2共= 1兲. Under typical catalytic CVD
condi-tions, no vibrationally excited H2molecules are expected to
play any roles. This is in contrast to plasma processes, in which the interaction between subexcited electrons and
H2共= 0兲 contributes to the production of H2共= 1兲 and the high-density H2共= 1兲 molecules may also play a role.
ACKNOWLEDGMENTS
One of the authors 共S. G. A.兲 acknowledges a
postdoc-toral fellowship from the Japan Society for the Promotion of
Science共JSPS兲. This work was partially funded by a
Grant-in-Aid for Science Research共No. 17550009兲 from JSPS. The
authors are grateful to President Kyuzo Nakamura and Dr. Narishi Gonohe of Ulvac, Inc. for valuable discussions.
1H. Matsumura, Jpn. J. Appl. Phys., Part 1 37, 3175共1998兲.
2H. Matsumura, H. Umemoto, A. Izumi, and A. Masuda, Thin Solid Films
430, 7共2003兲.
3H. Matsumura, H. Umemoto, and A. Masuda, J. Non-Cryst. Solids 338–
340, 19共2004兲.
4A. M. Wrobel, S. Wickramanayaka, and Y. Hatanaka, J. Appl. Phys. 76, 558共1994兲.
5A. M. Wróbel, A. Walkiewicz-Pietrzykowska, Y. Hatanaka, S. Wickra-manayaka, and Y. Nakanishi, Chem. Mater. 13, 1884共2001兲.
6J. T. Herron, J. Phys. Chem. Ref. Data 28, 1453共1999兲.
7H. Umemoto, R. Ozeki, M. Ueda, and M. Oku, J. Chem. Phys. 117, 5654 共2002兲.
8H. Umemoto and M. Oku, Bull. Chem. Soc. Jpn. 76, 291共2003兲. 9K. P. Huber and G. Herzberg, Constants of Diatomic Molecules,
Molecu-lar Spectra and MolecuMolecu-lar Structure Vol. IV.共Van Nostrand Reinhold, New York, 1979兲.
10H. Umemoto, K. Ohara, D. Morita, Y. Nozaki, A. Masuda, and H. Mat-sumura, J. Appl. Phys. 91, 1650共2002兲.
11U. Meier, K. Kohse-Hoinghaus, L. Schafer, and C.-P. Klages, Appl. Opt.
29, 4993共1990兲.
12L. L. Connell, J. W. Fleming, H.-N. Chu, D. J. Vestyck, Jr., E. Jensen, and J. E. Butler, J. Appl. Phys. 78, 3622共1995兲.
13A. Rousseau, A. Granier, G. Gousset, and P. Laprince, J. Phys. D 27, 1412 共1994兲.
14A. D. Tserepi and T. A. Miller, J. Appl. Phys. 75, 7231共1994兲. 15A. Kubo, M. Kitajima, M. Yata, and H. Fukutani, Jpn. J. Appl. Phys., Part
1 39, 6101共2000兲.
16J. Jolly and J.-P. Booth, J. Appl. Phys. 97, 103305共2005兲. 17G. C. Light, J. Chem. Phys. 68, 2831共1978兲.
18G. P. Glass and B. K. Chaturvedi, J. Chem. Phys. 75, 2749共1981兲. 19M. Péalat, J-P. E. Taran, M. Bacal, and F. Hillion, J. Chem. Phys. 82, 4943
共1985兲.
20J. H. M. Bonnie, P. J. Eenshuistra, and H. J. Hopman, Phys. Rev. A 37, 1121共1988兲.
21G. C. Stutzin, A. T. Young, H. F. Döbele, A. S. Schlachter, K. N. Leung, and W. B. Kunkel, Rev. Sci. Instrum. 61, 619共1990兲.
22R. F. G. Meulenbroeks, R. A. H. Engeln, J. A. M. van der Mullen, and D. C. Schram, Phys. Rev. E 53, 5207共1996兲.
23T. Mosbach, H.-M. Katsch, and H. F. Döbele, Phys. Rev. Lett. 85, 3420 共2000兲.
24P. Vankan, D. C. Schram, and R. Engeln, J. Chem. Phys. 121, 9876 共2004兲.
TABLE IV. Vibrational distributions of H2共艌2兲 in plasma and hot filament excitation. VUV means vacuum ultraviolet. Excitation technique Detection technique Total pressure Vibrational temperature
over= 2 level Reference
plasma共90 V, 10 A兲 CARS 5.5 Pa 2390 K 19
plasma共125 V, 25 A兲 VUV absorption 1.1 Pa 4180 K 21 plasma共100 V, 0.5 A兲 LIF 1.5 Pa non-Boltzmann⬇11 000 K 23
plasma共60 A, 9 kW兲 LIF 13 kPaa 2200 K 24
plasma共1 eV兲 LIF 20 Pa 2600 K 25
hot filament共2500 K, 4 V, 15 A兲 H−monitoring 0.01 Pa non-Boltzmann⬇3000 K 27 hot filament共1770 K兲 H−monitoring 6.7 Pa 3900 K 29 aPressure at the plasma source.
25P. Vankan, D. C. Schram, and R. Engeln, Chem. Phys. Lett. 400, 196 共2004兲.
26V. A. Shakhatov, O. De Pascale, M. Capitelli, K. Hassouni, G. Lombardi, and A. Gicquel, Phys. Plasmas 12, 023504共2005兲.
27R. I Hall, I. Čadež, M. Landau, F. Pichou, and C. Schermann, Phys. Rev. Lett. 60, 337共1988兲.
28K.-H. Chen, M.-C. Chuang, C. M. Penney, and W. F. Banholzer, J. Appl. Phys. 71, 1485共1992兲.
29C. Schermann, F. Pichou, M. Landau, I. Čadež, and R. I Hall, J. Chem. Phys. 101, 8152共1994兲.
30H. Umemoto, T. Morimoto, M. Yamawaki, Y. Masuda, A. Masuda, and H. Matsumura, J. Non-Cryst. Solids 338–340, 65共2004兲.
31Y. Nozaki, K. Kongo, T. Miyazaki, M. Kitazoe, K. Horii, H. Umemoto, A. Masuda, and H. Matsumura, J. Appl. Phys. 88, 5437共2000兲.
32H. Umemoto, K. Ohara, D. Morita, T. Morimoto, M. Yamawaki, A. Ma-suda, and H. Matsumura, Jpn. J. Appl. Phys., Part 1 42, 5315共2003兲. 33W. M. Shaub, J. W. Nibler, and A. B. Harvey, J. Chem. Phys. 67, 1883
共1977兲.
34D. P. Gerrity and J. J. Valentini, J. Chem. Phys. 81, 1298共1984兲. 35T. Morimoto, H. Umemoto, K. Yoneyama, A. Masuda, H. Matsumura, K.
Ishibashi, H. Tawarayama, and H. Kawazoe, in Nano Electronic Materials, special issue of Jpn. J. Appl. Phys., Part 1 44, 732共2005兲.
36S. G. Ansari, H. Umemoto, T. Morimoto, K. Yoneyama, A. Izumi, A. Masuda, and H. Matsumura, Thin Solid Films共in press兲.
37B. K. Andrews, K. A. Burton, and R. B. Weisman, J. Chem. Phys. 96, 1111共1992兲.
38P. J. Eenshuistra, J. H. M. Bonnie, J. Los, and H. J. Hopman, Phys. Rev. Lett. 60, 341共1988兲.
39B. Jackson and M. Persson, J. Chem. Phys. 96, 2378共1992兲. 40S. K. Pogrebnya and D. C. Clary, Chem. Phys. Lett. 363, 523共2002兲. 41D. R. Flower and E. Roueff, J. Phys. B 31, 2935共1998兲.
42D. R. Flower and E. Roueff, J. Phys. B 31, L955共1998兲. 43O. Dobis and S. W. Benson, J. Phys. Chem. A 106, 4403共2002兲. 44D. L. Baulch et al., J. Phys. Chem. Ref. Data 21, 411共1992兲.