近畿大学学術情報リポジトリ
95
0
0
全文
(2) Fundamental Study on Highly-Filled Wood-Plastic Composite. Rashmi Kumari. March, 2008. Graduate School of Agriculture Kinki University Department of Advanced Bioscience (Major: Biomaterials) (Advisor: Prof. Okamoto Tadashi). Submitted to the Graduate School, Kinki University, to fulfill the requirements for the Doctorate Degree..
(3) ABBREVIATIONS WPC. Wood plastic composite. PLA. Poly (lactic acid). PLLA. Poly (L-Iactic acid). PP. Polypropylene. MAPP. Polypropylene modified with maleic anhydride. CL. E-caprolactone. BL. y-butyrolactone. HA. Hydroxypivalic acid. MALDI-TOF MS. Matrix assisted laser desorption/ionization time-of-flight mass spectrometry. GPC. Gel permeation chromatography. IHNMR. Proton nuclear magnetic resonance. M. Middle lamella. P. Primary wall. SI. Outer layer of secondary wall. S2. Middle layer of secondary wall. S3. Inner layer of the secondary wall. W. Warty layer. MOR. Modulus of rigidity. MOE. Modulus of elasticity. MA. Maleic anhydride. PCL. Polycaprolactone. PCL-g-AA. Acrylic acid grafted polycaprolactone.
(4) MFR. Melt flow rate. MFI. Melt flow index. Method A. Compression molding with an oil hydraulic press. MethodB. Compression molding with a hot press. AC. Cutter mill compound molded by method A. AH. Hammer mill compound molded by method A. BC. Cutter mill sample molded by method B. EL. Lengthwise extrusion molding composites. EW. Widthwise extrusion molding composites. IX. Injection molding composites without lubricant. 10. Injection molding composites with lubricant. P. Appliedload,kgf. L. Distance between support span, cm. B. Composite width, cm. h. Composite thickness, cm. Lly. Elongation or deflection of composite, cm. Wt. Weight gain. Th. Thickness swell. W). Weight of the composite containing water. Wo. Weight of the dried composite. t). Thickness of wet composite. to. Thickness of dry composite. SD. Standard deviation Glass transition temperature.
(5) DMTA. Dynamic mechanical thermal analysis. E'. Storage modulus. E". Loss modulus. CTE. Coefficient of thermal expansion. Tan 8. Dissipation factor or loss tangent, E '/E". ~L. Change in length (mm). ~T. Change in temperature (OC). Lo. Initial composite length (mm). b.p.. Boiling point. m.p.. Melting point. DSC. Differential scanning calorimetry Crystallization temperature Melting temperature. WF. Wood fiber. BF. Bamboo fiber.
(6) CONTENTS CHAPTER. 1. Introduction and Background. 1. 1.1. Wood Plastic Composite (WPC): Applications and. 1. Research issue. PART. 1.2. Wood Fiber: Structure and Composition. 3. 1.3. Wood/Plastic Composites Compatibility. 7. 1.4. Processing. 9. 1. EFFECT OF MATERIALS ON PROCESSIBILITY. 11. AND PERFORMANCE OF CELLULOSEI IPP/MAPP. CHAPTER. 2. Processing and Melt Flow Behavior of. 12. Cellulose/Polypropylene/MAPP Composites. CHAPTER. 2.1. Introduction. 12. 2.2. Experimental Method. 12. 2.3. Results and Discussion. 19. 2.4. Conclusions. 22. 3. Mechanical Properties and Water Absorption of. 23. Cellulose/Polypropylene/MAPP Composites. 3.1. Introduction. 23. 3.2. Experimental Method. 24.
(7) CHAPTER. 3.3. Results and Discussion. 25. 3.4. Conclusions. 32. 4. Density and Morphology of. 33. Cellulose/Polypropylene/MAPP Composites. CHAPTER. 4.1. Introduction. 33. 4.2. Experimental Method. 33. 4.3. Results and Discussion. 34. 4.4. Conclusions. 40. 5. Thermal Mechanical Analysis and Dynamic Thermal. 41. Mechanical Analysis of Cellulose/Polypropylene/MAPP Composites. PART. 5.1. Introduction. 41. 5.2. Experimental Method. 42. 5.3. Results and Discussion. 43. 5.4. Conclusions. 51. 2. STUDY OF COMPLETE BIOPLASTIC BY. 52. REPLACING PP WITH PLA CHAPTER. 6. Synthesis and Characterization of Modified Poly. 53. (L-Iactic acid). 6.1. Introduction. 53.
(8) CHAPTER. 6.2. Experimental Method. 54. 6.3. Results and Discussion. 56. 6.4. Conclusions. 64. 7. Effects of P(LA-co-CL) on the Physical Properties of. 66. Wood-Poly (L-Lactic acid) Composites. CHAPTER. 7.1. Introduction. 66. 7.2. Experimental Method. 66. 7.3. Results and Discussion. 69. 7.4. Conclusions. 74. 8. Conclusion and Summary. 75. 8.1. Summary. 75. 8.2. Effects of Fiber Length of Cellulose on Processibility and. 76. Performance of Cellulose/PPIMAPP Composites. 8.3. Effects of Fiber resin Content on Processibility and. 76. Performance of Cellulose/PPIMAPP Composites. 8.4. Comparison of Compression, Injection and Extrusion. 77. Molding. 8.5. Modification of Poly (L-lactic acid). 78. 8.6. P(LA-co-CL) Copolymer as a Compatibilizer. 78. 8.7. Comparison of Cellulose/PPIMAPP and Wood/PLLA. 79. Composites.
(9) ACKN"OWLEDGMENTS ...................................................................... 80 REFREN CES ....................................................................................• 81. PUBLICATIONS .......•..•..•..•.•.•.........•••.•.••••.••.••....•..............••..•.•.••.••... 86.
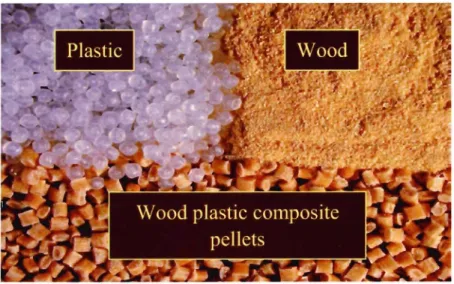
(10) CHAPTERl Introduction and Background. 1.1 Wood plastic composite (WPC): Applications and research issue. Interests in wood fiber-reinforced polymer composites, or bio-based composites, have grown tremendously because of their low material costs, light weight, high specific modulus (modulus over density), and environment friendly appeal [1]. To convert low-value wood resources into high-value products, researchers are combining wood fiber with thermoplastic resin, resulting in wood plastic composites. Thermoplastic resins, such as polypropylene, polyethylene, polystyrene, and polyvinyl chloride, soften when heated and harden when cooled. This property allows wood to be mixed with the plastic to form a composite product. Additives are also often used in WPCs. Additives are materials that are added in small amounts to enhance properties. For example, lubricants improve surface appearance and processing; coupling agents improve adhesion between the wood and plastic components. Other possible additives include colorants, light stabilizers, foaming agents, and thermoplastics. The resulting WPCs can be easily processed into various shapes by three common molding methods for WPCs are extrusion, injection, and compression molding. Several factors influence processing WPCs such as moisture can disrupt many thermoplastic processes, resulting in poor surface quality and voids. Mechanical and physical properties, such as strength, stiff-ness, impact resistance, density, and color, are important considerations in many WPCs applications. For example, automotive applications take advantage of a lower specific gravity, household products, such as paintbrush handles, scissor handles, and flowerpots, take advantage of the aesthetics, resulting in a product that can look like wood but can be processed like a plastic. Semi-structural building applications, such as decking, roof tiles, and window trim, also take advantage of the wood look and offer improved thermal and creep performance compared with unfilled plastics. WPCs are currently used in railing systems (deck boards, stairs, posts and post rails, handrails and. 1.
(11) bottom rails, post caps, balusters, and other small accessories)[2]. Construction, transportation, industrial, and consumer applications for wood plastic composites are all on the rise. WPC have been primarily produced with a low and medium percentage of wood/cellulose.. Products. typically. contain. approximately. 50%. (by. weight). wood/cellulose, although some composites contain very little wood/cellulose and others as much as 60% [3-7]. Wood/cellulose content may range from 70% to 90% and the interfacial adhesion between wood/cellulose particles and polymers can be improved by adding a compatibilizer. One ofthe major challenges for WPC is to optimize the content of the wood/cellulose in WPCs to reduce costs and compete with solid wood and engineered wood/cellulose composite products. However, extruded wood-plastic composites are a relatively new product whose market growth has been rapid. The engineering design of extrusion operations requires proper knowledge of the flow mechanism of these highly filled melts. The formulating of wood plastic formulations also requires reliable evaluation of flow performance of the composite melts. Rheological characterization affords knowledge about both the fundamental flow behavior of the highly filled plastics and practical methods for evaluating the flow performance for process development. The technical challenges are to overcome flow problems, the low bulk density of the wood as well as separation problems of the composite mixture. Therefore, advancing this area of knowledge for this new material class is important for further developments of the science and industry [4,8,9].. Recently, interest has been growing in developing biomass-based plastics to reduce greenhouse gas (C02) emissions and to conserve petroleum resources. Biomass-based plastics include microbial products such as polyhydroxybutylate, chemosynthesis products such as poly (lactic acid) (PLA), and chemically modified natural products such as esterified starch and cellulose acetate. Petroleum-based polymers (such as polypropylene, polyethylene etc.) of WPCs can be replaced by bio plastic and resulting matrix will create a complete bio based plastic. Poly (L-Iactic acid) (PLLA) shows a valuable alternative to petroleum-based polymers for uses as plastics, fibers, and. 2.
(12) coatings. Brittleness, water resistance and cost limit the applications of wood!PLLA composites.. This work is divided in two different parts. The first part reports the effects of materials on processibility and performance of cellulose micro fibers, random polypropylene (PP), and the coupling agent polypropylene modified with maleic anhydride (MAPP). Composites prepared with different fiber lengths (120, 300, and 900!J.m) of cellulose and with the different content (70, 80 and 90%) were studied. A study on the mechanical and water absorption of compression, extrusion, and injection molding composites is presented here. Melt flow characteristics such as melt index, have been studied with special reference to the effect of blend ratio, cellulose fiber length, temperature, and die diameter. The effect of the different fiber length and content of cellulose on the morphology and water absorption of the composites is discussed.. The second part consists of the study of WPC with an 80/20 wood fiber/poly (L-lactic acid) composition containing modified PLLA as a compatibilizer. For modification of PLLA, PLLA were copolymerized by E-caprolactone (CL), y-butyrolactone (BL), and hydroxypivalic acid (HA). The resulting copolymers were characterized by various analytical techniques including matrix assisted laser desorption/ionization time-of-flight mass spectrometry (MALDI-TOF MS), gel permeation chromatography (GPC), and proton nuclear magnetic resonance spectra eH NMR). To improve compatibility and mechanical. properties. of. wood!. PLLA. or. bamboo/PLLA,. poly. (lactic. acid-co-caprolactone) (P (LA-co-CL)) copolymer produced in this study.. 1.2 Wood fiber: Structure and composition. Wood is a heterogeneous, hygroscopic, cellular and anisotropic material. It is composed of fibers of cellulose (40%-50%) and hemicellulose (15%-25%) held together by lignin (15%-30%) [10]. Wood fibres, are a structural cell element of wood that are extracted. 3.
(13) from trees, straw, bamboo, and other sources. Wood fibre is primarily extracted from hardwood (dicotyledonous) trees and softwood (coniferous) trees. It is made commercially by chipping and grinding.. 1.2.1 Structure of wood The primary structural building block of wood is the fiber cell. The fiber cell wall is build up by several layers, namely (Figure 1.1) middle lamella (M), primary wall (P), outer layer of secondary wall (8 1) middle layer of secondary wall (8 2 ), inner layer of the secondary wall (83) and warty layer (W) [11].. Each layer is composed of a. combination of three chemical polymers: cellulose, hemicellulose, and lignin. The cellulose and hemicellulose are linear polysaccharides (i.e., hydrophilic multiple-sugars), and the lignin is an amorphous phenolic (i.e., a three dimensional hydrophobic adhesive). Cellulose forms long unbranched chains and hemicellulose forms short branched chains. Lignin encrusts and stiffens these polymers.. Inner Layer Secondary wall. Middle Layer Outer Layer Primary wall Wood fiber. Figure 1.1. The structure of wood fibers. 1.2.2 Cellulose Cellulose is a biopolymer that wood use as the primary building block for their cell walls and has economic significance because it is 40% to50% constituent of wood.. 4.
(14) Cellulose is a high-molecular-weight (10 6 or more) linear polymer of ~-(l ~ 4)-D-glucopyranose units in the 4C 1 conformation (Figure 1.2). The fully equatorial conformation of. ~-linked. glucopyranose residues stabilizes the chair structure,. minimizing flexibility. Glucose anhydride, which is formed via the removal of water from glucose, is polymerized into long cellulose chains that contain 5000-10000 glucose units. The basic repeating unit of the cellulose polymer consists of two glucose anhydride unjts, called a cellobiose unit [12]. The intermolecular bonds and intramolecular hydrogen bonds determine the internal structure and control the mechanical properties of cellulose as well as the behavior of cellulosic materials as a result of a moisture change. When moisture is brought into contact with cellulose, water molecules diffuse into non-crystalline domains, swell the structure and form new hydrogen bonds. Furthermore, they may create water bridges instead of the hydrogen bonds present in dry cellulose. Intermolecular bonds are most easily affected in this way.. In contrast, the crystalline regions in cellulose are almost inaccessible to moisture [13].. Figure 1.2. Structure of cellulose 1.2.3 HemiceUuloses. In general, the hemjcellulose. (2~0%). fraction of woods consists of a collection of. polysaccharide polymers with a lower DP than cellulose (average DP of 100-200) and containing mainly the sugars D-xylopyranose, D-glucopyranose, D-galactopyranose, L-arabinofuranose,. D-mannopyranose,. D-glucopyranosyluronic. acid,. and. D-galactopyranosyluronic acid with minor amounts of other sugars. Hemicelluloses usually consist of more than one type of sugar unit and are sometimes referred to by the. 5.
(15) sugars they contain,. for example, galactoglucomanan,. arabinoglucuronoxylan,. arabinogalactan, glucuronoxylan, glucomannan, etc. [14]. Hardwood hemicelluloses contain mostly xylans, whereas softwood hemicelluloses contain mostly glucomannans [15]. The galactoglucomannan is the principal hemicellulose (approximately 20%), with a linear or possibly slightly branched chain with. ~-(1 ~4). linkages. A representative. structural formula for softwood galactoglucomannan is represented in Figure 1.3.. O~H OHO HO OH __ ZH. ~1-.o.o. o:.-Dilalactop~r.moS'!.l. -. ~ (HQ_ooo. OH. residue. <~tooo.o. _________. O~o~o~-=-oL::.J;:l~~o~·~~O- 9~·d!~e:.r-r. r. HO. U. OH. 1. --(. ---;;J ~O. 0. OH. Figure 1.3. Structure of softwood galactoglucomannan 1.2.4 Lignin. Lignin is a necessary constituent in the cell walls of all vascular plants. It is one of the most abundant biopolymers, and a considerable part of the carbon fixed by photosynthesis is consumed by lignin biosynthesis. The biological functions of the polymer are as follows: (1) they give stiffness and strength to the secondary wall of vascular plants. The lignified cell wall can be seen as a composite, with cellulose microfibrils giving stiffness to the material. (2) They make the cell wall hydrophobic. This allows the development of tissues for efficient water transport in vascular plants. (3)They are an obstacle to microbial attack. The presence of lignin makes woody tissues compact that molecule as large as proteins cannot penetrate the tissue. Thus, wood is much more resistant to microbial attack than are non-lignified cellulosic materials, such as cotton, and many wood. Lignin is polymerized in the wood from the monolignols sina-pyl, coniferyl, and p-coumaryl alcohol. Hardwood lignin (in dicotyledons) originates mainly from sinapyl alcohol and coniferyl alcohol, whereas softwood lignin (in coniferous trees and gingko) is made mainly from coniferyl alcohol. As a. 6.
(16) biomacromolecule, lignin. IS. unusual. In. having a complex network-type structure. (Figure. 1.4) [16].. CH:zOH I. ,. HC-OHCOH. o. H:zC/ 'CH. HO. -0. ~7H OCH). I. ~~ -'-0-/- b:l. ~HCOHI 10. I. HOHlC,. I. 8. At!'. Cli30. HC. OCHs 0. 0. I. ~~~QH HC---O I. ~0-6oc~ OH. Lignin. OH[O- C). Figure 1.4. Structure of Lignin 1.3 Wood/plastic composites compatibility. 1.3.1 Cellulose/polypropylene compatibility and interaction. The combination of synthetic thennoplastic polymers and wood is nonnally problematic because wood is a hydrophilic, porous, hygroscopic and polar material and synthetic thennoplastics are hydrophobic. The major issue in achieving true reinforcement is the inherent incompatibility between the hydrophilic fibers and the hydrophobic polymers, which results in poor adhesion and, therefore,. in poor ability to transfer stress from the. matrix to the reinforcing fibers. A number of investigators have explored the ability of. 7.
(17) additives to enhance the adhesion and thereby improve the properties such as tensile and flexural strength of these composite materials, the techniques adopted include plasma treatment, graft copolymerization, silane treatment and treatments with other chemicals. MAPP is a widely used coupling agent within polypropylene based composites. The addition of MAPP shows a marked increase in the modulus of rupture (MaR) and modulus of elasticity (MOE) of polypropylene based composites, indicating some form of interaction between the matrix and the MAPP. MAPP exists in two forms, an anhydride and a di-carboxylic acid form. Heinen et al. determined the most probable structure of MAPP (Figure 1.5) using smaller model compounds studied in solution with 13C NMR spectroscopy (Heinen, 1999). This structure contains the anhydride form of MA grafted on the PP backbone. The current hypothesis states that maleic anhydride (MA) functional groups are capable of chemically bonding with wood, via ester bonds or secondary interactions such as hydrogen-bond (Figure 1.5) [17, 18, 30, 31]. The chemical interactions between MAPP and cellulose suggest esterification as the main interaction with a possibility of hydrogen bonding (Figure 1.5). Avella et al. proposed that MA groups migrate towards the fiber surface due to the polar/non-polar interactions, thus increasing the probability of bonding between the MA and the hydroxyl groups on the wood fibers/cellulose [19].. 0. II H2. OH. + OH. 0"'". /. c-cI. 'C-C-C. ~. H. ~. Cellulose fiber. PP chain. H2. O-c-t-c ~. H. ~. I. o " H2. o~. --c-?. ,. Figure 1.5. Esterification of cellulose. I. o-c-c-c I. II. H 0 Cellulose fiber. 8. I. Cellulose fiber PP chain. ~. I. ~. O-C-C. H. I. ; PP chain.
(18) 1.3.2 Wood/poly (lactic acid) composites compatibility. The formulation of biodegradable composites is gaining interest because of decreasing fossil resources and environmental regulations. In this way, "green bio-composites" or "eco-composites" ,. obtained. by. compounding. wood. fiber. with. renewable. resource-based poly(lactic acid) polymers, open the way to the next generation of sustainable, environmentally friendly, eco-efficient materials, products, and processes. In spite of its relative weakness and about 60°C melting point that is too low for many applications, polycaprolactone (PCL) has recently received much attention due to its flexibility and biodegradability. Chin-San Wu et al. investigated systematically the properties of PCL/wood flour and acrylic acid grafted PCL (PCL-g-AA)/wood flour blends and found that due to the generation of ester carbonyl functional group from reaction between -OH group of WF and -COOH group of PCL-g-AA copolymer [20]. Lee et al. reported that interfacial properties between bamboo fiber and PLA were improved after the addition of bamboo fiber-esterified maleic anhydride [21].. 1.4 Processing. Typical blending of wood with a thermoplastic involves the plastic-filler reinforcement to be shear mixed at temperatures above the softening point of the plastics. The heated mixture is then typically extruded into "small rods" that are then cut into short lengths to produce a conventional pellet (Figure 1.6). The pellets can then be used in typical injection, extrusion or compression molding processes. Processing the wood without loss of fiber properties is a major issue. The processing temperatures used in the plastic industry are usually above the decomposition temperature of the materials. Temperatures, above 180°C, result in decomposition of wood so processmg temperatures lower that 180°C, are needed if a wood material is used as a filer. Thermoplastics with a high melt flow index and low softening temperatures are usually used [22].. 9.
(19) Wood plastic composite pel lets. Figure 1.6. Pellets after processing of wood plastic composites. 10.
(20) PART!. EFFECT OF MATERIALS ON PROCESSIBILITY AND PERFORMANCE OF CELLULOSE/PP/MAPP. 11.
(21) CHAPTER 2 Processing and Melt Flow Behavior of Cellulose/PolypropylenelMAPP Composites 2.1 Introduction. This chapter presents standard procedures for processmg and flow behavior for. cellulose/PP/MAPP composites. The first step in producing a WPC is to determine raw materials, and its amounts, which will produce a WPC that meets the processing and performance requirements. Manufacturing melt-blended composites is usually a two-step process consisting of compounding and molding. In the compounding step, wood/cellulose fiber and additives are combined with molten thermoplastic to produce a homogeneous composite material. Generally, melt mixing techniques applied to WPC are twin screw extruder, two-roll mill, turbine mixer, ball mill etc. Three common molding methods for WPCs are extrusion molding, injection molding, and compression molding. Melt flow studies of compounds are very important for optimiZing the processing conditions and to design processing equipments like injection molding machines, extruders, and dies required for various products. During the processing, the blend may undergo various changes. Better knowledge of the processing defects will help to introduce the suitable remedies to optimize the processing problems [23].. 2.2 Experimental Method. 2.2.1 Materials. The materials used in the study of this part were cellulose, a thermoplastic polymer, polypropylene (PP), and a coupling agent MAPP, which is polypropylene modified with maleic anhydride. The thermoplastic polymer was a random PP (PM930V, MFR 30 gllO min, density 0.9 g/cm 3 ) supplied by SunAllomer (Tokyo, Japan). Three different length of fibrous cellulose (BEOO, BC200, B400) were products of Rettenmaier and. 12.
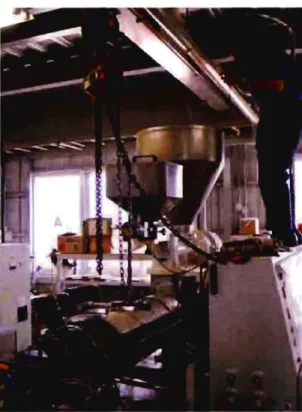
(22) Sohne (Rosenberg, Germany), produced from softwood. The basic properties of all the cellulose powders are listed in Table 2.1. The coupling agent was MAPP (umexlOlO) obtained from Sanyo Kasei (Tokyo, Japan).. Table 2.1. Basic properties of all cellulose powers BEOO. BC200. B400. White. White. White. Short fiber. Medium fiber. Long fiber. Fiber Length (/-lm). 120. 300. 900. Fiber diameter (/-lm). 20. 20. 20. 150-1S0. 60-S0. 20-40. Color Structure. Bulk density (gil). 2.2.2 Blending procedure The cellulose fibers, PP and MAPP were sequentially fed into a conical twin-screw extruder (Model Taitan 80, Cincinnati Co.). The temperature profile of the extruder from cylinder I through cylinder 4 was kept between 230°C and 180°C and the extruder was operated at screw speed 7rpm. After the compounding, the composite was then crushed with a cutter mill (wood grinder) or a hammer mill and used for compression molding. Extruded strands were also palletized. Pellets were used for extrusion molding and injection molding composites. Crushed pellets used for injection samples were also prepared with the addition of 2 wt% calcium stearate as a lubricant. The compositions of cellulose powder, PP and MAPP were listed in Table 2.2.. 2.2.3 Melt flow index Melt flow index (MFI), that is, the weight of polymer in grams extruded in 10 min through a capillary, was determined using Dynisco Melt flow indexer LMI 4000 (Figure 2.1) series as Japan Industrial Standards (nS) K 7210. The applied loads and die. 13.
(23) diameters were 5 and 10 kg, and 6 and 7 mm, respectively. The measurement was carried out at 230 D e.. Table 2.2. Composition of cellulose powder, PP and MAPP Composition (wt%). No.. PP. MAPP. PM930V. UMEXIOIO. 18. 2. Cellulose BEOO 1. BC200. B400. 80. 2. 70. 28. 2. 3. 80. 18. 2. 4. 90. 8. 2. 18. 2. 5. 80. Load. Capillary. Discharge. Figure 2.1. Melt flow indexer. 14.
(24) 2.2.4 Compression molding The specimens for mechanical tests were prepared by compression molding with an oil hydraulic press HP-l B-P (Method A) at 200°C. Other press conditions were set to bring close to the average of theoretical densities of components, plastic (TD=0.89-0.92) and wood (TD= 1.S). The average theoretical density of a wood/cellulose plastic composite made with ratio 80120 is 1.38. The theoretical density was calculated on the basis of weight percent and the density of components. Specimens for analysis were cut from the sheets of the cutter mill compound molded by method A (AC) and the hammer mill compound molded by method A (AH). The blends were also compression molded using a steel mold (dimensions: 0.2S x8 x lOcm) by a Shinto hot press Model HCC-BSN-2 (Figure 2.2) (Method B) at temperature 220°C, under the pressure of 11 MPa for Smin and cooled to room temperature. Teflon films were used to avoid the adhesion of MAPP to the stainless surface of the mold. Three standard specimens (dimensions:. 0.2S x2.Sx 10cm) were cut from the sheet of the cutter mill sample molded by method B (BC) as shown in Figure 2.3.. Figure 2.2. Shinto hot press Model HCC-BSN-2. 15.
(25) 10cm. ... 2.5cm. .. Figure 2.3. Three standard cutting specimens (Dimensions: O.25x2.5x lOcm) from the sheet of the cutter mill sample molded by method B. 2.2.5 Extrusion molding Pellets were extruded as thick long sheets in this process. Pellets were fed into a conical twin-screw extruder model Titan 68 (Figure 2.4, Taiyo Gosei, Kagawa, Japan). The molding conditions were as follows: temperatures on cylinder 1 to cylinder 4 were held between 215°C and 170°C and the temperature for heating zone to cooling zone of exit die was to be 175°C to 45°C. The extruder was operated at screw speed 5 rpm. The resulting sheets were cut lengthwise (EL) (dimensions: O.92x2.5 x I0.8cm) and widthwise (EW) (dimensions: O.9x1.9 x ll.9cm) to make the test specimens as shown in Figure 2.5.. 16.
(26) Figure 2.4. Conical twin-screw extruder model Titan 68. Figure 2.5. Standard cutting specImens of of extrusion molding composites. EL, Lengthwise (Dimensions : 0.92 x 2.5 x 10.8cm); EW, Widthwise (Dimensions: 0.9 x 1.9 x 11.9cm). 2.2.6 Injection molding The injection molder used was a Roboshot a-lODe (Fanuc). The molding conditions were listed in Table 2.3. The resulting dumbbell-shaped mold without lubricant (IX). 17.
(27) and mold with lubricant (10) were molded as shown in Figure 2.6. A regular injection nozzle was used, with a nozzle diameter of 2 mm. The dumbbell-shaped molds were cut into rectangular shape (Dimensions: O.4x 1x8cm) to make the test specimens for mechanical test.. Figure 2.6. Dumbbell-shaped molds from injection molding method. Table 2.3. Molding conditions of injection mold Lubricant. Injection. Nozzle Temp. Peak Pressure. (wt%). Time (sec). (OC). (MPa). IX. 0. 0.29. 210. 29.6. 10. 2. 0.30. 195. 29.4. IX. 0. 0.57. 185. 22.7. 10. 2. 0.60. 185. 23.9. IX. 0. 0.29. 210. 29.5. 10. 2. 0.31. 195. 29.5. No.a 1. 2. 3. IX, Injection mold without lubricant; 10, Injection mold with lubricant; a No. of composition. same as in Table 2.2.. 18.
(28) 2.3 Results and discussion. 2.3.1 Melt flow index. Flow behavior of compound is one of the most important factors to be considered when establishing injection molding and extrusion molding [4, 8]. Figures 2.5 and 2.6 show the experimental results obtained for the melt flow index of pellets measured at 230 D C. The melt flow rate provides valuable information about the flow behavior of materials. It is found that the MFI value decreases with an increase of cellulose content because. the incorporation of rigid weight of cellulose to the polymeric matrixes limits their free mobility, increasing the material apparent viscosity. Formulations with 90% cellulose loading did not flow and MFI values were unable to be measured.. Caraschi and Ldio. et al. [24] obtained similar results in which the increase of fiber amount decreased the MFI value. As for the effect of cellulose size, pellets containing cellulose showed lower values than pellets containing. 120~m. 300~m. fiber length. cellulose. For each pellet,. an increase in die diameter increased the melt flow, especially with lO-kg load. With 5-kg load, the 80% cellulose content compound could not be measured with 6-mm diameter. However, it could be measured with 7-mm die. With lO-kg load, compound with 80% cellulose content could be measured with both die of 6-and 7-mm diameter. The compound with 70% (w/w) Gellulose content had remarkably low fluidity relative to a general plastic material. Therefore, it was concluded that desirable conditions for measurement were 5-kg load/7-mm die and 10-kg load/6-mm die. A good extrusion-molded and injection-molded composite could be obtained at this temperature 230 D C. However, degradation of cellulose fibers starts at 180 D C [25].. 19.
(29) ---. C E. 0 ...... :§. .sns. . ~ 0. -. co::. Qi. ~. 80 70 60 50 40 30 20 10 0. _70%1 10 80%. 5kg. 10kg. Diameter of die (mm) and applied load (kg). Figure 2.5. Melt flow index of 300J,lm fiber length cellulose pellets against fiber weight percent. Filled bars, CelluloseIPP/MAPP=70/28 /2; open bars, CelluloselPPIMAPP=801l8/2. 60 C 50 E 0 ~ 40 ~. _ 120f.lll1. .sns. .. 30. ~ 0. -. 20. Qi. 10. co::. o 300 f.lll1. ~. 0 5kg. 10kg. Diameter of die (mm) and applied load (kg). Figure 2.6. Melt flow index of pellets with different fiber lengths of 80 wt% cellulose and 20wt% plastic content. Filled bars, Cellulose fiber length=I 20llm; open bars, Cellulose fiber length=300llm. 20.
(30) 2.3.2 Feasibility of compression, injection, and extrusion molding Table 2.4 illustrates the feasibility of compression, injection, and extrusion molding. It is noted that the feasibility is highly dependent on both the fiber content and length of fiber as shown in previous section (2.3.1). It has been shown that the feasibility of extrusion molded composites depend significantly with high resin content but not as much by the fiber length. On other hand it has been also found that composites were moldable by injection molding only when both high cellulose fiber content and smaller fiber length were met. As compression molded composites are feasible in all cases it reveals that compression molding is more compatible.. Table 2.4. Feasibility of compression, injection and extrusion molding of comnositions of cellulose fiber/PPIMAPP No.a. Molding Process Compression. 10,. Extrusion. Injection. 10. IX. 0. 0. 0. 0. X. 0. 0. 0. 0. 0. 0. 0. 4. 0. 0. X. X. X. 5. 0. 0. X. X. X. Hammer. Cutter. 1. 0. 0. 2. 0. 3. Injection mold with lubricant; IX, Injection mold without lubricant; 0, indicates molding. feasible; x, indicates molding not feasible;. a. No. of composition same as in Table 2.2.. 21.
(31) 2.4 Conclusions. Composites of MAPP, cellulose and polypropylene were produced by compounding in a conical twin-screw extruder. Processibility with high resin content and small fiber length is difficult than its counterparts at low resin loadings and large fiber length. Unfortunately, feasibility studies on extrusion molding and injection molding of the highly loaded wood/cellulose plastics are scarce in the open literature. Two extrusion-molded composites and three injection-molded composites have been developed. The cellulose content dependency of flowability is similar to the prediction, indicating that the deforming capacity of cellulose facilitates the denser packing of the filler particles. The melt flow rate of the composite filled with 90 wt% of cellulose and composite of fiber length 900llm does not show any flowability. These features are not unique for the cellulose fiber and provide a rheological basis for achieving better processibility with low cellulose content and small fiber length than its counterparts at high cellulose loadings and large fiber length.. 22.
(32) CHAPTER 3. Mechanical Properties and Water Absorption of Cellulose/PolypropylenelMAPP Composites 3.1 Introduction. A study on the mechanical and water absorption properties of compression, extrusion and injection molded composites will be presented here. Reviews of WPCs have shown that they have good potential to improve the water resistance of woody composites, because thermoplastic polymers are highly hydrophobic [6, 43]. Some researchers believe that if the interaction can be improved, the composites could be given better mechanical properties and better particle dispersion [44]. It is known that the mechanical and physical properties of WPC products are affected by a number of factors, such as the volume fraction and aspect ratio of fiber, dispersion level, fiber orientation, fiber-polymer adhesion, which are dependent on the mixing time and processing temperature. The most important factor on the mechanical properties of the composites is the fiber-matrix adhesion. The incompatibility between polar cellulose fibers and hydrophobic polymers results in inferior mechanical properties due to poor interfacial bonds. Current concepts of the methods applied to improve the fiber-matrix interfacial adhesion include molecular chain entanglements, good mechanical contact, the matching of surface tensions, and the formation of chemical and physical bonds through the use of chemical coupling agents [26]. The one most common method used to determine the mechanical properties of WPCs is the three-point bending test. At present, the three-point bending test is the only test method for determining modulus of rupture (MaR) and modulus of elasticity (MOE) of composites. In three-point bending test, the MOR and MOE are determined with the use of following equations, respectively MaR =. 3PL --2. 2bh. (kgf/cm2). 23.
(33) MOE =. LJ PL 3 4LJ ybh. (kgf/cm2) 3. Where: P=Applied load, kgf L=Distance between support span, cm b=Composite width, cm h=Composite thickness, cm Liy= elongation or deflection of composite, cm. 3.2 Experimental Method. 3.2.1 Mechanical test The small rectangular specimens were tested on a Shinto Model TCM-500 and the load-deformation curve was determined. The support span depended on the length of the mold and the crosshead speed was 5.0 mmlmin. At least 12 specimens were tested for each composite in accordance with JIS A5908. All specimens showed a yielding fracture mode. The modulus of rupture (MOR) and modulus of elasticity (MOE) were calculated from the load-deformation curve. The MOR was defined as the first point on the load- deformation curve to show a slope of zero. The MOE was determined from the slope in the initial elastic region of the load-deformation curve.. 3.2.2 Water absorption test The samples based on increasing fiber length of cellulose and cellulose content of compression molding were tested for water absorption for from 0 to 24 hour under atmospheric pressure at room temperature. Water absorption in weight gain (Wt), and thickness swell (Th) was calculated by the equation (1) and equation (2), respectively:. 24.
(34) Wt = (W 1- W o)/ W Th =. (1). 0. (t 1- to)/ to. (2). Where, WI, W o, t], and to are the weight of the composite containing water, weight of dry composite, thickness of wet composite and thickness of dry composite, respectively.. 3.3 Results and Discussion. 3.3.1 Mechanical test. Compression molding Method A: The effects of PP content on modulus of rupture (MOR) and modulus of elasticity (MOE) of the cellulose IPP/MAPP composites are shown in Figures 3.1 and 3.2, respectively. The compound crushed by a hammer mill (AH) tends to decrease the MOR with the increase of resin content from 20 to 30 wt%. If the extent of phase separation has been very severe, the strength of the materials will decrease [44]. The MOR of cutter mill composite (AC) simultaneously increased with an increase in PP content, suggesting that a relatively strong interaction exists between cellulose and PP [44]. The cutter mill compound contains fibers of a high average aspect ratio, and so they orient easily under conditions of high fluidity. Since the press pressure of method A is high, it is easy for a cutter mill compound to orient under high fluidity press conditions of 70 wt% cellulose content. The bending strength and the elastic modulus were high as expected. Since a compound of 80 wt% cellulose content had low fluidity, the resulting composite did not differ much from the composite of hammer mill compound. By the way, MOE of the composite AC was decreased as increases fiber length of cellulose. Method B: There is a tendency of the bending strength and the elastic modulus decreasing with the resin content. However, the tendency is not remarkable like the composite AH.. 25.
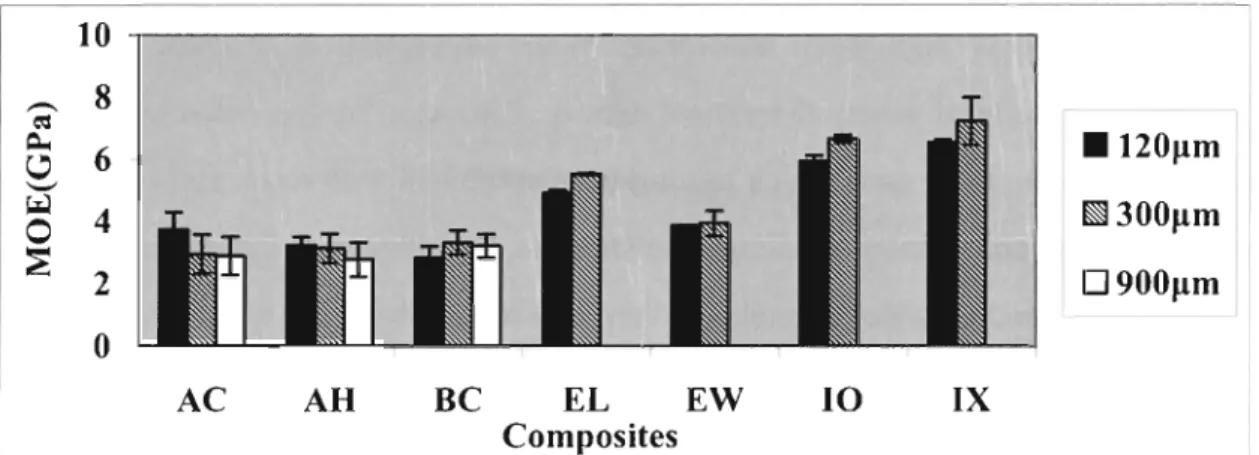
(35) 100 ~-------------------------------------,. -c= 80 ~. ~. .70%. 60. ~80%. '-". ~. 40. ~. 20. o. 090%. o AC. AH. BC. EL. EW. 10. IX. Composites. Figure 3.1. Effects of fiber content on MOR of composites with 300~m cellulose; Error bars represent standard deviation. Filled bars, CelluioseIPPIMAPP=70/28/2; shaded bars , Celluiose/PPIMAPP=80118/2; open bars, CeiiuioselPP/MAPP=90/8/2. 9. -o ~. '-". ~----------------------------------------~. 8 7. .70%. 6 5. ~80%. ~ 4. ~ 3. 090%. 2 1. o AC. AH. BC. EL. EW. 10. IX. Composites. Figure 3.2. Effects of fiber content on MOE of composites with 300~m cellulose; Error bars represent standard deviation. Filled bars, CelluioseIPPIMAPP=70/28/2; shaded bars, Cel\uiose/PPIMAPP=80/ i8/2; open bars,. Cell u loselPPIMAPP=90/8/2. Effect offiber length of cellulose In Figures 3.3 and 3.4, the enhancing effect of the fiber length of cellulose in the mechanical properties is clearly shown. The progressive increases in MOR of the composites AH, EW, EL, 10, and IX, as the fiber length of cellulose was increased. While, 300 and 900 11m fiber length mold have not much effect on MOE . In contrast, MOE of the composite. Be increased as increases the fiber length.. 26. However, mechanical.
(36) properties of 90p)lm fiber length composite showed high standard deviation (SD). Since a fiber is long, resin did not disperse uniformly. It is also suggesting that there is lack of a certain degree of miscibility between long cellulose and PPIMAPP.. 80 ,---------------------------------------, 70 __ 60. .120fl m. ~. ~. 50. ~300flm. 640 ~ o 30 ~ 20. 0900flm. 10. o AC. AH. BC. EL EW Composites. 10. IX. Figure 3.3. Effects of fiber length on MOR of composites with 80 wt% fiber content and 20 wt% plastic content; Error bars represent standard deviation. Filled bars, Filled bars, Cellulose fiber length= 120Ilm; shaded bars, Cellulose fiber length=300llm; open bars, Cellulose fiber length=900llm. 10 ,----------------------------------------, • 120flm (!m 300flm. 0900flm. 2. o AC. AH. BC. EL EW Composites. 10. IX. Figure 3.4. Effects of fiber length on MOE of composites with 80 wt% fiber content and 20 wt% plastic content; Error bars represent standard deviation. Filled bars, Filled bars, Cellulose fiber length=120llm; shaded bars, Cellulose fiber lengtb=300llm; open bars, Cellulose fiber lengtb=900llm. 27.
(37) Effect of method A, method B, injection and extrusion molding Widthwise extrusion composite (EW) had a lower MaR and MOE than that of lengthwise extrusion composite (EL). Injection mold without lubricant (IX) had a higher MaR and MOE than that of injection mold with lubricant (IO). Composite BC had lower MaR and MOE than that of composite AH and composite AC because of low density of AC and AH composites. The volume of BC was high with plenty of voids, and as the result, bonding of resin and fibers decreased. However, the injection mold without lubricant of 80 wt% PP gave the highest MOR and MOE.. 3.3.2 Water absorption. Effect offiber content Method A: As shown in Figures 3.5 and 3.6, water absorption increases as the resin content decreases. It is expected that water absorption takes place at the first approximation permeating a void portion and secondly as the binding water of cellulose. Therefore, the molded composite having a density much different from theoretical density may show high water absorption. Water absorption is accepted also in the molded composite of nearly theoretical density. This may be explained by that water permeates through the part, which has not been combined with resin, stays as cellulose binding water and induces swelling of composite. In addition to the expansion due to the cellulose binding water a tangle of fiber is destroyed with the water that permeated into the composite. Therefore, expansion of the molded composite is large with composites of more water absorption. The thickness swelling increases as the resin content decreases. Method B: Water absorption increases as the resin content decreases. This composite is porous and contains many void spaces. Since the composite contains many voids, much water is absorbed. Ratio of water absorption to the theoretical void (measured density/theoretical density) showed a parallel tendency. Since the composite did not absorb water completely in the experimental conditions of keeping in water for 24 hours,. 28.
(38) it is expected to be similar with a method A molded composite in that water has permeated between fibers, and so on as above. The thickness swell increases as the decrease of resin content. The factor controlling thickness swelling is the same as a method A molded composite. Therefore, a composite with much water absorption shows high expansion, and so on.. 25 .- 20 ~. '-'. =. .70%. .; 15. ....OIl. ~. tm80% 10 090%. ~. ~. 5. o AC. AH. BC E Composites. 10. IX. Figure 3.5. Effects of fiber content on weight gain of composites with 300Jlm cellulose. Error bars represent standard deviation; Filled bars, CelluioseIPP/MAPP=70/28/2; shaded bars, CelluioseIPPIMAPP=80118/2; open bars, Cellu ioselPP IMAPP=90/8/2. ~ 20 .---------------------------------------~. =>. '-'. 1.. =a:l 15 ~. 70 %. '" 10 '". tm80%. ~. 090%. '". ,; Col. :E ~. 5. 0 AC. AH. BC. E. 10. IX. Composites. Figure 3.6. Effects of fiber content on thickness swell of composites with 300Jlm cellulose. Error bars represent standard deviation. Filled bars, CelluioseIPPIMAPP=70/28/2; shaded bars, CelluioseIPPIMAPP=80118/2; open bars, Celluiose/PPIMAPP=90/8/2. 29.
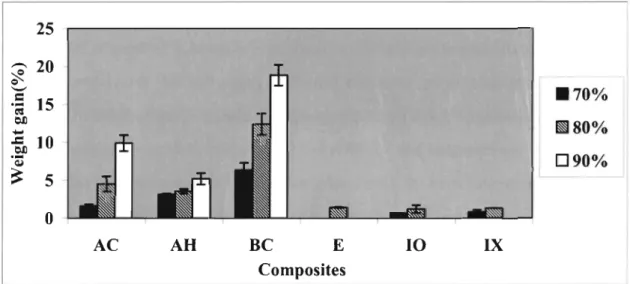
(39) Effect offiber length of cellulose Figure 3.7 implies the trend in weight gain of increasing fiber length of cellulose, while Figure 3.8 represents the thickness swell of the increasing fiber length of cellulose. Composite of 120 J..lm of fiber length has the low swell per I wt% of water absorption. Since fiber length is short, tangles between fibers have less developed. Water absorption is near to theoretical ratio of void, but since water absorption for 24 hours in water has not reached to the saturation level throughout the composite, it is thought, like a method A molded composite in the state that water has permeated into the clearance between fibers. It is also observed that water absorption increased with an increase in fiber length. Therefore, as the entangled part of fibers increases, which induces more clearance in the composite, a bonded part of fibers with resin may decrease. A method A molded composite has little void. Therefore, it is expected that water has permeated and is absorbed by the fiber that has not been bonded with resin. in this case, this part may increase with longer fiber , and consequently, water absorption is high . The thickness swell increases as the fiber length become long. A tangle of a fiber may have been destroyed with the permeated water, water binding to cellulose may increase and composite expands. Therefore, a longer fiber with many tangles between fibers may show high expansion.. 15 ,--------------------------------------,. ---~. • 12 011m ~ 300llm o 900llm. '-'. .5 10. eo:. b1l. ..c. .~. 5. ~. o AC. AH. BC. E. 10. IX. Composites. Figure 3.7. Effects of fiber length on weight gain of composites with 80 wt% fiber content and 20 wt% plastic content. Filled bars, Filled bars, Cellulose fiber length= 120/lill; shaded bars, Cellulose fiber length=300/lm; open. bars, Cellulose fiber length=900/lill. 30.
(40) 14 -.. 12. 0~. - 108. • 120llm. '" '"'". 6. ..::c CJ. D900llm. 4. ::::' ~. ~. ~. =. :.cE-c. ~3 0 01lm. 2. 0 AC. AH. BC. E. 10. IX. Composites. Figure 3.8. Effects of fiber length on thickness gain of composites with 80 wt% fiber content and 20 wt% plastic content. Filled bars, Filled bars, Cellulose fiber length= 120llm; shaded bars, Cellulose fiber length=300llm; open bars, Cellulose fiber length=900llm. Effect of method A, method B, injection and extrusion molding A method A molded composite has little water absorption and expansion compared with a method B molded composite. The difference is explained on the basis of density difference and void ratio of chapter 4. For the composites of 70 wt% cellulose content, thickness swelling per 1 wt% of water absorption is larger with method A composite than method B composite. Since the composite of 70 wt% cellulose content is abundant in fiber, there are few fibers that are not covered with resin. Therefore, when there are many voids inside of the composite, cellulose/PP/MAPP composite of high density tends to expand more by water absorption. Injection molded samples show the least water absorption. The values obtained for water absorption in injection molded composite with lubricant and without lubricant lies near by. Although micrographs do not show a clear difference at preset, more coverage of fiber by resin will be expected for injection molded composites.. 31.
(41) 3.4 Conclusions The mechanical and physical properties of composites vary considerably depending on the plastic content, shape and size of cellulose fiber and molding methods . The mechanical properties of composites are influenced mainly by the adhesion between the matrix and tangle of fibers . The results for the mechanical properties also supported the existence of a certain degree of the effect of miscibility in the composite plastics. Because of loosely arranged fiber of composites, 900 !lm fiber length and 90 wt% plastic content composites had the highest absorption of water resistance among the composites. The trend of water resistance and mechanical properties is injection mold >extrusion mold>compression mold by method A>compression mold by method B. We concluded that injection and extrusion molded composites, of cellulose in PP with MAPP, gave the best mechanical properties and physical properties.. 32.
(42) 3.4 Conclusions The mechanical and physical properties of composites vary considerably depending on the plastic content, shape and size of cellulose fiber and molding methods. The mechanical properties of composites are influenced mainly by the adhesion between the matrix and tangle of fibers. The results for the mechanical properties also supported the existence of a certain degree of the effect of miscibility in the composite plastics. Because of loosely arranged fiber of composites, 900 /-lm fiber length and 90 wt% plastic content composites had the highest absorption of water resistance among the composites. The trend of water resistance and mechanical properties is injection mold >extrusion mold>compression mold by method A>compression mold by method B. We concluded that injection and extrusion molded composites, of cellulose in PP with MAPP, gave the best mechanical properties and physical properties.. 32.
(43) CHAPTER4. Density and Morphology of Cellulose/PolypropylenelMAPP Composites 4.1 Introduction. The increased interest m the use of wood as filler and/or reinforcement in thermoplastics is also due to low density [27]. Reducing the weight of wood plastic composites is another challenge for these materials. The density of wood plastic composites is almost twice that of solid lumber [28]. The main drawbacks are the difficulties of achieving good dispersion and strong interfacial adhesion between the hydrophilic wood and the hydrophobic polymers which leads to composites with rather poor durability and mechanical properties [27]. Therefore density and morphological properties were studied in this chapter.. 4.2 Experimental method. 4.2.1Composite density. Composite density of the samples was determined usmg composites molded by compression, injection and extrusion molding. The composite density was calculated according to the following equation as the average of twelve specimens:. Density of composite =Weight of composite/ (LengthxWidthxThickness). 4.2.2 Morphology of composites. Microscope images of cellulose fibers of fiber length 120, 300 and 900 !lm and the fractured surfaces after mechanical testing were taken using Moritex Inf 500 DA at different magnifications.. 33.
(44) 4.3 Results and discussion. 4.3.1Composite density. Effect offiber content Figure 4.1 presents the variations of composite density of different plastic content of compression, injection and extrusion molding. For composite prepared by Method A, when the fiber content is 80 wt% or more, the density of a hammer mill compound is higher than that of a cutter mill compound probably because the relative difference of component reinforcements, their aspect ratio and also the extent of chemical modification during milling influences the overall rheological behavior. Fluidity is low when the fiber content is high. Since fluidity is high at 70 wt% of fiber content indicates there may be influences of the pulverization method on the densities of composites. No remarkable relationship is observed between the fiber content and product density. Method A composite is prepared under a press condition setup for bringing the density close to the theoretical density. Therefore, all press pressures and press times differ. When the fiber content is low, theoretical density is attained by low pressure and a short press time. However, high pressure is needed when the fiber content is high. In this case, a compound of low fluidity would be crushed during the molding process. If the fiber shape will be changed during the molding process, the fiber content may have influence on various performances. In this context, press molding has merit that can be applied for a wide range of molding conditions. Therefore, a wide range of fiber contents was selected for making composites of compression molding. For composite prepared by Method B, density of composite also decreased with increase in cellulose content. Hence, the void ratio of these composites would be increasing with increasing fiber content. A possible explanation for the voids is movement of air from within the cell lumen to the cell wall-PP interface during compaction [29]. Again, fluidity of compound is high when the fiber content is low. Since method B molding is carried out under the constant press conditions, a compound. 34.
(45) of high fluidity is expected to gIve a more compact composite. The melt-flow characteristic is peculiar for each formulation and can be estimated, since the technique used in this experiment gives little influence, except for flow characteristics, on the various product performances.. 1.6 1.4 ---"'5 1.2 ~ OJ). -=. .70%. 1. ~80%. ~. 0.8 .;; 0.6 Q 0.4 0.2. 090%. o AC. AH. BC. EL. IX. 10. EW. Composites. Figure 4.1. Density (g/cm 3) of composites with different fiber content of 300f.lm cellulose; Error bars represent standard deviation. Filled bars, CelluloseIPP/MAPP=70/28/2; shaded bars, CelluloseIPPIMAPP=80118/2; open bars, CelluloselPPIMAPP=90/8/2. 2. ~--------~----------------------------,. '"---5 1.5. • 120Jlm. ~. ~. 'E 1 .;; = 0.5 Q. 300Jlm. o 900Jlm. o AC. AH. BC. EL. EW. 10. IX. Composites. Figure 4.2. Density (g/cm 3) of composites with different fiber lengths of 80 wt% fiber content and 20 wt% plastic content. Filled bars, Filled bars, Cellulose fiber length=120llm; shaded bars, Cellulose fiber length=300llm; open bars, Cellulose fiber length=900llm. 35.
(46) Effect offiber length of cellulose Figure 4.2 presents the density of composites of different fiber length of 80 wt% fiber content of compression, injection and extrusion molding. A hammer mill produces more fine powder than a cutter mill. Therefore, when fiber length is long, compound is more finely powdered, ensures high melt fluidity, and so composite density is high. When fiber length is short, this influence is not clear because the fiber is originally small and fine. In addition, packing may be influenced by fiber length. When fibers are long, maximum packing may also be accessed with optimum particle size distribution leading to high density, but it cannot be concluded with the density difference of this level. Composite density decreases when fiber length becomes increased.. Effect of compression, injection molding and extrusion molding There is a tendency that the particle size of a hammer mill compound is smaller than that of a cutter mill compound.. As the result, an aspect ratio becomes larger for cutter. mill fiber. For this reason, the compound with the same resin content may show low fluidity and give the density difference of the composites AH and AC. In case of injection molded composite without processing aids, the density decreases with increasing plastic content. Density was reduced with lubricant, at fiber content of 80 wt%, hence processing aid developed some void.. Similar observation was observed in. the case of comparison of fiber length.. Effect offiber content on the morphology of the fracture surfaces Charge-coupled device (CCD) micrographs of fractured surfaces of compreSSIOn molded composite containing 30%, 20%, and 10% PP are shown in Figure 4.3. As the fiber content increased, more fluff of fiber was detected. The occurrence of fluff is considered to be a starting point of fracture. This observation is more pronounced with composites of high fiber content, so it is assumed that strength of the composite is maintained by tangles between fibers. As the fiber content increased, more fiber. 36.
(47) ball-like material was observed on the fracture surface. In composite with 70% cellulose, the fiber was dispersed into the matrix and coated with PP. For the composite containing 90% cellulose, a fibrous particle of cellulose was partially covered by. the PP, with part of the surface still not covered. This proves that a fully developed interfacial interaction was not developed in the 90% cellulose composite.. Figure 4.3. Micrographs of fractured surfaces of compression molding composites containing cellulose of 300J.lm fiber length; a, CelluloseIPPIMAPP=70/28/2; b, CelluloseIPP/MAPP=80/ 18/2; c, CelluloselPPIMAPP=90/8/2. 37.
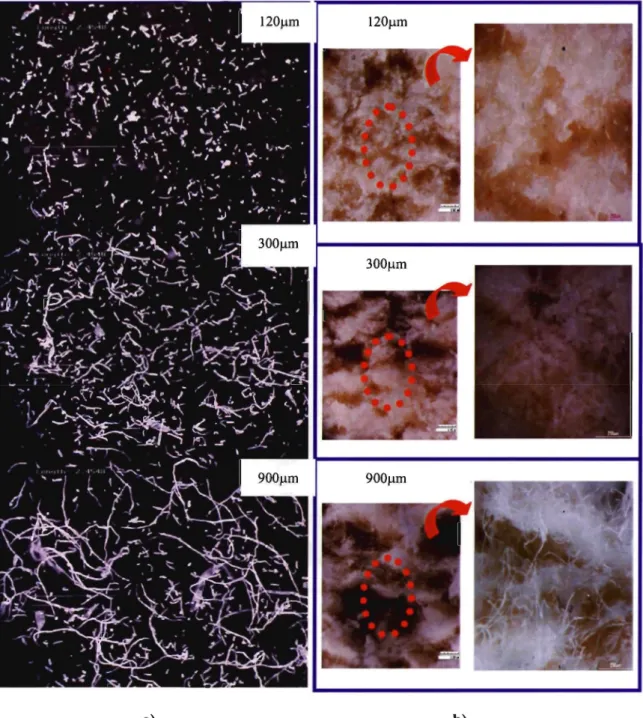
(48) a). b). Figure 4.4. Micrographs of a) cellulose fibers of 120Jlm, 300Jlm and 900Jlm length, and b) fractured surfaces of compression molded composites containing cellulose fibers of 120Jlm, 300Jlm and 900Jlm lenQ"th. 38.
(49) Effect of cellulose fiber length on the morphology of the fracture surface Microscope images of cellulose fiber and fractured surfaces of compression-molded composite with increasing fiber length of cellulose are shown in Figure 4.4. When long fibers were present, they were conspicuous on the fracture surface. A stratified pattern was conspicuous on fracture surfaces when fibers were long. Fracture of composites took place at weak parts of the composite where fibers were not well bonded with resin. Fluff was more conspicuous for composites with long fibers. On other hand, lamination also occurred when fibers were long. This phenomenon should have some influence on the strength. The cellulose fibers with fiber lengths of 120, 300, and 900llm partially changed into micro particles during melt-extrusion processing. In the case of 120llm fibers, homogeneity of the blended mixture was observed, indicating that it should serve as a good filler of polymer matrix.. Effect of compression, injection, and extrusion molding Micrographs of fractured surfaces of extrusion moldings and injection moldings are shown. In. Figure. 4.5.. The. interfacial. interactions. were. limited. In. the. compression-molding composites, probably because of a smaller number of ester bonds between highly fibrous cellulose and the MAPP/PP matrix [30,31]. The micrographs of extrusion-molded composites EW No. 1 composition (120llm fiber length, 80% cellulose) clearly show gaps and voids in the PP matrices as well as along the cellulose fibers, the surfaces of which are smooth and practically intact, and that there exist some aggregates of cellulose fibers. Much improved distribution of particles of cellulose was found in the injection molding with lubricant 10 and without lubricant IX with 120llm fibers and 80% cellulose. The micrographs also reveal a marked improvement in interfacial adhesion between cellulose particles and the MAPP/PP matrix, which was brought about by increased surface area. The fiber was not uniformly dispersed in the melted PP matrix. 39.
(50) Figure 4.5. Micrographs of fractured surfaces of extrusion molding and injection molding composite with 80 wt% fiber content and 20 wt% plastic content. IX, Injection mold without lubricant; 10, Injection mold with lubricant; EW, Extrusion mold sample in widthwise direction. Conclusions. This study focused on composite density comparison and evaluation of the morphology of cellulose/polypropylenelMAPP composite. The composite of small fiber showed good compatibility and adhesion between the plastic and the cellulose fiber, while the composites of long fiber showed poor adhesion between the two phases. Extrusion allows better mixing of cellulose, thermoplastic and additives because of the high shear of extrusion processing, as shown by CCD micrographs.. 40.
(51) CHAPTERS Thermal Mechanical Analysis and Dynamic Thermal Mechanical Analysis of Cellulose/Polypropylene/MAPP Composites 5.1 Introduction. Thermal mechanical analysis helps in gathering information on the stress transfer and helps explaining the reasons for the property changes [2]. WPC are stiffer and have much lower thermal expansion than plastics and absorb less moisture than wood, and they are also more brittle than plastics and offer lower strength, stiffness, and creep resistance than solid wood [32]. The glass transition temperature (Tg) is one of the most important and representative parameters of the chemical and physical properties of polymer matrix composite materials. Tg can be correlated to the mechanical properties of a composite material, to the chemical structure of its matrix and to the materials performance under specific environmental conditions [33]. All solid materials expand almost linearly (in every direction) with increasing temperature and contract with decreasing temperature. It is this degree of expansion-contraction that can make the phenomenon an unpleasant one, and at the same time challenging for designers with plastic and composite. DMTA supplies an oscillating force, causing a sinusoidal stress to be applied to a sample, which generates a sinusoidal strain. By the measurement of the magnitude of the deformation at the peak of the sine wave and the lag between the stress and strain waves, properties such as the modulus, viscosity, and damping can be calculated. The five regions of viscoelastic behavior typical of a thermoplastic polymer are presented in Figure 5.1. The glass-transition range is characterized by a sharp decrease in the elastic modulus of the polymer and is dependent on the state of the polymer and its thermal properties. In an effort to simplify the determination of Tg, it is commonly defined as the maximum of the damping ratio, E',/ E'(tan 8), or the maximum of g". Several researchers, however, have found that a more accurate determination can be derived from the onset of the. 41.
(52) change in the slope of the E' curve. The effects of fiber size and polymer content on the thermal,. dynamic. and mechanical behavior of cellulose/polypropylene/MAPP. composites are presented in this chapter.. I. ,, I. ,, ,, ,, , I I I. I. I. , I I. I. I I. Glass Transition : Region. ~. Temperature. Figure 5.1. Five regions of polymer viscoelastic behavior.. (1) glassy region; (2). glass-transition region; (3) rubbery region; (4) rubbery flow region; and (5) liquid flow region. 5.2 Experimental Method. 5.2.1 Dynamic mechanical thermal analysis. The dynamic mechanical data were obtained with a Rheology DVE-V4 dynamic visco-elastic analyzer. Samples were tested at 1 Hz in the temperature range 50°C to 250°C with a heating rate of 3°C/min under air. The specimen size was 30 x6x2mm (length xwidth xthickness). The viscoelastic parameters, that is, the mechanical loss factor (damping) tan 8 = E"/ E' (E' and E" are storage and loss moduli, respectively) and. E' , were recorded as a function of temperature. The dynamic forces were 30N (sine wave y= 1.25sin 8).In this experiment a sinusoidal load is applied to the material. A sinusoidal motion, inducing either stretching or bending was applied to the sample.. 42.
(53) Analyzed samples were; neat PP and composites molded by compression, extrusion and injection molding.. 5.2.2 Thermal mechanical analysis Thermal mechanical analysis of the materials as a function of temperature was measured using Thermo-mechanical analyzer (TMA) SS6100 (Seiko Instruments, Tokyo). The heating rate was 3°C Imin over a temperature range of lOoC to 50°C. The specimen dimension was lOx5x2mm (lengthxwidthxthickness). A coefficient of thermal expansion (CTE) was measured for one material over the temperature range of 20°C to 30°C.. 5.3 Results and Discussion. 5.3.1 Dynamic mechanical thermal analysis. Effect offiber content Dynamic mechanical thermal analysis (DMTA) gives information on storage E' and loss E" moduli, and the dissipation factor (tan 8 = E"/E'). DMTA can give knowledge about the interface between wood/cellulose and polypropylene matrix. The DMTA were performed on various composites of different fiber content in tensile mode. Analyzed samples were; neat PP and composites with 90%, 80%, 70%, cellulose. The storage modulus at 50°C for the different samples is plotted in Figure 5.2. As can be seen in Figure 5.2, the neat PP showed lowest modulus. For all molding processes, addition of cellulose increased the modulus significantly. The injection molding without lubricant composites (IX) showed high modulus compared to injection molding with lubricant (IO). Lubricant thus has a negative effect on storage modulus during DMTA experiments. It is evident from the Figure that the modulus is highest for AC composite of 80% cellulose. In case of IX, modulus of the composites is less affected by fiber content. While modulus decreases with increasing fiber content for AH and 10. The. 43.
(54) increase in storage modulus indicates enhanced adhesion between the filler and matrix, leading to an interphase of higher stiffness. As reported by Lai et al. [34] tan 8 broadens and the peak position shifts if there is an interaction between the matrix polymer and the filler/reinforcement. In Figure 5.3, the peak position of tan 8 of the analyzed composites is plotted. It can be seen in Figure. 5.3 , there is no significant shift in the peak position of tan 8 towards a higher temperature when cellulose is added to the plastic CPP). A further increase or decrease in the peak position towards higher temperatures would be expected for the composites compared to neat PP when PP was mixed with others in a molecular level. A small increase in the tan 8 peak was observed for AH and IX composite containing 80% cellulose. On the other hand, no increase in the tan 8 peak was observed in remaining composites indicating no practical change of matrix in composites.. 1000. ~. ~. 800 . 0% .70%. 600. ~. '--'. ~. ~80%. 400. 090%. 200 0 AC. AH. E. 10. IX. pp. Composites. Figure 5.2. Effects of resm content on the storage modulus of composites with 300J.lID cellulose at 50°C. Filled bars, Cellu(oseIPPIMAPP=70/28/2; shaded bars, Cellu!oseIPPIMAPP=80/ !8/2; open bars, Cellu!oseIPPIMAPP=90/8/2; gray bars, PP. 44.
(55) ,-.,. --. U 0. ~. eo:. ~. Q,. t.O C. eo:. Eo-. 180 160 140 120 100 80 60 40 20 0. .100% . 30% ~20%. 1010%. AC. AH. 10. E. IX. pp. Composites. Figure 5.3. The peak position of tan 8 of composites with different fiber lengths of 80 wt% fiber content and 20 wt% plastic content. Filled bars, Cellu!oseIPP/MAPP=70/28/2; shaded bars, Cellu!oseIPPIMAPP=801l 8/2; open bars , Cellu!oseIPPIMAPP=90/8/2; gray bars, PP. Effect offiber length The cellulose/PP/MAPP composites containing 120, 300, and 900llm cellulose fiber length were selected for investigating the effects of fiber length of cellulose on the composite properties. The results of the DMTA analysis shown in Figure 5.4 are storage modulus of composites with different fiber length of cellulose. For composite AC, it can be seen that the modulus slightly increased to a maximum value for composite containing 120llm. The effect of fiber length was more pronounced for the composite AH . In case of AC, AH, and 10 the modulus tended to decrease with increasing fiber length. On other hand, modulus increases with increasing fiber length for composite E. The tan b peak (Figure. 5.5) decreases when fiber length of cellulose increases in most of the cases. This is expected because the decrease in peak indicates that the number of mobile segments involved has increased indicates more flexible polymer matrix. This may also indicate the formation of fiber ball for longer fiber, leaving a matrix of increasing homogeneity. Furthermore, the tanb peak position of composite AC containing 120llm is shifted a little toward a higher temperature. The shift in the tanb. 45.
(56) peak also shows that the molecular motion is restricted, and this confirms the strong interaction between the cellulose and PP/MAPP. 1200 1000 ,-.. eo: 800 Q.; ~ 600 '-" 400 ~ 200 0. .120flm ~300flm. D900flm. AC. E. AH. 10. IX. Composites. Figure 5.4. Effects of fiber length on storage modulus of composites with 80 wt% fiber content and 20 wt% plastic content at SO°C. Filled bars, Filled bars, Cellulose fiber length= 120j.lm; shaded bars, Cellulose fiber length= 300j.lm; open bars, Cellulose fiber length=900j.lm. 200. U. ~------------------------------------~. 150. e.. ~. • 120flm. eo: ~ 100. ~. f.¢. = eo:. ~. 300flm. o 900flm. 50. o AC. AH. E. 10. IX. pp. Composites. F igure 5.5. The peak position of tan 0 of composites with different resin content of 300llm cellulose. Filled bars, Filled bars, Cellulose fiber length=120j.lm; shaded bars, Cellulose fiber length=300j.lm; open bars, Cellulose fiber length= 900j.lm. 46.
(57) Effect of compression, injection, and extrusion molding. The dynamic mechanical analysis of neat PP and composites was carried out from 50 to 250°C at 1Hz. The loss modulus E" is the viscous response of viscoelastic materials. It is a measure of the energy dissipated or lost as heat per cycle of sinusoidal deformation, when different systems are compared at the same strain amplitude. Figure 5.6 presents the storage modulus (E') as a function of temperature for neat PP and the composites AC, AH, E, 10 and IX with 30% PP/MAPP of fiber length 12 0!-!m. At low temperatures, E' values of AC, AH, IX and 10 are very close to each other. It is an indication, that, at low temperatures the fibrils do not contribute much in imparting stiffness to the composite. In the case of all composites there is a sharp fall in E' on passing through the glass transition temperature (Tg). It is due to the increased molecular mobility of the polymer chains above. Tg.. There is a large fall in modulus. with increasing temperature for PP in comparison with other composites, the stiffness at high temperature being determined by the amorphous regions, which are very submissive above glass transition temperature. Four different transitions were observed in case of PP, the transition between 140 and 160°C and the transition between 160 and 180°C. The latter transition could be subdivided in two sub transitions between 180 and 190°C and between 190 and 205°C. Extrusion molding and Injection molding composites (E, 10, and IX) have four clear transitions, whereas compression molding composites did not show clear transitions. From last transition temperature, the points did not follow a clear trend because of the deformation of the material due to high temperatures next to the melting point. Every transition implied a change in the decreasing slope of the log E', which indicated that the blends became more viscous in nature with rising temperature. In the Figure 5.7, variation of dissipation factor (tan 0 =:= E"IE') with temperature for neat PP and composites at 1 Hz is shown. The ratio of loss modulus to storage modulus is measured as the mechanical loss factor or tan O. The damping properties of the material give the balance between the elastic phase and viscous phase in a polymeric structure. The damping behavior of the composites in the transition region is governed. 47.
(58) by a) mechanical relaxation of the matrix and the fiber themselves b) relaxation of the interface between the fiber and the matrix c) fiber loading and fiber length. It is interesting to study the behavior of the composites at the a relaxation. The peak heights of the composites are less than that of PP. It can be attributed to the higher storage modulus values of these composites at this temperature. There is a negative shift in the Tg of PP phase for the composites in comparison with neat polymer. Tg for neat PP is 163.3°C and for IX and AC it is 164.2°C. For the composites 10, ET, H81, and HlOI, Tg is 155.4, 155.4, and 162.1°C respectively. The shift in Tg in the case of IX and AC is marginal (O.9°C) when compared to neat PP. This result indicates interfacial interaction is poor at this draw ratio. This fact is consistent with the interpretation of the storage modulus curve. Every transition implied a change in the decreasing slope of the log. E' curve and the increase in the tan 8, which indicated that the polymer became more viscous in nature with rising temperature.. 50. Temperature(OC) 100 150. 200. 1.00E+ll N~. 1.OOE+I0. o=. -'- AC. 1.00E+09. 1i. ». -AH I-'-E. 1.00E+08. 1_. e 1.00E+07. 10. I-.-IX. ~ 1.00E+06 o. ~ 1.00E+05. ........---. 1.00E+04. -. pp. Figure 5.6. The storage modulus (E ') as a function of temperature of composites with 120l-lm cellulose/PP/MAPP ratio. fiber. length. 48. cellulose. and. 80/20.
(59) 2.00E+00. --- AC -AH. 1.50E+00 c.o. ~E. ~. -'- 10 -+- IX. c 1.00E+00 ~ 5.00E-Ol. -. pp. O.OOE+OO 130135140145150155160165170175180185190. TemperatureeC). Figure 5.7. The vanatlOn of tan8 as a function of temperature of composites with 120Jlm fiber length cellulose and 80/20 cellulose/PP/MAPP ratio. 5.3.2 Thermal mechanical analysis. Effect offiber content Figure 5.8 shows the coefficient of thermal expansion (CTE) of AC, AH, BC, E, IX, 10 composites containing different fiber content. The CTE for each specimen was calculated according to the well-known formula:. CTE = ~ LI Lo~T. Where. ~L. is the change in length (mm), ~T is the change in temperature (OC), and Lo is. the initial composite length (mm). The thermal stability of the materials shows that as the plastic content increases, CTE increases as well. It is well known that the CTE of the low molecular weight polypropylene is greater than the cellulose polymeric matrix, and thus with increase of plastic content in the formulations, the CTE of the resulting cellulose plastic increases. The presence of plastic limits the crystallinity in the matrix and increases the free. 49.
(60) volume present in the system. Thus, increasing the amount of plastic in the formulation gives a more flexible material. Additionally, the negative thermal expansion coefficients IX composite of 80% cellulose content is inferred to be caused by the reduction of length of the molecular chain [45].. 0.00001 0.000008. . 0%. U 0.000006. .70%. ~ 0.000004 '-' ~ 0.000002 U 0 -0.000002 -0.000004. ~80%. 090% ~(;. ~. ~(;. L -_ _ _ _ _ _ _ _ _ _ _ _ _ _ _ _ _----'. Composites. Figure 5.8. The coefficient of thermal expansion (CTE) of composites with different fiber content of 300Jlm cellulose. Filled bars, CelluloseIPPIMAPP=70/28/2; shaded bars,. Cellulose/PPIMAPP=80/ 18/2; open. bars,. CelluloseIPP/MAPP=90/8/2; gray bars, PP. EJ.Tectofjlberlength Figure 5.9 shows the effect of the fiber length of cellulose on the CTE of AC, AH, BC, E, 10 and IX composites. Composite of short fiber exhibited the higher CTE, whereas long fiber showed lower CTE of these composites. The CTE depends upon the type of bonding between the constituent molecules/atoms, and is larger for van der Waals-type than for covalent type bonded solids.. EJ.Tect of compression, injection, and extrusion molding For neat PP, the coefficient of thermal expansion (CTE) is about twice as much compared with cellulose/PPIMAPP composites, which are 70% filled with cellulose. The amount of filler affects the value of CTE. Fibers are tightly squeezed in the matrix during mold cooling because of which the fiber poses a mechanical restrain on the. 50.
(61) opening of the polymer chain during heating and thus reduce the overall CTE of the composite. Surface of the wood fiber acted as an additional nucleating site for the formation of crystallite of PP matrix therefore enhancing the crystallinity of the matrix as revealed from the DMT A results of the cellulose/PP/MAPP composite. The increased crystallinity would pack the matrix more densely thus resulting in reduction of CTE. This can be another identifiable reason for the reduction of CTE of a crystalline polymer like PP when filled with cellulose fiber [35]. 0.000004 0.000003 __ 0.000002. .120~m. U ~ 0.000001. ~300~m. '-'. D900~m. ~. 0. U -0.000001. 'r'G. -0.000002 -0.000003. Composites. Figure 5.9. The coefficient of thermal expansion (CTE) of composites with different fiber lengths of 80 wt% fiber content and 20 wt% plastic content. Filled bars, Filled bars, Cellulose fiber length= 120llm; shaded bars, Cellulose fiber length=300IlI11; open bars, Cellulose fiber length=900IlI11. Conclusions Biofiber-plastic composite of cellulose and polypropylene were fabricated usmg compression, extrusion and injection molding. Different compositions of the composites were characterized by dynamic thermal mechanical analysis and thermal mechanical analysis, Wood fiber embodied in PP matrix gave an appreciable rise in storage modulus . Coefficient of linear thermal expansion (CTE) of composites was uniformly reduced with the fiber reinforcement.. 51.
(62) PART 2. STUDY OF COMPLETE BIOPLASTIC BY REPLACING. WITHPLLA. 52. PP.
図


+7


関連したドキュメント
An example of a length 4 highest weight category which is indecompos- able and Ringel self-dual, and whose standard modules are homogeneous, is the path algebra of the linear
Bounds on the effective energy density of a more general class of the Willis dielectric composites.. Gaetano Tepedino Aranguren, Javier Quintero C.,
Answering a question of de la Harpe and Bridson in the Kourovka Notebook, we build the explicit embeddings of the additive group of rational numbers Q in a finitely generated group
In our previous paper [Ban1], we explicitly calculated the p-adic polylogarithm sheaf on the projective line minus three points, and calculated its specializa- tions to the d-th
Applications of msets in Logic Programming languages is found to over- come “computational inefficiency” inherent in otherwise situation, especially in solving a sweep of
Shi, “The essential norm of a composition operator on the Bloch space in polydiscs,” Chinese Journal of Contemporary Mathematics, vol. Chen, “Weighted composition operators from Fp,
To be specic, let us henceforth suppose that the quasifuchsian surface S con- tains two boundary components, the case of a single boundary component hav- ing been dealt with in [5]
The matrices of the received classes can be further classified according to the number of black columns before the deciding column: the possible values of this number are 0, 1,.. ,
