──────────────────────── 名古屋市立大学経済学会
オイコノミカ
──────────────────────── 第 47 巻 第2号 平 成 22 年 12 月 1 日 発 行Appropriation Problem, Money Demand, and
Japan’s Stagnation
Appropriation Problem, Money Demand, and
Japan’s Stagnation
*Nianzhi Guo
**Abstract
This paper offers a simple dynamic macroeconomic model to provide a new explanation to the co-existence of the following macroeconomic phenomena observed during Japan’s stagnation since the early 1990s: the drastic rise in Marshall’s k, the drastic fall in household savings, the drastic rise in corporate savings (following their drastic fall in 1980s), and the drastic fall in real growth rate. Our extension of the standard macroeconomic model is the explicit incorporation of the conflict between corporate insiders (corporate managers and/or employees) and outside investors (households) in Japanese corporations. Specifically, in the model we assume that insiders may appropriate part of capital returns which should intrinsically accrue to outsiders. Under this circumstance, we show that outsiders restrain themselves from the investment in productive but appropriable capital and promote the holdings of productive but non-appropriable money. Meanwhile, reacting to this portfolio change of outsiders, insiders increase the capital investment using the corporate savings since the amount of outsiders’ capital returns which they can appropriate decreases. However, the increase in the capital investment of insiders is not large enough to compensate the decrease in that of outsiders, so that the economic growth rate falls. Our model can hence describe the macroeconomic phenomena observed during Japan’s stagnation in a single optimizing framework.
Keywords: Japan’s lost two decades; Insecure property rights; Marshall’s k; Corporate
insider; Outside investor
JEL Classifications: E22; E41; G11; G30; O42
OIKONOMIKA Vol.47 No.2,2010,pp.35-61
────────────
* I would like to thank Hideaki Murase and two anonymous referees for their helpful comments and suggestion.
1. Introduction
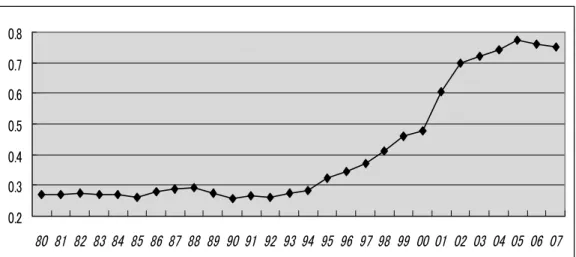
This paper offers a simple dynamic macroeconomic model to provide a new explanation to the co-existence of the following macroeconomic phenomena observed during Japan’s stagnation since the early 1990s named Japan’s lost two decades. The first is the drastic rise in Marshall’s k (see Figure 1 for the ratio of M1 to GDP and Figure 2 for the ratio of M2+CD to GDP). The Marshall’s k associated with M1 was quite stable in the 1980s, but began to increase from 1990 and has shown a sharp increase in the latter half of 1990s and the 2000s. Also, the Marshall’s k associated with M2+CD exhibited a steady increase until the former half of the 1990s but has accelerated its increase from the latter half of the 1990s. The second is the drastic fall in the household savings (see Figure 3 for the ratio of household savings to GDP). The rate of household savings exhibited a moderate decline around 10% in the 1980s but has accelerated its decrease in the 1990s. The third is the drastic fall in the corporate savings in the 1980s and their drastic rise in the 1990s (see Figure 4 for the ratio of corporate savings to GDP). The rate of corporate savings exhibited a drastic decline from 6% to almost 0% in the 1980s but has shown a drastic rise in the1990s and 2000s. The forth is the drastic fall in the real growth rate (see Figure 5 for the growth rate of real GDP). The real growth rate fell from around 4 % per annum to near-zero at the beginning of the 1990s and has remained almost zero during the 1990s and 2000s.
This paper argues that all these facts can be simultaneously and consistently explained in a single optimizing framework. Specifically, we demonstrate this point in an OLG model of endogenous growth, which is an extension of the Tirole (1985) economy. The crucial extension is the explicit incorporation of the conflict between corporate insiders and outside investors into the model. Specifically, in the model we assume that insiders may appropriate part of capital returns which should intrinsically accrue to outsiders. Under this circumstance, we show that, outsiders restrain themselves from the investment in productive but appropriable capital and promote the holdings of non-productive but non-appropriable money. Meanwhile, reacting to this portfolio change of outsiders, insiders increase the capital investment using the corporate savings since the amount of outsiders’ capital returns which they can appropriate decreases. However, the increase in the capital investment of insiders is not large enough to compensate the decrease in that of outsiders. Hence, the economic growth rate falls due to the decrease in the total amount of capital investment.
In this paper, we interpret corporate insiders in the model as corporate managers and/or employees under long-term employment systems. Corporate managers may engage in the
appropriation activity known as the “free cash flow” problem. Specifically, they may retain corporate profits inside corporations as corporate savings and, using the retained profits, can pursue their own benefits at the sacrifice of the capital returns accruing to outside investors. Also, employees under long-term employment systems are de facto “inside investors” in the sense that their compensations are basically managed under the seniority system, i.e., they obtain compensations below their contributions to corporations when young and obtain compensations above their contributions when old. Hence, as “inside investors” they can appropriate the capital returns accruing to outside investors, demanding a high level of compensations when old. Meanwhile, we interpret outside investors in the model as general households who have no special connection with each corporation.
The interpretation reflects the argument that the decline in bank control yet to be replaced by stock market control beginning in the 1980s in Japan led to the escalated conflict of interest between corporate insiders and households; see, e.g., Ando, 2002; Ando, Christelis, and Miyagawa, 2003; Hayashi, 2006; Saito, 2008; and Murase, 2009 who argue that the vacuum of corporate governance has escalated the conflict of interest between corporate insiders and households in 1990s and 2000s. Of course, it is not easy to obtain an index properly representing the level of appropriation activity within Japanese corporations. However, the change in the level of appropriation activity might be approximately captured by the movement of corporate payouts (measured as the sum of interest payments and dividend payouts) over time. In fact, since the early 1990s the amount of payouts of Japanese corporations has been declining continuously and remarkably. Specifically, the ratio of the payouts to GDP (see Figure 6 for the ratio of the sum of interest payments and dividend payouts of non-financial corporations to GDP) has steadily declined from 13% to 5%. This fact may be strong supporting evidence which indicates that the appropriation problem of Japanese corporations has become increasingly sever during the 1990s and 2000s. Thus, if our interpretation can well trace the facts of the Japanese corporate governance, our model can capture the macroeconomic phenomena observed during Japan’s stagnation.
The present paper is related to several stands of previous research. First, our model is a version of the neo-classical supply-side theories which argue that Japan’s stagnation can be interpreted as the decrease in the potential growth rate; see, among others, Hayashi and Prescott (2002) who understand the stagnation in terms of the private sector’s rational reaction to the lowered growth rate of total factor productivity. However, most of the supply-side theories focus only on the real side of the economy and abstract from monetary phenomena. The notable exception is Andolfatt (2003) who extends the Hayashi-Prescott model into a monetary growth
model. However, Andolfatt (2003) focuses on the effects of a series of exogenous negative supply shocks to create the prolong stagnation and does not touch on the problems associated with the Japanese corporate governance. Further, he considers an exogenous growth model and hence the sharp decline in the real growth rate resulting from the conflict of interest between corporate insiders and outside investors is out of scope.
Second, Murase (2009a,b) are closest in spirit to the present paper in that both papers demonstrate that the weak governance of Japanese corporations is the main cause of Japan’s prolong stagnation. Specifically, both papers argue this point in a monetary model of endogenous growth. However, there is also a crucial difference between his papers and ours. That is, he focuses on the labor-capital conflict and the resulting profit squeeze phenomenon. Thus, his papers and the present paper focus on the different aspects of the vacuum of governance in Japanese corporations, although we think that his papers and ours are not mutually exclusive but complementary.
Finally, and more broadly, our model is related to the growth models which analyze the relationship between insecure property rights and economic growth. Under the lack of proper mechanisms of property rights enforcement, economic agents engage not only in productive activity but also predatory activity. In dynamic settings of economic growth, Benhabib and Radner (1992) and Tornell and Velasco (1992) demonstrate that insecure property rights creates the “common pool” effect which reduces the accumulation of capital stock and hence economic growth (see also Benhabib and Rustichini, 1996; Lane and Tornell, 1996; Tornell, 1997). The appropriation problem stemming from the vacuum of governance which our model focuses on leads to a similar “common pool” effect, i.e., outsiders who are appropriated by insiders reduces the capital investment, which causes a decline in the economic growth. In this aspect, the dynamic models of “common pool” and ours rely on the same effect in explaining the economic stagnation. However, most of the “common pool” models focus only on the real side of the economy and abstract from monetary phenomena. Further, such models usually analyze a single-asset economy, so that the phenomenon of the substitution of capital into money generated by the appropriation problem (which is our main focus) is out of scope of the analysis. The rest of the paper is organized as follows. The next section sets up a simple dynamic macroeconomic model and explains the basic assumptions. Section 3 analyzes the non-monetary version of our model economy as a benchmark and uncovers the basic macroeconomic effects of the conflict between inside investors and outside investors. Section 4 extends the model of Section 3 to a monetary economy and shows that our model can simultaneously and consistently explain the macroeconomic phenomena observed during Japan’s stagnation. Section 5 concludes
the paper.
2. The model
This section constructs a simple OLG model to simultaneously and consistently explain the macroeconomic phenomena observed during the Japan’s stagnation. The model is the extended version of the OLG economy of Tirole (1985). The extensions are threefold: (i) Aggregate output is proportional to accumulated capital, which may allow an endogenous growth of the
economy;1 (ii) Agents are heterogeneous in the ability and power to access to capital returns.
Specifically, they are divided into two groups: insiders who have a larger ability and power to access capital returns and outsiders who have a smaller ability and power to do so; (iii) Capital accumulation suffers from the appropriation problem due to the conflict between insiders and outsiders, i.e., insiders may appropriate (part of) capital returns which should intrinsically accrue to outsiders.
2.1. Production
The economy produces a single output good using two production factors: capital and labor. The output good can be either consumed or used as capital. Capital is accumulated according to the following difference equation (or the national income identity):
(1) yt=ct+kt+1−kt,
where ytis the aggregate output, ctis the aggregate consumption, ktis the aggregate capital,
and the subscript denotes time.2
We consider a production function of the Romer (1986) type, which takes into account the external effect of aggregate capital deepening on the productivity of labor. This type of a production function leads to the possibility of an endogenous growth of the economy. Specifically, we assume that the production function takes the following Cobb-Douglas form: (2) yt=kt
α{a(k t)lt}
1−α,
────────────
1 See Grossman and Yanagawa (1993) for the extension of Tirole economy to an endogenous growth economy.
2 Here we assume, for algebraic simplicity and without loss of any insight about the qualitative nature of our model
where a(kt) is the external effect of aggregate capital deepening, ltis the aggregate labor, and α is a constant with 0<α<1. As discussed in the next subsection, we assume that ltis
constant over time and equal to unity. Also, we assume that the external effect takes the following linear form: a(kt)=A
1
─
1−αk
t, where A is a positive constant.
The factor markets are perfectly competitive and hence the factor prices are determined according to the principle of marginal productivity. Note that, at the time of employing production factors, the employers take factor prices and the external effect of aggregate capital deepening a(kt) as exogenously-given. Hence we obtain:
(3) wt=(1−α)Akt, rt=αA,
where wtis the income flow accruing to a unit of labor (henceforth called the real wage) and rt
is the income flow accruing to a unit of capital (henceforth called the real interest rate). Note
that the real interest rate is determined by exogenously-given parameters, α and A; hence we
hereafter drop time subscript from it, i.e., rt=r.
2.2. Preference
We consider an overlapping generations economy. Each generation is comprised of a continuum of two-period-live agents of measure one. Hence, there is no population growth. For analytical simplicity, we assume that each agent has a logarithmic utility function and derives the utility from both the consumption when young and the consumption when old:
(4) U(ct1,ct2+1)=logct1+βlogct2+1,
where ct1(ct2+1) is the consumption when young (when old) of each agent born at time t and β
is her subjective discount factor with 0≤β≤1.
Each agent inelastically supplies one unit of labor when young and no labor when old;
hence the aggregate labor supply ltis constant over time and equal to unity. Further, each
young agent is assumed to be identical and earns the same real wage. However, old agents are divided into two groups which differ in the ability and power to access to capital returns: insiders and outsiders. We assume that the population sizes of insiders and outsiders are respectively θ and 1−θ with 0<θ<1. When each agent is young, she knows which group she will belong to when old. Then, the budget constraints of each insider and each outsider when young are respectively given by:
(5) ct 1I+s t I=w t, and ct 1o+s t o=w t, where ct 1I(c t
1o) is each insider’s (outsider’s) consumption when young and s
t I (s
t
o) is each
insider’s (outsider’s) savings. .
We assume that two assets are available as the means of savings: capital and money. Hence,
stI=ktI+1+mtI andsto=kot+1+mto, where ktI+1(kto+1) is each insider’s (outsider’s) capital investment
and mt I (m
t
o) is each insider’s (outsider’s) real money holdings when young. The two assets
differ in the following two aspects. First, capital is a productive asset used for good production, while money is a non-productive asset serving only as means of store of value. Second, money enjoys the perfect protection of property rights since it is privately held by each agent. However, capital may lack the perfect protection of property rights since capital thrown into the production process may suffer from the appropriation problem. Specifically, we assume that insiders may appropriate capital returns which should intrinsically accrue to outsiders. More specifically, the budget constraints of each insider and each outsider when old are respectively given by: (6) ct+1 2I =(1+r)(k t+1 I +ε──1−θ θ kt+1 o )+m t+1 I , and c t+1 2o =(1+r)(1−ε)k t+1 o +m t+1 o ,
where ct2I+1(ct2o+1) is each insider’s (outsider’s) consumption when old, , and mtI+1(mto+1) is each
insider’s (outsider’s) real money holdings when old: note that mtI+1=──mt I 1+πt+1 (mto+1=──mt o 1+πt+1 ), where πt+1is the expected and actual inflation rate. Further, ε (0≤ε≤1) is the appropriation
rate which parameterizes the degree of the strength of property rights enforcement: the higher the value of ε, the weaker the enforcement, and vice versa.
3. The non-monetary economy
We first analyze the non-monetary version of our model economy as the benchmark, so that in this section we assume that mt+1
I =m t+1
o =0.
Saving decision and capital accumulation
First, let us discuss the saving decisions of insiders and outsiders. From (4), (5), and (6), each insider solves the following maximization problem:
(7) max log(wt−kt+1 I )+βlog(1+r)(k t+1 I +ε──1−θ θ kt+1 o ).
This maximization problem yields: (8) kt+1 I =──β 1+βwt−── 1 1+β ε──1−θθkt+1 o .
The amount of savings (or that of capital investment in the non-monetary economy) of each young insider negatively depends on the appropriation rate and the amount of savings of young outsiders. This is exactly the “common pool” effect identified by the growth models of Benhabib and Radner (1992) and Tornell and Velasco (1992). Specifically, since we assume a logarithmic utility function, the rate of savings of each young insider intrinsically does not depend on the rate of capital returns (i.e., the substitution effect associated with the changes in the rate of capital returns cancels out its income effect). It is noteworthy, however, that the rate of savings of each young insider may changes according to the appropriation rate through the additional income effect induced by the “common pool” effect (a decrease in the savings caused by an increase in the future income), as seen in (11) below.
Meanwhile, each outsider solves the following maximization problem:
(9) max log(wt−kt+1
o )+βlog(1+r)(1−ε)k t+1
o .
This maximization problem yields: (10) kt+1
o =──β
1+βwt=── β
1+β (1−α)Akt.
Since the utility function is logarithmic, the rate of savings of each young outsider does not depend on the rate of capital returns. Hence, neither it depends on the appropriation rate.
Further, from (8) and (10), we can obtain the amount of savings of each young insider as follows: (11) ktI+1=(1−──1+1β ε──1−θ )θ ── β 1+β wt=(1−──1+1β ε──1−θ )θ ── β 1+β (1−α)Akt.
paper, we limit our analysis to the case where this ratio is positive, i.e., 1−──1+1βε──1−θθ>0. Specifically, her saving rate may change according to the appropriation rate although we assume a logarithmic utility function which ensures that the saving rate does not depend on the rate of capital returns itself.
Finally, form (10) and (11), the dynamics of the aggregate capital is given by: (12) kt+1=θkt+1
I +(1−θ)k t+1
o ={1−───ε(1−θ)
1+β }──1+ββ (1−α)Akt.
Hence, it is known that capital accumulation is more deterred as the appropriation rate increases. Balanced growth path
Next, given the results obtained above, we examine the growth rate and the aggregate savings of outsiders and insiders in the non-monetary economy.
From (12), we obtain the growth rate (gt) as:
(13) 1+gt=─ yt+1 yt = ──Akt+1 Akt ={1− ───ε(1−1+β }θ) ──1+ββ(1−α)A≡1+gNM(ε).
Note that the growth rate is decreasing in the appropriation rate. This occurs because, due to the “common pool” effect, insiders who can appropriate part of capital returns of outsiders reduce their capital investment, while outsiders’ capital investment does not depend on the appropriation rate and is kept constant.
Hereafter, to streamline the analysis, we limit our attention to the case where the growth rate of the non-monetary economy is positive, i.e., gNM(ε)>0. Further, we assume that the
non-monetary economy would be dynamically efficient if there were no appropriation problem, i.e., 1+gNM(0)<1+r. It is also noteworthy that, since the capital investments of outsiders and
insiders are proportional to the aggregate capital investment (see (10) and (11)), the capital investments of outsiders and insiders grow at the same rate as the aggregate capital grows. Hence, the growth path of our model economy is described as a balanced growth path.
The aggregate savings of outsiders at each time are given by the savings of young outsiders net of the dissavings of old outsiders. Hence, from (11), the ratio of the aggregate savings of outsiders to the national products (i.e., the saving rate of outsiders) is:
σto=──────── (1−θ)kt+1 o −(1−θ)k t o yt = ──────────── (1−θ)──1+ββ(1−α)A(kt−kt−1) Akt (14) . =(1−θ)──β 1+β(1−α){1−───gNM1(ε) }≡σoNM(ε)
Note that the saving rate of outsiders decreases as the appropriation rate increases.3 This occurs
since the decrease in the growth rate of the national product leads to a decrease in the relative size of savings of young agents to those of old agents through the decrease in the growth rate of incomes (i.e., real wages).
Meanwhile, the ratio of the aggregate savings of insiders to the national product (i.e., the saving rate of insiders) is:
σtI=──── θkt+1 I −θk t I yt = ──────────────── θ(1−──1+1βε──1−θ )θ ──1+ββ (1−α)A(kt−kt−1) Akt (15) . =θ{1−──1 1+βε──1−θ }θ ──1+ββ(1−α){1−────1+g1NM(ε) }≡σINM(ε)
Since we have assumed that the rate of savings of each young insider is positive, i.e.,
1−──1+1βε──1−θθ>0, the saving rate of insiders decreases as the appropriation rate increases.4
This occurs since, in addition to the effects of the decrease in the growth rate as discussed in the case of outsiders, the strengthened “common pool” effect directly leads to a decrease in the savings of young insiders. Thus, the decrease in the saving rate of insiders has two origins and may be severer than that of outsiders.
In sum, in the non-monetary economy, the aggravation of the appropriation problem causes the decrease in the saving rate of outsiders, that of insiders, and the growth rate of the national product. To illustrate the relationships between these macroeconomic variables and the appropriation rate, we here use numerical examples. Of course, our model abstracts from many important factors of the actual economy. Hence, our theoretical results may, in essence, be
────────────
3 Since , the saving rate of outsiders more rapidly
decreases as the appropriation rate becomes higher.
4 Since , the saving
compared to the reality of the Japanese economy qualitatively but not quantitatively, although we make attempts to seek a set of parameters giving roughly realistic values of some of the concerned macroeconomic variables. First, taking a time unit of our OLG model as thirty years,
we adopt parametric assumption β=0.6 (implying that the one-year discount factor is 0.985).
Second, we set α=0.3 (implying the labor share of the economy is 0.7). The values of θ and
A are not easy to specify in isolation. Hence, based on (14), we here try θ=0.4 which gives 2.8% as the real growth rate of national product (the average over the 1980s and the 90s) and 8.9% as the saving rate of outsiders (the average over the 1980s and the 90s). Finally, since the reality of value of A is harder to evaluate, we try three values (small, medium, and large), i.e.,
A=15, A=20, and A=25. These values of A are chosen so as to give positive saving rates of insiders both in the non-monetary economy analyzed here and in the monetary economy analyzed in the next section. Figures 7, 8, and 9 depict the relationships between these macroeconomic variables against the appropriation rate (Note that the growth rate of the national product is expressed as the one per annum). The model might capture some macroeconomic phenomena observed during Japan’s stagnation, namely, the decline in the saving rate of households (outsiders) and the growth rate, but would not reach the full description of the phenomena addressed in the introduction such as the rise in the saving rate of corporations (insiders). In the next section, we will discuss how the results are modified if we consider a monetary version of our economy.
4. The monetary economy
In this section, we analyze the monetary version of our model economy in which agents can use money as well as capital as a means of store of value.
Saving decision and capital accumulation
First, let us discuss the saving decisions of insiders and outsiders. Again, from (4), (5), and (6), each insider solves the following maximization problem:
(16) max log(wt−kt+1 I −m t I)+βlog{(1+r)(k t+1 I +ε──1−θ θ kt+1 o )+──mtI 1+πt+1} . This maximization problem yields:
(17) .
Meanwhile, each outsider solves the following maximization problem:
(18) max log(wt−kt+1 o −m t o)+βlog{(1+r)(1−ε)k t+1 o +──mto 1+πt+1} . This maximization problem yields:
(19) .
Thus, from (17) and (19), we obtain: (20) .
Note that the aggregate capital and the aggregate money demand are given by
kt+1=θkt+1 I +(1−θ)k t+1 o and m t=θmt I+(1−θ)m t
o respectively. Hence, from (19) and (20),
(21) , and mt=0, if (1+r)(1−ε)>──1+1π t+1 mt=(1−θ)mot , if (1+r)(1−ε)=──1 1+πt+1 (22) mt=(1−θ)── β 1+β (1−α)Akt, if (1+r)(1−ε)<── 1 1+πt+1<1+r . mt=θmt I+(1−θ)──β 1+β (1−α)Akt, if ──1+1π t+1=1+r mt=── β 1+β(1−α)Akt, if ──1+1π t+1>1+r
Balanced growth path
Next, given the results obtained above, we examine the economic growth rate, the aggregate savings of outsiders and insiders, and the money demand in the monetary economy. For convenience, we here define κt≡mt/yt (i.e., Marshall’s k). We again focus on the balanced
growth path, on which output, capital, and real money balances grow at the same rate. Hence, on the path, Marshall’s k and the saving rate are constant over time.
(23) 1+gt=─ yt+1 yt = ─kt+1 kt = ─mt+1 mt = ──1+1π t+1 .
To present the analysis clearly, we separately discuss the following three cases. Case 1 ( (1+r)(1−ε)>──1+1π
t+1
).
In this case, the dynamics of the economy is the same as that of the non-monetary economy since mt+1
I =m t+1
o =0. That is, the growth rate of the national product and the saving rates of
outsiders and insiders in the “Case 1” monetary economy are respectively given by
outsiders and that of insiders, and the growth rate are all decreasing in the appropriation rate, with κt=0.
Note that both 1+gM1(ε) and (1+r)(1−ε) are decreasing linear functions of ε .
Further, 1+gM1(0)<1+r(which means that the economy with no appropriation problem is
dynamically efficient) and 1+gM1(1)>0.5 Hence, 1+gM1(ε*)=(1+r)(1−ε*) has a unique
solution ε*∈(0,1) and we confirm that Case 1 occurs when 0≤ε≤ε*. Case 2( (1+r)(1−ε)=──1+1π
t+1
).
In this case, the dynamics of the economy is expressed by the following two equations: (24) kt+1={1−───ε(1−1+β }θ) ── β 1+β(1−α)Akt−(1−──1+εβ )mt , and (25) (1+r)(1−ε)=─mt+1 mt .
Rearranging (23) and (24) yields: (26) 1+gt={1−───ε(1−1+β }θ) ──
β
1+β(1−α)A−(1−──1+εβ )Aκt ,
and rearranging (23) and (25) yields: (27) 1+gt=(1+r)(1−ε)≡1+gM2(ε).
Hence, from (26) and (27), we obtain:
(28) κt=────────────────
{1−───ε(1−1+β }θ) ──1+ββ(1−α)A−(1+r)(1−ε) (1−──ε
1+β )A
≡κM2(ε).
From (28), it is easily checked that Case 2 occurs when ε*≤ε<ε** where
κM2(ε**)=(1−θ)──β
1+β(1−α) or alternatively 1+gM2(ε**)=θ──1+ββ (1−α)A (notice that
────────────
5 Both conditions, together with the fact that 1+gM1(ε) and (1+r)(1−ε) are linear functions of ε, imply that gM1'(ε)>−(1+r).
(1−θ)──β
1+β (1−α)Akt is the total amount of savings of young outsiders and
θ──1+ββ(1−α)Akt is that of young insiders).
We can confirm that gM2'(ε)=−(1+r)<gM1'(ε)<0 (see footnote 7) and
κM2'(ε)=──β
1+β ─────────
(1+r)+{──1+θβ(1−α)A}
(1−──1+εβ )2A >0.
6 The growth rate decreases more rapidly in Case
2 than in Case 1 as the appropriation rate increases. This occurs because, in Case 2, outsiders more rely on money instead of capital in making their savings as the appropriation rate increases. This phenomenon is also reflected in the fact that Marshall’s k rapidly increases as the appropriation rate increases.
The aggregate savings of outsiders at each time are given by the savings of young outsiders net of the dissavings of old outsiders. Hence, from (19), the saving rate of outsiders is:
σto=────────────── (1−θ)(kt+1 o +m t o)−(1−θ)(k t o+m t−1 o ) yt =──────────── (1−θ)──1+β β(1−α)A(kt−kt−1) Akt (29) . =(1−θ)──1+β β(1−α){1−────1+g1M2(ε)}≡σoM2(ε)
It is easily checked that σoM2'(ε)=(1−θ)──β
1+β(1−α)───── gM2
'(ε)
{1+gM2(ε)}2<σoM1'(ε)<0 , since
gM2'(ε)<gM1'(ε)<0 and 0<gM2(ε)<gM1(ε) . The saving rate of outsiders more rapidly
decreases in Case 2 than in Case 1 as the appropriation rate increases.7 This occurs because the
decrease in the growth rate of the national product leads to a decrease in the relative size of savings of young agents to those of old agents through the decrease in the growth rate of income (i.e., real wage).
Meanwhile, from (20), the saving rate of insiders is:
────────────
6 Note that . Hence, the Marshall’s k more rapidly
decreases as the appropriation rate becomes higher.
7 Note that . Hence, the saving rate of outsiders
σtI=──── θkt+1 I −θk t I yt = ──────────────────────── θ(1−──1+1β ε──1−θ )θ ──1+ββ(1−α)A(kt−kt−1)+──1+1βε(mt−mt−1) Akt (30) . =[{θ−───ε(1−θ) 1+β }──1+ββ(1−α)+──1+εβκM2(ε)]{1−────1+g1M2(ε)}≡σIM2(ε)
The differentiation of (30) yields:
Thus, the sign of σIM2'(ε) depends on the relative magnitudes of the two opposing effects:
The first is a negative effect stemming from the decrease in the growth rate of national product which also appears in Case 1, while the second effect is a positive one stemming from the portfolio change of outsiders which is reflected in the increase in Marshall’s k. Unfortunately, a general condition about which one of the two opposing effects dominates the other is not easy to analytically obtain. Hence, using a set of reasonable parameter values, we show the existence of the case where the first effect is dominated by the second effect within the range of
ε∈[ε*
’ε**). Specifically, as in the analysis of the non-monetary economy, we fix the
parameter values as β=0.6, α=0.3, θ=0.4, and A=15; β=0.6, α=0.3, θ=0.4, and
A=20; and β=0.6, α=0.3, θ=0.4, and A=25. In each case, we obtain: ε*=0.39 and
ε**=0.71; ε*=0.35 and ε**=0.70); and ε*=0.32 and ε**=0.69. Figure 10 below depicts the relationship between the saving rate of insiders and the appropriation rate. In these numerical examples, we confirm that the saving rate of insiders may increase as the
appropriation rate increases within the range of ε∈[ε*
’ε**) in the cases of A=20 and
A=25. This seemingly paradoxical result occurs because, as the appropriation rate increases,
outsiders restrain themselves from the capital investment and promote the money holdings. This means that the amount of resources which insiders can appropriate decreases. In other words, the “common pool” effect becomes more moderate as the appropriation rate increases, which may in turn promote the capital investment of insiders.
Case 3 ( (1+r)(1−ε)<──1+1π
t+1<1+r
)
(31) kt+1=θ── β 1+β (1−α)Akt , and (32) mt=(1−θ)── β 1+β(1−α)Akt. Rearranging (31) yields: (33) 1+gt=θ── β 1+β(1−α)A≡1+gM3,
and rearranging (32) yields:
(34) κt=(1−θ)──
β
1+β(1−α)≡κM3.
Hence, in Case3, the appropriation rate affects neither the growth rate nor Marshall’s k. Further, from (32) and (33), it is known that the condition (1+r)(1−ε)<1+gM3<1+r
should hold for Case 3. This implies that Case 3 occurs when ε**≤ε<1.8
The aggregate savings of outsiders at each time are again given by the savings of young outsiders net of the dissavings of old outsiders. Hence, from (19), the saving rate of outsiders is: σt o=─────────(1−θ)mot−(1−θ)mto−1 yt = ──────────── (1−θ)──1+ββ(1−α)A(kt−kt−1) Akt (35) . =(1−θ)──1+ββ(1−α){1−───1 1+gM3}≡σoM3
Similarly, from (20), the saving rate of insiders: σtI=──── θkt+1 I −θk t I yt =────────── θ──1+β β(1−α)A(kt−kt−1) Akt (36) . =θ──1+β β(1−α){1−───1+1gM3}≡σIM3 ────────────
8 Recall that we assume that the economy with no appropriation problem is dynamically efficient, i.e.,
1+gNM(0)<1+r. Hence, 1+r≤──1 1+πt+1
is impossible in our economy because the condition implies that the growth rate of the economy with the appropriation problem is larger than gNM(0).
Hence, in Case3, the appropriation rate is irrelevant to both the saving rate of outsiders and that of insiders.
In sum, in the monetary economy, the aggravation of the appropriation problem causes the decrease in the saving rate of outsiders and the growth rate of national product. However, it can increase the saving rate of insiders as well as Marshall’s k. We depict the relationships between
these macroeconomic variables and the appropriation rate using numerical examples: β=0.6,
α=0.3, θ=0.4, and A=15; β=0.6, α=0.3, θ=0.4, and A=20; and β=0.6, α=0.3,
θ=0.4, and A=25 (see Figures 10, 11, 12, and 13). As indicated by the analytical results
obtained above as well as the figures illustrating them (especially in the cases of A=20 and
A=25) the model can consistently capture the notable features of the macroeconomic
phenomena observed during Japan’s stagnation addressed in the introduction.
5. Conclusion
This paper has offered a simple dynamic macroeconomic model to provide a new explanation to the co-existence of the macroeconomic phenomena observed during Japan’s stagnation since the early 1990s. Our crucial extension of the standard macroeconomic model is the explicit incorporation of the conflict between corporate insiders and outside investors into a process of capital accumulation. Specifically, we assume that insiders may appropriate part of capital returns which should intrinsically accrue to outsiders.
In this model setting, we have obtained the seemingly paradoxical phenomenon that, as the appropriation problem becomes severer, insiders increase (rather than decrease) their capital investment. This result occurs because, as the appropriation problem becomes severer, outsiders restrain themselves from the capital investment and promote the money holdings. This implies that the amount of resources which insiders can appropriate decreases. Hence, reacting to the portfolio change of outsiders, insiders increase the capital investment using the corporate savings. This property of our model may reasonably well trace the co-existence of the decrease in the household saving rate and the increase in the corporate saving rate observed during Japan’s stagnation.
Finally, we wish to mention the future extensions of the current research. In the present model, we focus on the means of store of value as a role of money. However, in the real world, money plays a role of the means of exchange media, so that it is interesting to analyze how the results obtained in this paper are affected when we explicitly consider both roles of money. Specifically, in such an extended framework, we may examine the movement of the nominal
interest rate according to the change in the appropriation rate and its effect on economic growth. Further, since the analytical framework offered in this paper is quite standard except for the incorporation of the conflict between corporate insiders and outside investors into the model. Hence, it might be applied to various macroeconomic phenomena of many other countries. For example, Continental European countries had been trapped in a prolonged stagnation in the 1980s, but some of them experienced steady recovery in the 1990s. It has been often argued that, behind this economic revitalization, the reform of their corporate governance systems (especially, the introduction of capital market discipline and the removal of labor market rigidity) can considerably raise the rate of capital returns of those countries’ corporations. This experience of Continental European countries may suggest that international comparative studies based on the macroeconomic framework incorporating the conflict between corporate insiders and outside investors is also an interesting topic of future research which might provide a more profound understanding of the relation between corporate governance and macroeconomic performance.
References
Ando, A. (2002) Missing household saving and valuation of corporations. Journal of the Japanese and International Economies,16, 147-176.
Ando, A., D. Christelis, and T. Miyagawa (2003) Inefficiency of corporate investment and distortion of savings behavior in Japan. in M. Blomstrom et al. eds., Structural Impediments to Growth in Japan, 155-190,University of Chicago Press.
Andolfatt, D. (2003) Monetary implications of the Hayashi-Prescott hypothesis for Japan. Monetary and Economic Studies (Bank of Japan), 21, 1-20.
Benhabib, J. and A. Rustichini (1996) Social conflict and growth. Journal of Economic Growth, 1, 125-142. Benhabib, J. and R. Radner (1992) The joint exploitation of a productive asset: A game-theoretic approach.
Economic Theory, 2, 155-199.
Grossman, G.M. and N. Yanagawa (1993) Asset bubbles and endogenous growth. Journal of Monetary Economics, 31, 3-19.
Hayashi, F. (2006) The over-investment hypothesis. In L.R. Klein, ed. Long-Run Growth and Short-Run Stabilization: Essays in Memory of Albert Ando, Edward Elgar.
Hayashi, F. and E.C. Prescott (2002) The 1990s in Japan: A Lost Decade. Review of Economic Dynamics, 5, 206-235.
Lane, P.R. and A. Tornell (1996) Power, growth and the voracity effect. Journal of Economic Growth, 1, 213-241. Murase, H. (2009a) Macroeconomics of corporate governance: An alternative interpretation of Japan’s lost
decade from the standpoint of investors. (in Japanese) Economic Review, 60, 228-240.
Murase, H. (2009b) Macroeconomics of weak governance with a new interpretation of Japan’s lost decade. Discussion Paper (Society of Economics, Nagoya City University), No. 492.
Romer, P.M. (1986) Increasing returns and long-run growth. Journal of Political Economy, 94, 1002-10037. Saito, M. (2008) On the substitutability between household consumption and capital investment. (in Japanese) In
K. Asako, ed. The Trend of Modern Economics 2008, 27-68, Toyokeizai.
Tirole, J. (1985) Asset bubbles and overlapping generations. Econometrica, 53, 1499-1528.
Tornell, A. (1997) Economic growth and decline with endogenous property rights. Journal of Economic Growth, 2, 219-250.
Tornell, A. and A. Velasco (1992) The tragedy of the commons and economic growth: Why does capital flow poor to rich countries? Journal of Political Economy, 100, 1208-1231.
Figure 1. The ratio of M1 to GDP
Sources: Bank of Japan, Financial and Economic Statistics Monthly; Economic and Social Research Institute of Cabinet Office, Annual Report on National Accounts.
Figure 2. The ratio of M2+CD to GDP
Sources: Bank of Japan, Financial and Economic Statistics Monthly; Economic and Social Research Institute of Cabinet Office, Annual Report on National Accounts.
0.2 0.3 0.4 0.5 0.6 0.7 0.8 80 81 82 83 84 85 86 87 88 89 90 91 92 93 94 95 96 97 98 99 00 01 02 03 04 05 06 07 0.8 0.9 1 1.1 1.2 1.3 1.4 1.5 80 81 82 83 84 85 86 87 88 89 90 91 92 93 94 95 96 97 98 99 00 01 02 03 04 05 06 07
Figure 3. The ratio of household savings to GDP
Source: Economic and Social Research Institute of Cabinet Office, Annual Report on National Accounts.
Figure 4. The ratio of corporate savings to GDP
Source: Economic and Social Research Institute of Cabinet Office, Annual Report on National Accounts.
0 0.02 0.04 0.06 0.08 0.1 0.12 0.14 80 81 82 83 84 85 86 87 88 89 90 91 92 93 94 95 96 97 98 99 00 01 02 03 04 05 06 07 0 0.01 0.02 0.03 0.04 0.05 0.06 80 81 82 83 84 85 86 87 88 89 90 91 92 93 94 95 96 97 98 99 00 01 02 03 04 05 06 07
Figure 5. The growth rate of real GDP
Source: Economic and Social Research Institute of Cabinet Office, Annual Report on National Accounts.
Figure 6. The ratio of interest payments plus dividend payouts to GDP
Source: Economic and Social Research Institute of Cabinet Office, Annual Report on National Accounts.
-0.05 -0.03 -0.01 0.01 0.03 0.05 0.07 80 81 82 83 84 85 86 87 88 89 90 91 92 93 94 95 96 97 98 99 00 01 02 03 04 05 06 07 0.04 0.06 0.08 0.10 0.12 0.14 80 82 84 86 88 90 92 94 96 98 00 02 04 06 08
Figure 7. The saving rate of outsiders (The non-monetary economy)
Figure 8. The saving rate of insiders (The non-monetary economy) 0.0400 0.0500 0.0600 0.0700 0.0800 0.0900 0.1000 0.1100 0.1200 0.1300 0.1400 0.00 0.20 0.40 0.60 0.80 1.00
A=15 A=20 A=25
0.0000 0.0100 0.0200 0.0300 0.0400 0.0500 0.0600 0.0700 0.0800 0.0900 0.1000 0.00 0.20 0.40 0.60 0.80 1.00
Figure 9. The growth rate of national product (The non-monetary economy)
Figure 10. The saving rate of outsiders (The monetary economy)
Note: ε*=0.39 and ε**=0.71(A=15); ε*=0.35 and ε**=0.70(A=20); ε*=0.32 and ε**=0.69(A=25).
0.0200 0.0300 0.0400 0.0500 0.0600 0.0700 0.00 0.20 0.40 0.60 0.80 1.00
A=15 A=20 A=25
0.0500 0.0600 0.0700 0.0800 0.0900 0.1000 0.1100 0.1200 0.1300 0.1400 0.00 0.20 0.40 0.60 0.80 1.00
Figure 11. The saving rate of insiders (The monetary economy)
Note: ε*=0.39 and ε**=0.71(A=15); ε*=0.35 and ε**=0.70(A=20); ε*=0.32 and ε**=0.69(A=25).
Figure 12. The growth rate of national product (The monetary economy)
Note: ε*=0.39 and ε**=0.71(A=15); ε*=0.35 and ε**=0.70(A=20); ε*=0.32 and ε**=0.69(A=25).
0.0350 0.0450 0.0550 0.0650 0.0750 0.0850 0.00 0.20 0.40 0.60 0.80 1.00
A=15 A=20 A=25
0.0100 0.0200 0.0300 0.0400 0.0500 0.0600 0.0700 0.00 0.20 0.40 0.60 0.80 1.00
Figure 13. Marshall’s K (The monetary economy)
Note: ε*=0.39 and ε**=0.71(A=15); ε*=0.35 and ε**=0.70(A=20); ε*=0.32 and ε**=0.69(A=25).
0.0000 0.0200 0.0400 0.0600 0.0800 0.1000 0.1200 0.1400 0.1600 0.1800 0.00 0.20 0.40 0.60 0.80 1.00
平成22年12月1日発行
編集者 名古屋市立大学経済学会 名古屋市瑞穂区瑞穂町字山の畑1 印刷所 ㈱正鵠堂