83
* Graduate School of Health and Welfare Science, Okayama Prefectural University
** Department of Nutritional Science, Okayama Prefectural University, 111 Kuboki, Soja, Okayama 719-1197, Japan 1. Introduction
There is no doubt that the rapid growth in aging population becomes a major global concern, and this trend is expected to continue with a concurrent increase in age-related diseases (1). Aging, as an inevitable process, could lead to physiological functional decline in metabolic, respiratory, and exercise capacity associated with loss of skeletal muscle mass and strength, obesity, and many metabolic diseases, such as type 2 diabetes (2-4). In skeletal muscle, aging process contributes to muscle weakness and increased fatigability (5), leading to impaired mobility and
loss of independence in individuals (6). Maximal oxygen uptake (VO2max) declines with age, possibly due to a diminished capacity to deliver and extract O2 during exercise, in humans (7, 8). Further, compared to young rats (3-6 months old), spontaneous locomotor activity of aged rats (24-27 months old) was found to be lower (9). Conley et al. (10) reported a 50% reduction in oxidative capacity in older human subjects compared to young subjects, due to reduced mitochondrial volume and reduced mitochondrial function. Age-related impaired mitochondrial function in muscles is attributed to reduced mitochondrial DNA
Age-related changes in energy metabolism and skeletal muscle
function of Sprague-Dawley rats
YUN MA*,HITOMI MARUTA**,BAOJUN SUN*, HIROMI YAMASHITA*
,**
Abstract:As the aging population grows worldwide, the importance of research on aging and age-related changes is emerging. Aging, as an inevitable process, could lead to physiological functional declines in metabolic, respiratory, and exercise capacity, and could be associated with many diseases. In this study, we examined age-related changes, including O2 consumption volume (VO2), spontaneous locomotor activity, tissue weight, blood biochemical index, and gene expression in skeletal muscle of Sprague-Dawley (SD) rats, aged 32 to 92 weeks. Our findings suggest that the aging process might contribute to a decline in the VO2, spontaneous locomotor activity, and glucose oxidation of rats aged 90 weeks compared to that of rats aged 32 weeks. With advancing age, skeletal muscle mass decreased significantly in rats aged 85 weeks (soleus muscle: 0.47 g/kg, gastrocnemius (Gas) muscle: 5.00 g/kg), and 92 weeks (soleus muscle: 0.50 g/kg, Gas muscle: 5.62 g/kg) compared to that in rats aged 32 weeks (soleus muscle: 0.70 g/kg, Gas muscle: 8.89 g/kg). With aging, the levels of genes Myh7, Ppargc1α, Cycs, and sdha, and mitochondrial DNA, which are related to skeletal muscle function and muscle oxidative capacity, decreased significantly in the soleus muscle of rats aged 85 and 92 weeks compared to that of rats aged 32 weeks. In addition, lipid accumulation in skeletal muscle and weight of white adipose tissue (WAT) around kidney increased with age in rats. This study may clarify age-related changes in energy metabolism, skeletal muscle characteristics, and lipid accumulation in rats, and provide a potential perspective for anti-aging research.
84
content (11). Previous studies reported that the master regulator of metabolism and mitochondrial functions (12, 13), peroxisome proliferator-activated receptor gamma coactivator 1-alpha (PGC-1 α ), decreased during aging (14). Aging is also associated with dysregulation of lipid metabolism. Honma showed that the weight of white adipose tissue (WAT) and levels of liver triacylglycerol, plasma free fatty acids (FFA), and plasma insulin showed an increase with aging in SAMP10 mice (15). Muscle RING-finger 1 (MuRF1), which is highly induced in atrophying muscle, may play an important role in the breakdown of myofibrillar proteins (16, 17). Atrogin-1 mRNA increases 8 to 40-fold in atrophy study, and this increase precedes the onset of muscle weight loss (16, 18). Moreover, knockout animals lacking atrogin-1 show a reduced rate of muscle atrophy after denervation (18). There may be various factors involved with the aging process. In this study, we further investigated age-related changes, including VO2, spontaneous locomotor activity, tissue weight, blood biochemical index, and gene expression in skeletal muscle of Sprague-Dawley (SD) rats aged 32 to 92 weeks.
2.Materials and Methods 2.1 Materials
Formalin, 2-mercaptoethanol, 1% eosin Y solution, and commercial assay kit for free fatty acid (FFA) (NEFA C-Test Wako), cholesterol (Cholesterol E-Test Wako) and Oil-Red O were purchased from FUJIFILM Wako Pure Chemical Corporation (Osaka, Japan). Ethanol and nitro blue tetrazolium were purchased from Sigma-Aldrich (St. Louis, MO, USA), and hematoxylin from Merck KGaA (Darmstadt, Germany). Quick and Mount-Quick aqueous mounting media were purchased from Daido Sangyo Co., Ltd (Tokyo, Japan). Sepasol-RNA I Super G and sodium succinate were purchased from Nacalai Tesque (Kyoto, Japan). RNase inhibitor, ReverTra Ace® qPCR (quantitative polymerase chain reaction) Master Mix, and gDNA (genomic DNA) remover kit were purchased
from TOYOBO Co., Ltd. (Osaka, Japan). KAPA SYBR® FAST qPCR kit was purchased from Kapa Biosystems (Wilmington, MA, USA).
2.2 Animal experiments
The care and use of the animals in this study followed the guidelines of Okayama Prefectural University and the laws and notifications of the Japanese government. All animal experiments were approved by the Animal Care and Use Committee of Okayama Prefectural University (protocol number 27-3). Male SD rats aged 32 weeks (n=4-15) were obtained from Charles River Laboratories Japan, Inc. (Yokohama, Japan). They were housed individually in an air-conditioned room at 25 °C with an alternating 12 h light/dark cycle (light, 8:00-20:00). All rats were allowed free access to commercial food (CE-2, CLEA Japan, Inc., Tokyo, Japan) and water. Food intake and body weight were measured daily. Respiratory metabolism was measured with VO2 and CO2 generation volumes, using a metabolism measuring system (MK-5000, Muromachi Kikai, Tokyo, Japan), and spontaneous locomotor activity was measured using an infrared sensor (SUPERMEX SENSOR PYS-001, Muromachi Kikai, Tokyo, Japan). Each rat was kept in a sealed chamber for 24 h at 25°C. The airflow was 3.0 L/min. The animals had free access to water and food. At the age of 32, 85, and 92 weeks, the rats were anesthetized by an intraperitoneal injection of pentobarbital sodium (100 μ L/100 g of body weight). Tissue were collected and stored at -80 °C until subsequent measurements. Blood samples were collected in heparinized tubes and centrifuged at 3,000 × g and 4 °C for 10 min and plasma was obtained. FFA and cholesterol in plasma were determined by commercial kit.
2.3 Histological analysis
The soleus muscle was cut into 10 μ m sections using a Leica CM3050 S cryostat (Leica Microsystems, Wetzlar, Germany) at -20 °C and fixed in 10% (v/v) formalin. The sections were stained with hematoxylin and eosin (H&E) and mounted in Mount-Quick medium. The
85 sections were stained with Oil-Red O and mounted
in Mount-Quick Aqueous medium. For succinate dehydrogenase (SDH) staining, the soleus sections were air-dried at room temperature and incubated in a solution consisting of 50 mM phosphate buffer (6 mM potassium dihydrogenphosphate and 44 mM disodium hydrogenphosphate), 50 mM sodium succinate, and 0.5 mg/mL nitro blue tetrazolium at 37 °C for 40 min. The sections were washed in double distilled H2O for 3 min and mounted in Mount-Quick aqueous mounting medium. Images were captured with a CCD camera (Olympus Optical, Tokyo, Japan) at × 100 magnification.
2.4 qRT-PCR analysis
Total RNA was isolated from frozen tissue with Sepasol-RNA I Super G. RNase inhibitor was added according to the manufacturer’s instructions. Total RNA was measured and cDNA was prepared using the ReverTra Ace® qPCR Master Mix and
gDNA remover kit. After RNA extraction with Sepasol RNA I Super G, DNA was obtained by 250μl back extraction buffer (4 M guanidine thiocyanate; 50 mM sodium citrate; 1 M Tris, pH 8.0) into the phenol phase and interphase. qRT-PCR was performed in a StepOnePlus real-time PCR system (Applied Biosystems, CA, USA) using the KAPA SYBR® FAST qPCR kit, to evaluate specific mRNA content. Data were normalized to β -actin mRNA, and the expression levels were compared to the mRNA expression values in rats aged 32 weeks. The qRT-PCR primers are listed in Table 1. 2.5 Statistical analysis
Data are presented as mean ± standard error (SE). Results were analyzed using Student’s T-test or subjected to one-way analysis of variance (ANOVA) followed by the Tukey-Kramer post-hoc test (Statcel4, OMS Inc., Tokyo, Japan).
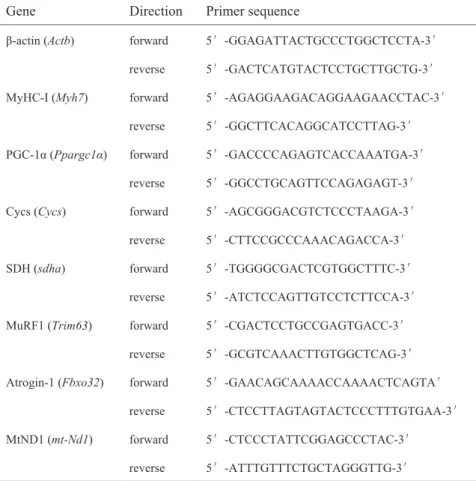
Table 1. Primers used for PCR.
Gene Direction Primer sequence
β-actin (Actb) forward 5′-GGAGATTACTGCCCTGGCTCCTA-3′ reverse 5′-GACTCATGTACTCCTGCTTGCTG-3′ MyHC-I (Myh7) forward 5′-AGAGGAAGACAGGAAGAACCTAC-3′
reverse 5′-GGCTTCACAGGCATCCTTAG-3′ PGC-1α (Ppargc1α) forward 5′-GACCCCAGAGTCACCAAATGA-3′
reverse 5′-GGCCTGCAGTTCCAGAGAGT-3′ Cycs (Cycs) forward 5′-AGCGGGACGTCTCCCTAAGA-3′ reverse 5′-CTTCCGCCCAAACAGACCA-3′ SDH (sdha) forward 5′-TGGGGCGACTCGTGGCTTTC-3′
reverse 5′-ATCTCCAGTTGTCCTCTTCCA-3′ MuRF1 (Trim63) forward 5′-CGACTCCTGCCGAGTGACC-3′
reverse 5′-GCGTCAAACTTGTGGCTCAG-3′ Atrogin-1 (Fbxo32) forward 5′-GAACAGCAAAACCAAAACTCAGTA′
reverse 5′-CTCCTTAGTAGTACTCCCTTTGTGAA-3′ MtND1 (mt-Nd1) forward 5′-CTCCCTATTCGGAGCCCTAC-3′
reverse 5′-ATTTGTTTCTGCTAGGGTTG-3′
Table 2. Aging-related changes on tissue weight of WAT (kidney), WAT (testicle),
soleus muscle and Gas muscle in SD rats at age 32, 85 and 92 weeks.
g/kg-BW 32w 85w 92w
WAT (kidney) 19.4 ± 1.86 a 38.8 ± 3.35 b 38.3 ± 2.19 b
WAT (testicle) 20.9 ± 1.19 a 22.5 ± 1.48 a 25.1 ± 1.04 a
Soleus 0.70 ± 0.03 a 0.47 ± 0.04 b 0.50 ± 0.06 b
Gas 8.89 ± 0.50 a 5.00 ± 0.33 b 5.62 ± 0.54 b
Values shown represent means ± SE of 3-7. Results were analyzed with one-way ANOVA followed by the Tukey-Kramer post hoc test for multiple comparisons. Groups without the same letter are significantly different (p<0.05).
86
3.Results
3.1 Age-related changes in VO2 and
spontaneous locomotor activity of SD rats
Age-related changes in VO2 (mL/min/kg) and spontaneous locomotor activity over 20 (count/min) were determined and glucose oxidation rates (mg/ min/kg) were calculated during the day (10:00-8:00) for the rats aged 32 and 90 weeks (Figure 1). Relative to rats aged 32 weeks, VO2 tended to be decreased in the rats aged 90 weeks (Figure 1A). As the rats aging, spontaneous locomotor activity also tended to be decreased in rats at the age of 90 weeks compared to that of rats aged 32 weeks (Figure 1A). Glucose oxidation was decreased significantly in rats at age of 90 weeks relative to
rats aged 32 weeks (Figure 1B).
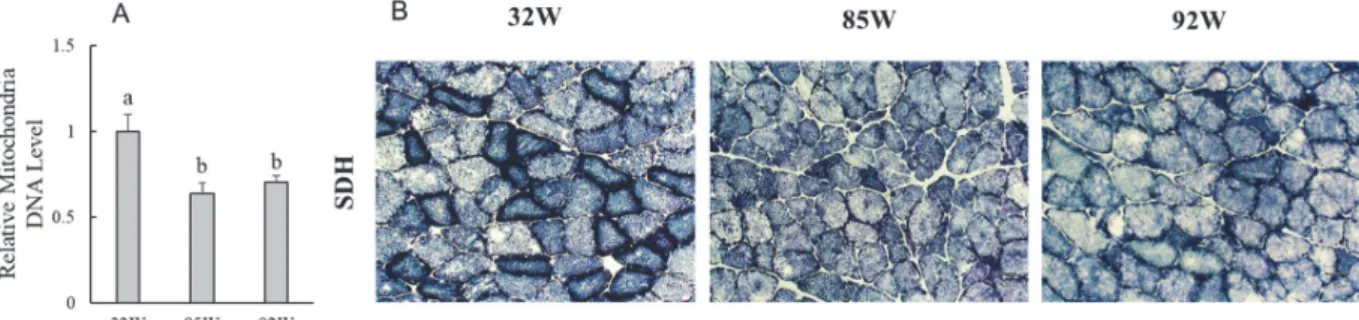
3.2 Skeletal muscle function analysis The relative mitochondrial DNA level were decreased significantly in the soleus muscle of rats aged 85 and 92 weeks compared to that of rats aged 32 weeks (Figure 2A). SDH staining of soleus muscle was performed to characterize mitochondrial enzyme function and myofiber oxidative capacity (19,20). From the results of SDH staining, the soleus muscle of rats aged 85 and 92 weeks showed a decrease in the positive staining level compared to that of rats aged 32 weeks (Figure 2B). With aging, mRNA expression of myosin heavy chain 7 (MyHC-I) (Myh7), PGC-1α (Ppargc1α), cytochrome c (Cycs) (Cycs), and SDH
Figure 1. Age-related changes in VO2 (mL/min/kg), spontaneous locomotor activity over 20
(count/min) (A), and glucose oxidation (mg/min/kg) during the day (10:00-8:00) in SD rats aged 32 and 90 weeks. The values shown represent mean ± SE of 4-15 rats. B: The results were analyzed using Student’s t-test. Statistical differences are shown as **p<0.01.
Figure 2. Age-related changes in mitochondrial function of soleus muscle.
(A) Relative mitochondrial DNA level in soleus muscle. The results were analyzed with one-way ANOVA followed by the Tukey-Kramer post-hoc test for multiple comparisons. The groups without the same letter present a statistically significant difference (p<0.05). The values shown represent mean ± SE of 3-6 rats. (B) SDH staining of soleus muscle section of SD rats aged 32, 85, and 92 weeks. Magnification: ×100; Scale bar: 50 μm
Figure 1. Age-related changes in VO2 (mL/min/kg), spontaneous locomotor activity over 20 (count/ min) (A), and glucose oxidation (mg/min/kg) during the day (10:00-8:00) in SD rats aged 32 and 90 weeks. The values shown represent mean ± SE of 4-15 rats. B: The results were analyzed using Student’s t-test. Statistical differences are shown as **p<0.01.
Figure 2. Age-related changes in mitochondrial function of soleus muscle.
(A) Relative mitochondrial DNA level in soleus muscle. The results were analyzed with one-way ANOVA followed by the Tukey-Kramer post-hoc test for multiple comparisons. The groups without the same letter present a statistically significant difference (p<0.05). The values shown represent mean ± SE of 3-6 rats. (B) SDH staining of soleus muscle section of SD rats aged 32, 85, and 92 weeks. Magnification: × 100; Scale bar: 50 μ m
87 (sdha) decreased significantly in the soleus muscle
of rats aged 85 and 92 weeks compared to that of rats aged 32 weeks (Figure 3). Expression of MuRF1 (Trim63) and Atrogin-1 (Fbxo32) mRNA increased significantly in the soleus muscle of rats aged 85 and 92 weeks compared to that of rats aged 32 weeks.
3.3 Lipid accumulation in tissues
As shown in Table 2, weight of WAT around the kidney increased significantly in the rats aged 85 weeks (38.8 ± 3.35 g/kg) and 92 weeks (38.3 ± 2.19 g/kg) compared to that in rats aged 32 weeks (19.4 ± 1.86 g/kg). The weight of WAT around the
testicle increased, but not statistically significant, in rats aged 85 and 92 weeks, compared to that in rats aged 32 weeks. The mass of soleus muscle decreased significantly in rats aged 85 weeks (0.47 ± 0.04 g/kg) and 92 weeks (0.50 ± 0.06 g/kg) compared to that in rats aged 32 weeks (0.70 ± 0.03 g/kg). The mass of Gas muscle also decreased significantly in rats aged 85 weeks (5.00 ± 0.33 g/ kg) and 92 weeks (5.62 ± 0.54 g/kg) compared to that in rats aged 32 weeks (8.89 ± 0.50 g/kg). As rats aged, the level of plasma FFA (mEq/ L) increased significantly in rats aged 50 to 92 weeks compared to that in rats aged 32 weeks (Figure 4A). The level of plasma cholesterol (mg/
Table 1. Primers used for PCR.
Gene
Direction
Primer sequence
β-actin (Actb) forward 5′-GGAGATTACTGCCCTGGCTCCTA-3′ reverse 5′-GACTCATGTACTCCTGCTTGCTG-3′ MyHC-I (Myh7) forward 5′-AGAGGAAGACAGGAAGAACCTAC-3′
reverse 5′-GGCTTCACAGGCATCCTTAG-3′ PGC-1α (Ppargc1α) forward 5′-GACCCCAGAGTCACCAAATGA-3′
reverse 5′-GGCCTGCAGTTCCAGAGAGT-3′ Cycs (Cycs) forward 5′-AGCGGGACGTCTCCCTAAGA-3′ reverse 5′-CTTCCGCCCAAACAGACCA-3′ SDH (sdha) forward 5′-TGGGGCGACTCGTGGCTTTC-3′
reverse 5′-ATCTCCAGTTGTCCTCTTCCA-3′ MuRF1 (Trim63) forward 5′-CGACTCCTGCCGAGTGACC-3′
reverse 5′-GCGTCAAACTTGTGGCTCAG-3′ Atrogin-1 (Fbxo32) forward 5′-GAACAGCAAAACCAAAACTCAGTA′
reverse 5′-CTCCTTAGTAGTACTCCCTTTGTGAA-3′ MtND1 (mt-Nd1) forward 5′-CTCCCTATTCGGAGCCCTAC-3′
reverse 5′-ATTTGTTTCTGCTAGGGTTG-3′
Table 2. Aging-related changes on tissue weight of WAT (kidney), WAT (testicle),
soleus muscle and Gas muscle in SD rats at age 32, 85 and 92 weeks.
g/kg-BW
32w
85w
92w
WAT (kidney)
19.4 ± 1.86
a38.8 ± 3.35
b38.3 ± 2.19
bWAT (testicle)
20.9 ± 1.19
a22.5 ± 1.48
a25.1 ± 1.04
aSoleus
0.70 ± 0.03
a0.47 ± 0.04
b0.50 ± 0.06
bGas
8.89 ± 0.50
a5.00 ± 0.33
b5.62 ± 0.54
bValues shown represent means ± SE of 3-7. Results were analyzed with one-way
ANOVA followed by the Tukey-Kramer post hoc test for multiple comparisons. Groups
without the same letter are significantly different (p<0.05).
Figure 3. Age-related changes in relative mRNA expression levels of MyHC-I (Myh7), PGC-1α
(Ppargc1α), Cycs (Cycs), SDH (sdha), MuRF1 (Trim63), and Atrogin-1 (Fbxo32) in soleus muscle of SD rats aged 32, 85, and 92 weeks.
The values shown represent mean ± SE of 3-6 rats. The results were analyzed with one-way ANOVA followed by the Tukey-Kramer post-hoc test for multiple comparisons. The groups without the same letter present a statistically significant difference (p<0.05).
Table 2. Aging-related changes on tissue weight of WAT (kidney), WAT (testicle), soleus muscle and Gas muscle in SD rats at age 32, 85 and 92 weeks.
Figure 3. Age-related changes in relative mRNA expression levels of MyHC-I (Myh7), PGC-1α
(Ppargc1α), Cycs (Cycs), SDH (sdha), MuRF1 (Trim63), and Atrogin-1 (Fbxo32) in soleus muscle of SD rats aged 32, 85, and 92 weeks.
The values shown represent mean ± SE of 3-6 rats. The results were analyzed with one-way ANOVA followed by the Tukey-Kramer post-hoc test for multiple comparisons. The groups without the same letter present a statistically significant difference (p<0.05).
Figure 4. Age-related changes in plasma FFA and cholesterol in SD rats aged 32 to 92 weeks.
(A) Plasma FFA level (mEq/L), (B) Plasma cholesterol level (mg/dL). The values shown represent
mean ± SE of 3-12 rats. The results were analyzed with one-way ANOVA followed by the Tukey-Kramer post-hoc test for multiple comparisons. The groups without the same letter represent a statistically significant difference (p<0.05).
88
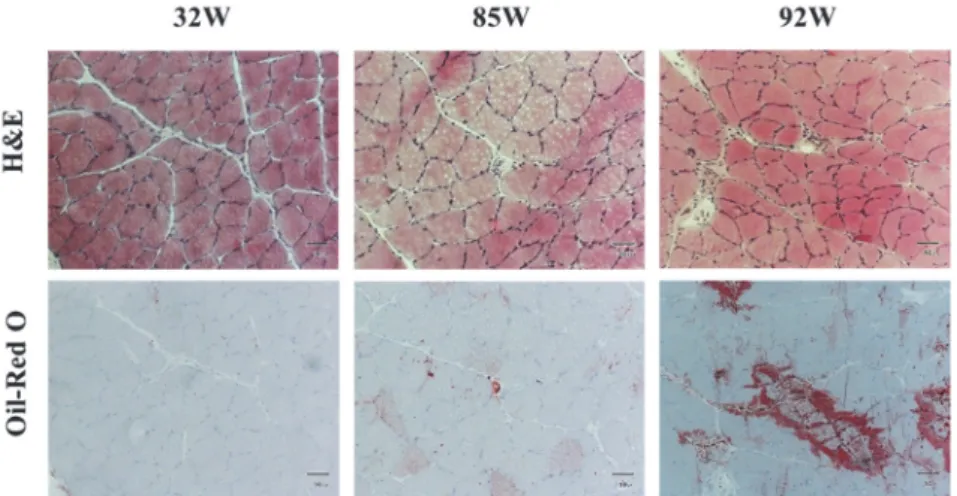
dL) tended to increase in rats during the aging process (Figure 4B). The results of H&E staining and Oil-Red O staining, age-related changes in the soleus muscle in SD rats, are shown in Figure 5. The tissue sections with Oil-Red O staining in rats aged 85 weeks showed more lipid accumulation and it of 92 weeks showed a marked increase in lipid accumulation compared to that in rats aged 32 weeks.
4.Discussion
As rats aging, the VO2 tended to be decreased in rats at the age of 90 weeks compared to that of rats aged 32 weeks (Figure 1A). This suggests that the aging process might contribute to decline in O2 consumption, which is indicated as a typical age-related change. In a study in humans, Rivera reported that VO2max was lower in master runners than in young runners because of a diminished capacity to deliver and extract O2 during exercise, in master runners (8). In this study, with advancing age, the spontaneous locomotor activity tended to be decreased in rats at the age of 90 weeks compared to that of rats aged 32 weeks (Figure 1A). In a previous study, aged rats (24-27 months old) consistently presented lower spontaneous locomotor activity compared to young rats (3-6 months old), during the dark cycle (20:00-8:00) (10). In another study, aged F344 rats showed 75-80% reduction in locomotor activity
compared to young rats (21). This indicates that the loss of spontaneous locomotor activity is an unavoidable phenomenon and a characteristic of the aging process. In this study, glucose oxidation was also decreased significantly from 32 to 90 weeks (Figure 1B), which indicates that energy metabolism through glucose oxidation might be decreased with age. Rooyackers showed that a significant decline in oxidative capacity occurred in skeletal muscle with aging (22), which might explain the decline in glucose oxidation in the skeletal muscles of rats in this study, and might also explain the decrease in VO2 and spontaneous locomotor activity of the aged rats.
Age-related muscle weakness and reduced aerobic capacity result not only in diminished physical performance, but also in metabolic disorders in humans (23,24). Reduced muscle mitochondrial function could contribute to age-related muscle dysfunction and reduced aerobic capacity (11). In this study, it was observed that the relative mitochondrial DNA level was decreased significantly in the soleus muscle of rats aged 85 and 92 weeks compared to that of rats aged 32 weeks (Figure 2A). SDH activity is a performance for mitochondrial oxidative capacity (19,25), and SDH staining results showed that mitochondrial oxidative capacity decreased in the soleus muscle of rats aged 85 and 92 weeks compared to that
Figure 4. Age-related changes in plasma FFA and cholesterol in SD rats aged 32 to 92 weeks. (A) Plasma FFA level (mEq/L), (B) Plasma cholesterol level (mg/dL). The values shown represent mean ± SE of 3-12 rats. The results were analyzed with one-way ANOVA followed by the Tukey-Kramer post-hoc test for multiple comparisons. The groups without the same letter represent a statistically significant difference (p<0.05).
Figure 3. Age-related changes in relative mRNA expression levels of MyHC-I (Myh7), PGC-1α
(Ppargc1α), Cycs (Cycs), SDH (sdha), MuRF1 (Trim63), and Atrogin-1 (Fbxo32) in soleus muscle of SD rats aged 32, 85, and 92 weeks.
The values shown represent mean ± SE of 3-6 rats. The results were analyzed with one-way ANOVA followed by the Tukey-Kramer post-hoc test for multiple comparisons. The groups without the same letter present a statistically significant difference (p<0.05).
Figure 4. Age-related changes in plasma FFA and cholesterol in SD rats aged 32 to 92 weeks.
(A) Plasma FFA level (mEq/L), (B) Plasma cholesterol level (mg/dL). The values shown represent
mean ± SE of 3-12 rats. The results were analyzed with one-way ANOVA followed by the Tukey-Kramer post-hoc test for multiple comparisons. The groups without the same letter represent a statistically significant difference (p<0.05).
89 of rats aged 32 weeks (Figure 2B). Ermini et al.
showed that SDH activity decreases in the muscles of old rats as compared to young rats (26). Myosin heavy chain is an essential component of skeletal muscle and is associated with skeletal muscle contraction function (23, 27, 28). With advancing age, relative mRNA expression levels of PGC-1α, Cycs, and SDH decreased significantly in the soleus muscle of rats aged 85 and 92 weeks, compared to that of rats aged 32 weeks (Figure 3). PGC-1α plays a major role in metabolic regulation (29, 30), oxidative capacity (31), and regulation of respiration in skeletal muscle (32). Dillon also showed that during aging, there is a decrease in PGC-1α expression in the heart and skeletal muscles (33). Cycs is essential for energy production and mitochondrial respiration, as a component of the electron transport chain and as a mitochondrial marker protein (34, 35). The results of this study showed that the aging process might contribute to age-related decline of mRNA expression involved in mitochondrial oxidative function. Atrogin-1 and MuRF-1 have been identified as important enzymes in muscle atrophy, and regulation of their expression has the potential to prevent or reverse muscle atrophy in patients with sarcopenia (36). In this study, the relative mRNA expression levels of MuRF1 and Atrogin-1 were increased significantly in the soleus muscle of rats aged 85 and 92 weeks compared to that of rats aged 32 weeks.
Aging is also associated with the dysregulation of lipid metabolism. In this study, the weight of WAT around the kidney was increased significantly and skeletal muscle mass was decreased significantly in rats aged 85 and 92 weeks compared to that in rats aged 32 weeks (Table 2). Previous research by Honma et al. found that the weight of WAT (epididymal, mesenteric, and perirenal) was increased significantly with aging in SAMP10 mice (15). As per previous studies, a typical adult will lose muscle mass with age and lead to a reduction in muscle function (2), referred to as sarcopenia of aging (24). In this study, Oil-Red O staining results showed that lipid accumulation was also increased in the soleus muscle of SD rats aged 92 weeks compared to that of rats aged 32 weeks (Figure 5). FFA level in the plasma was also increased significantly as the rats aged (Figure 4). In a previous study, plasma FFA was increased significantly in mice aged 6 months and 12 months, compared to that in mice aged 3 months (15). Elderly humans subjects (71+2 yr old) displayed higher plasma FFA levels (897 ± 107 µmol/L vs. 412 ± 50 µmol/L, p<0.01) in the basal state compared to younger subjects (21+2 yr old) (37). In this study, plasma cholesterol level of aged rats was tended to increase. Alessio found that usual age-related physiological changes include increased blood cholesterol, increased body fat, decreased
Figure 5. Age-related changes in H&E and Oil-Red O staining of soleus muscle of SD rats aged 32, 85, and 92 weeks. Magnification: ×100; Scale bar: 50 μm
Figure 5. Age-related changes in H&E and Oil-Red O staining of soleus muscle of SD rats aged 32, 85, and 92 weeks. Magnification: × 100; Scale bar: 50 μm
90
lean body mass, and loss of bone density (38). In another study, serum cholesterol levels in SD rats increased sharply in 24 months (173 ± 85 mg/dL), and the levels of serum cholesterol was tended to increase with age in primates (39). It is suggested that the aging process might contribute to the decline of muscle mass, and to the increase in lipid accumulation in the body.
In summary, the aging process might contribute to a decline in O2 consumption, spontaneous locomotor activity, glucose oxidation, skeletal muscle mass and function, and mitochondrial oxidative capacity in skeletal muscle in rats. In addition, lipid accumulation in skeletal muscle, weight of WAT, and levels of FFA were increased with age, in rats. In order to delay the age-related changes in muscle function and lipid accumulation in body, it is important to maintain or improve mitochondrial function in the skeletal muscle. This study may contribute to the understanding of age-related changes in rats and could provide a potential perspective for future anti-aging research, for coping with the concern of a rapidly growing aging population.
Acknowledgments
This work was supported by JSPS KAKENHI Grant Number 15K07437.
Conflict of Interest
The authors declare that there are no conflicts of interest.
References
1 )Mendoza-Núñez, V. M., de la Luz Martínez-Maldonado, M., & Correa-Muñoz, E. (2009) Implementation of an active aging model in Mexico for prevention and control of chronic diseases in the elderly. BMC geriatrics, 9(1): 40. 2 )Kirkendall, D. T., & Garrett, W. E. (1998) The
effects of aging and training on skeletal muscle. The American journal of sports medicine, 26(4): 598-602.
3 )Masoro, E. J. (2001) Physiology of aging. International journal of sport nutrition and exercise metabolism, 11(s1): S218-S222.
4 )Fontana, L. (2009) Modulating human aging and age-associated diseases. Biochimica et Biophysica Acta (BBA)-General Subjects, 1790(10): 1133-1138.
5 )Hepple, R. T., Rice, C. L. (2016) Innervation and neuromuscular control in ageing skeletal muscle. The Journal of physiology, 594(8): 1965-1978. 6 )Cruz-Jentoft, A. J., Landi, F., Topinkova, E., &
Michel, J. P. (2010) Understanding sarcopenia as a geriatric syndrome. Current Opinion in Clinical Nutrition & Metabolic Care, 13(1): 1-7.
7 )Ogawa, T., Spina, R. J., Martin 3rd, W. H., Kohrt, W. M., Schechtman, K. B., Holloszy, J. O., & Ehsani, A. A. (1992) Effects of aging, sex, and physical training on cardiovascular responses to exercise. Circulation, 86(2): 494-503.
8 )Rivera, A. M., Pels 3rd, A. E., Sady, S. P., Sady, M. A., Cullinane, E. M., & Thompson, P. D. (1989) Physiological factors associated with the lower maximal oxygen consumption of master runners. Journal of Applied Physiology, 66(2): 949-954. 9 )Willig, F., Palacios, A., Monmaur, P., M'Harzi,
M., Laurent, J., & Delacour, J. (1987) Short-term memory, exploration and locomotor activity in aged rats. Neurobiology of aging, 8(5): 393-402. 10 )Conley, K. E., Jubrias, S. A., & Esselman, P. C.
(2000) Oxidative capacity and ageing in human muscle. The Journal of physiology, 526(1): 203-210.
11 )Short, K. R., Bigelow, M. L., Kahl, J., Singh, R., Coenen-Schimke, J., Raghavakaimal, S., & Nair, K. S. (2005) Decline in skeletal muscle mitochondrial function with aging in humans. Proceedings of the National Academy of Sciences, 102(15): 5618-5623.
12 )Esterbauer, H., Oberkofler, H., Krempler, F., & Patsch, W. (1999) Human peroxisome proliferator activated receptor gamma coactivator 1 (PPARGC1) gene: cDNA sequence, genomic organization, chromosomal localization, and tissue expression. Genomics, 62(1): 98-102.
91 13 )Kang, C., Chung, E., Diffee, G., & Ji, L. L. (2013)
Exercise training attenuates aging-associated mitochondrial dysfunction in rat skeletal muscle: role of PGC-1 α . Experimental gerontology, 48(11): 1343-1350.
14 )Anderson, R., & Prolla, T. (2009) PGC-1 α in aging and anti-aging interventions. Biochimica et Biophysica Acta (BBA)-General Subjects, 1790(10): 1059-1066.
15 )Honma, T., Yanaka, M., Tsuduki, T., & Ikeda, I. (2011) Increased lipid accumulation in liver and white adipose tissue in aging in the SAMP10 mouse. Journal of nutritional science and vitaminology, 57(2): 123-129.
16 )Bodine, S. C., Latres, E., Baumhueter, S., Lai, V. K. M., Nunez, L., Clarke, B. A., ... & Pan, Z. Q. (2001) Identification of ubiquitin ligases required for skeletal muscle atrophy. Science, 294(5547): 1704-1708.
17 )Sacheck, J. M., Ohtsuka, A., McLary, S. C., & Goldberg, A. L. (2004) IGF-I stimulates muscle growth by suppressing protein breakdown and expression of atrophy-related ubiquitin ligases, atrogin-1 and MuRF1. American Journal of Physiology-Endocrinology and Metabolism, 287(4): E591-E601.
18 )Sandri, M., Sandri, C., Gilbert, A., Skurk, C., Calabria, E., & Goldberg, A. L. (2004) Foxo transcription factors induce the atrophy-related ubiquitin ligase atrogin-1 and cause skeletal muscle atrophy. Cell, 117(3): 399-412.
19 )Mangum, J. E., Hardee, J. P., Fix, D. K., Puppa, M. J., Elkes, J., & Lidov, H. G. (2016) Pseudouridine synthase 1 deficient mice, a model for Mitochondrial Myopathy with Sideroblastic Anemia, exhibit muscle morphology and physiology alterations. Scientific reports, 6: 26202. 20 )White, J. P., Baltgalvis, K. A., Puppa, M. J., Sato,
S., Baynes, J. W., & Carson, J. A. (2011) Muscle oxidative capacity during IL-6-dependent cancer cachexia. American Journal of Physiology-Regulatory, Integrative and Comparative Physiology, 300(2): R201-R211.
21 )Lapchak, P. A., Miller, P. J., & Jiao, S. (1997)
Glial cell line-derived neurotrophic factor induces the dopaminergic and cholinergic phenotype and increases locomotor activity in aged Fischer 344 rats. Neuroscience, 77(3): 745-752.
22 )Rooyackers, O. E., Adey, D. B., Ades, P. A., & Nair, K. S. (1996) Effect of age on in vivo rates of mitochondrial protein synthesis in human skeletal muscle. Proceedings of the National Academy of Sciences, 93(26): 15364-15369.
23 )Balagopal, P., Rooyackers, O. E., Adey, D. B., Ades, P. A., & Nair, K. S. (1997) Effects of aging on in vivo synthesis of skeletal muscle myosin heavy-chain and sarcoplasmic protein in humans. American Journal of Physiology-Endocrinology And Metabolism, 273(4): E790-E800.
24 )Short, K. R., & Nair, K. S. (1999) Mechanisms of sarcopenia of aging. Journal of endocrinological investigation, 22: 95-105.
25 )Mensink, M., Hesselink, M. K. C., Russell, A. P., Schaart, G., Sels, J. P., & Schrauwen, P. (2007) Improved skeletal muscle oxidative enzyme activity and restoration of PGC-1 α and PPAR β / δ gene expression upon rosiglitazone treatment in obese patients with type 2 diabetes mellitus. International journal of obesity, 31(8): 1302-1310.
26 )Ermini, M., Szelenyi, I., Moser, P., & Verzar, F. (1971) The ageing of skeletal (striated) muscle by changes of recovery metabolism. Gerontology, 17(5-6): 300-311.
27 )Schiaffino, S., Gorza, L., Sartore, S., Saggin, L., Ausoni, S., & LØmo, T. (1989) Three myosin heavy chain isoforms in type 2 skeletal muscle fibres. Journal of Muscle Research & Cell Motility, 10(3): 197-205.
28 )Sullivan, V. K., Powers, S. K., Criswell, D. S., Tumer, N. I. H. A. L., Larochelle, J. S., & Lowenthal, D. A. V. I. D. (1995) Myosin heavy chain composition in young and old rat skeletal muscle: effects of endurance exercise. Journal of Applied Physiology, 78(6): 2115-2120.
29 )Finck, B. N., & Kelly, D. P. (2006) PGC-1 coactivators: inducible regulators of energy metabolism in health and disease. The Journal of
92
clinical investigation, 116(3): 615-622.
30 )Handschin, C., & Spiegelman, B. M. (2006) Peroxisome proliferator-activated receptor γ coactivator 1 coactivators, energy homeostasis, and metabolism. Endocrine reviews, 27(7): 728-735. 31 )Lin, J., Wu, H., Tarr, P. T., Zhang, C. Y., Wu,
Z., & Lowell, B. B. (2002) Transcriptional co-activator PGC-1 α drives the formation of slow-twitch muscle fibres. Nature, 418(6899): 797-801. 32 )Yoon, J. C., Puigserver, P., Chen, G., Donovan,
J., Wu, Z., & Newgard, C. B. (2001) Control of hepatic gluconeogenesis through the transcriptional coactivator PGC-1. Nature, 413(6852): 131-138.
33 )Dillon, L. M., Rebelo, A. P., & Moraes, C. T. (2012) The role of PGC ‐ 1 coactivators in aging skeletal muscle and heart. IUBMB life, 64(3): 231-241.
34 )Cai, J., Yang, J., & Jones, D. (1998) Mitochondrial control of apoptosis: the role of cytochrome c. Biochimica et Biophysica Acta (BBA)-Bioenergetics, 1366(1-2): 139-149.
35 )Cooper, M. P., Uldry, M., Kajimura, S., Arany, Z., & Spiegelman, B. M. (2008) Modulation of PGC-1 coactivator pathways in brown fat differentiation through LRP130. Journal of biological Chemistry, 283(46): 31960-31967.
36 )Gumucio, J. P., & Mendias, C. L. (2013) Atrogin-1, MuRF-1, and sarcopenia. Endocrine, 43(1): 12-21.
37 )Bonadonna, R. C., Groop, L. C., Simonson, D. C., & DeFronzo, R. A. (1994) Free fatty acid and glucose metabolism in human aging: evidence for operation of the Randle cycle. American Journal of Physiology-Endocrinology And Metabolism, 266(3): E501-E509.
38 )Alessio, H. (2001) Physiology of human aging. Morgan L, Kunkel S. Aging: The Social Context. 2nd ed. California: Pine Forge: 107-137.
39 )LACKO, A. G., & DAVIS, J. L. (1979) Age ‐ Related Changes in Rat and Primate Plasma Cholesterol Metabolism. Journal of the American Geriatrics Society, 27(5): 212-217.