論文
Pd-Pt合金による水素吸収曲線の解析
金 瑩, 原 正憲, 渡辺国昭 富山大学水素同位体科学研究センター
〒930-8555 富山市五福3190
Analysis of Hydrogen Absorption Kinetics for Pd-Pt Alloys
Y. Jin, M. Hara, K. Watanabe Hydrogen Isotope Res. Centr.,
Toyama Univ., Gofuku 3190, Toyama 930-8555, Japan (Received February 9, 2001; Accepted March 15, 2002)
ABSTRACT
Hydrogen absorption kinetics of palladium alloys was studied by using a vacuum microbalance system. The data analysis procedures were shown in detail in the present paper for a spherical sample as an example, where the second order hydrogen adsorption and desorption were assumed to have occurred on the sample surface. The factors that may influence hydrogen absorption curves and kinetic parameters are discussed.
1. Introduction
Hydrogen absorption by palladium has long been the topics of a number of investigations, and sophisticated studies can be found in literature published as early as 1930s. The thermodynamic data are well described by statistical thermodynamics and quantum mechanics [1,2]. In contrast with the well-defined thermodynamic features, however, kinetic results from different researchers with different experimental procedures showed little agreement [3~5]. This can be attributed to sensitive nature of kinetic processes on working conditions, because such conditions have been proven to include a number of factors difficult to control. This is also a consequence of complex reaction mechanisms comprising adsorption and desorption on the surface, the transport of absorbed hydrogen atoms between the surface and the bulk layer just beneath the surface, and hydrogen diffusion into/from the bulk.
To avoid the complexity, very thin films (below 3000Å) with clean surfaces were used as specimen for studying the reaction kinetics and mechanisms [3,4,6]. Recent efforts on Pd-H interaction studies have mostly devoted to the surface physics on well-defined surfaces of only several layers thickness. Such studies are surely prospective in obtaining information about the subtle surface processes and diffusion in the bulk, revealing the reaction mechanism, and specifying the rate controlling step in order to predict the dependence of the reaction rate on the key parameters such as temperature, hydrogen pressure, and surface and bulk conditions of the metal as well as its hydrogenization history.
They are, however, still far from being able to provide significant help for prediction of the macroscopic kinetic features for technological applications, because Pd and its alloys are mostly used in the form of powder with partly poisoned surfaces. In the case of gas chromatography for hydrogen isotope separation, for example, the absorption and desorption take place through contaminated powder surfaces in a flow of carrier gas. To describe the separation efficiency, one has to know the absorption and desorption kinetics of hydrogen isotopes under such operation conditions.
The purpose of our effort is to undertake an investigation on the hydrogen absorbing behavior of Pd-Pt alloys, especially those in the form of powder, and to find a set of kinetic parameters describing the absorption and desorption kinetics of hydrogen isotopes for Pd and its alloys in forming α-phase solution. The absorption of hydrogen isotopes was measured by using a vacuum microbalance in the range of temperature from 0 to 80℃ and of hydrogen pressure from 0.1 to 10 Torr. The specimens were filings of alloy ingots below 200 meshes. Details of experimental procedures and principal results were described in a separate paper [7]. The present paper focuses an attention to data analysis and factors requiring special cautions for the analysis.
2. Simulation principle and procedures 2.1 Bulk region 1<i<imax
The specimen powder was assumed spherical. The sample sphere was separated into imax layers along the radius direction with dx, the thickness of each layer. Inside each layer, the hydrogen concentration was supposed to be uniform. The surface corresponds to the imax-th layer (Fig.1).
The diffusion in the bulk was described by the Fick’s second law as
2 ) ( 2
2
x c x x
D c t c
∂ + ∂
∂
= ∂
∂
∂ (1)
or
2 2
X u T
u
∂
= ∂
∂
∂ (2)
where c is the hydrogen concentration in atomic fraction [H/M], x the distance from the center [cm], a the radius of sphere [cm], D the diffucion constant [cm2/sec], t the time [sec], X=x/a, u=cx=caX and T=Dt/a2. Similar to the derivation of plane samples [8], the above equation can be written in difference scheme as
Fig.1. The schematic diagram of simulation model.
c
Surface layer, i=imax
c0
dx
c1
cimax
a
Surface i=imax+1
j i j i j
i j
i j
i j
i r u ru ru r u ru
ru−1, +1+(2+2 ) , +1− +1, +1= −1, +(2−2 ) , + +1,
− (3)
where, r=dT/(dX)2 and the total error is O[dT+(dX)2]. In order to solve Eq.3, two boundary conditions should be defined, which are explicated separately in the following sections, along with
the initial condition that the hydrogen concentration is zero throughout the specimen.
2.2 Surface, i=imax
Similar to Ali-Khan’s approach [9], which has already been widely accepted in analyzing hydrogen permeation through membrane, hydrogen transport between the surface and the bulk just beneath the surface was ignored in the present analysis. Namely the surface concentration is described by the hydrogen concentration in the outermost bulk layer, which is assumed to be in a local equilibrium with the surface concentration. Accordingly, the absorption and desorption rates are described by a pseudo rate constants.
The flux of hydrogen flowing through the sample surface at any moment can be presented by the Fick’s first law. In the case of the second order adsorption and desorption, it is given by
2 1 2
*
1p(c c) k c x k
D c = − − r
∂
− ∂ [cm·s-1] (4) where p is the partial pressure of hydrogen. The pseudo rate constants k1 and k1r are in [cm· Torr-1s-1] and [cm·s-1], respectively. c* and c (all in [atomic fraction of H to Pd]) are the concentrations of total available active sites for hydrogen adsorption and those sites already occupied by H atoms in the surface layer, respectively, and the former was assumed to be 1.0.
This equation can be described in a difference form as
] )
1 (
[ 1 max, 2 1 max, 2
max, ,
1
max j i j i j r i j
i k p c k c
D c dx
c + = + − − (5)
The concentration c was converted into u (c=u/x) for sphere model, where ci was defined as the hydrogen concentration in i-th layer, which is given by the average concentration at (i-1/2)dx as shown in Fig.1, thus cimax=uimax/(a-dx/2), cimax+1=uimax+1/(a+dx/2). Non-dimensionalization of the space coordinate by x=aX gives
[ ]
{
(1 /2)}
) 2 / 1 (
) 2 / 1 ( 2
/ 1
2 /
1 2
max, 1 2 max, 2 1
max, ,
1
max j i j i j r i j
i k pa dX u k u
dX D
dX u dX
dX
u dX − − −
− + +
−
= +
+ (6)
Similarly, on account of the relationship between uimax+1,j+1 and uimax,j+1 for time (j+1), the non-dimensional equation for the surface is described as
[ ] [ ]
{ }
) ) (
2 / 1 (
) 2 / 1 ) (
2 / 2 1
(
) 2 / 1 ( )
2 / 1 (
) 2 / 1 (
) 2 / 1 ) (
( 2)
/ 2 1
(
2 max, 2
1 max, 2 1
max,
2 max, 2
1 max, 1
, 2 1 max 1
, 1 max 1
max,
j i j i r j
i
j i j
i
j i j i j
i
u u
dX k D
dX dX
u r dX r rdX
u dX
a u
dX a p k
dX D
dX dX
u r u
r dX u
r rdX
+
− ⋅
− + + −
−
=
−
− +
−
−
− ⋅
− + +
− −
− +
+ +
− +
− +
(7)
2.3 Center, i=1
At center of the sample, the boundary condition is written in terms of symmetric property as
j
j c
c1, = 0, (8) at any time, j. Therefore,
2 / 2
/
, 0 ,
1
adX u adX
u j j
= −
,
∴ u0,j =−u1,j
(9) This relation is valid irrespective of sample shapes (spherical, cylindrical or plane). Substitution of the above equation and a similar equation for the time, j+1, into the difference equation of the second law (Eq.3) at i=1 leads to the non-dimensional boundary condition at the center as
j j
j
j r u u r u
u
r) 1, 1 ( 2, 2, 1) (2 3 ) 1, 3
2
( + + = + + + −
(10)
3. Analysis of experimental curves
During an experimental run, the weight gain of the sample was recorded with a given sampling frequency by microbalance controller. Then one can obtain a weight gain vs time curve by exposing the sample to hydrogen atmosphere. The weight gains of the sample were converted to hydrogen atom concentrations in atomic fraction to metal atoms.
If the used sample is extremely thin or small so that the sample is only made from a monolayer of atoms with a thickness equal to λ, the hydrogen adsorption rate observed in experiment can be described as Eq.11,
2 1 2 1p(1 c) k c t k
c
− r
−
∂ =
λ∂ [cm·s-1] (11) However, for a sample with finite size, the obtainable experimental data from microbalance is the averaged weight gain of the whole metal sample through hydrogen absorption, i.e., the average hydrogen concentration (the atomic fraction to metal atom) and not the surface information. This is especially important to analyze the very initial stage of absorption, because hydrogen should be absorbed only in the surface region of the sample. Then some correction is required for applying the surface boundary condition. The correction adopted here was based on a geometrical consideration.
Accordingly the surface boundary condition was expressed by using the apparent hydrogen concentration as
0 →0
→ ∂
⋅ ∂
∂ =
∂
t t app
t c V
A t
c λ [s-1] (12)
where A and V are the surface area and the volume of the sample, respectively. The apparent hydrogen ab/desorption rate constants, kapp ([Torr-1s-1]) and kapp,r ([s-1]), could be directly determined from experimental results by Eq.13 and 14 as described elsewhere [7].
p t k
c
app t
app =
∂
∂
→0
(13)
) (
/ 2 *
, k p c c c
kappr = app e e << (14) where ce is the equilibrium hydrogen concentration. From Eq.12~14, it is clear that the relation between apparent rate constants and real rate constants are
r app r
app k
A k V Ak
k1=V , 1 = , (15) These relations do not refer to the sample shape (Eq.11~15) and can be applied to any shape of samples. The values of V/A are a/3, a/2, a for spherical, cylindrical and plane samples, respectively, where a is the radius of sphere, half thickness of the wire or the foil samples, respectively. The non-dimensionalized difference schemes for the boundary conditions of plane and cylindrical samples are omitted in this paper. One can refer to Crank's book for diffusion equations in bulk [8].
Data analyses were carried out as follows. First, the apparent hydrogen ab/desorption rate constants were estimated from the initial hydrogen adsorption rate and the equilibrium state (Eq.13, 14) of an experimental curve. Hydrogen absorption measurements were carried out at several different hydrogen pressures under each temperature to determine reliable apparent hydrogen ab/desorption rate constants. Subsequently, the hydrogen ab/desorption rate constants used in simulation (k1, k1r) were calculated through Eq.15, adoptingV/A=a/3 for spherical particles. During simulation, the hydrogen ab/desorption rate constants were regulated in small extent to reproduce the experimental result better. Accordingly, the above boundary conditions, Eq.7 and Eq.10, can be solved together with the equations from Eq.3 (2≤i≤imax-1) as coupled equations, in which the diffusion coefficient of hydrogen inside the bulk was treated as a fitting parameter to reproduce the experimental results.
The original computation outputs are described in u-T-X space. Then, u, T and X were converted back to hydrogen concentration in atomic fraction, real time and real distance, respectively, to obtain the results in c-t-x space, showing the time dependence of hydrogen concentration distribution in the sample. The average H-concentration of the sample at j moment is ∑ , where v
= max
1 ,
i
i vici j i is the volume proportion of mesh i in the space coordinate.
0 200 400 600 800 1000
0 0.001 0.002 0.003 0.004 0.005 0.006
Fig.2. Time-course of protium uptake under different hydrogen partial pressures at 312K by Pd-4%Pt (points) and the corresponding computer simulation (lines). kapp, kapp,r and D are valued to be 5.75×10⁻⁶ [Torr-1s-1], 1.36 [s-1] and 4.6×10⁻⁹ [cm2s-1], respectively.
Time /s
Atomic fractionc ([H]/[M])
1Torr 5Torr 2Torr 10Torr
Figure 2 is an example of the simulations (lines) with kapp, kapp,r and D equaling to 5.75×10⁻⁶ [Torr-1s-1], 1.36 [s-1] and 4.6×10⁻⁹ [cm2s-1], respectively, together with the corresponding experimental curves (points) of protium uptake under different pressures at 312K by Pd-4%Pt. It shows that the present hydrogen absorption model and simulation could describe well the hydrogen absorption process and determine the hydrogen ab/desorption rate constants and diffusion coefficient as well as their activation energies by examining the temperature dependences.
4. Factors requiring cautions
Under a certain experimental condition, hydrogen absorption by a sample might be controlled by surface ab/desorption processes, while hydrogen transfer in the bulk is fast enough to keep hydrogen concentration at the center the same as that on the surface at any moment. Under some other conditions, hydrogen absorption is controlled by both surface and bulk processes. In the third case, mass transfer in the bulk is the rate-limiting step of hydrogen absorption, i.e., the surface concentration of hydrogen reaches an equilibrium value instantaneously. In the first case, no exact information on the diffusion can be obtained. The absorption process is relatively easy to be understood, and the apparent hydrogen ab/desorption rate constants and the corresponding activation energies can be estimated. In the second case, the diffusion coefficient of hydrogen atom in the sample could be evaluated by the simulation presented in this paper. In the third case, one will find that the hydrogen absorption curve is not sensitive to the surface ab/desorption rate constants;
instead the diffusion coefficient of hydrogen in the metal can be well defined.
Besides the above situations, there exist some factors that should be avoided in experiments and simulation or be kept in mind when comparing the kinetic data from different researchers and experimental conditions. These factors are 1) inadequate selection of geometrical factor, 2) too small imax and jmax value for sectioning, 3) surface contamination, 4) too slow hydrogen diffusion in gas phase, 5) insufficient system sensitivity of detecting absorption rate and amount. All of these factors can lead to deviation or error in the estimated diffusion coefficients, hydrogen ab/desorption rate constants or even misunderstanding the mechanism. In the following sections, the effects of geometrical factors and surface contamination are discussed respectively.
4.1 Geometrical factors 1.) Sample shape
The apparent rate constants are given as
r r
app
app k
V k A
V k
k = A 1, , = 1
(16) where the real rate constants k1 and k1r are independent of sample geometrical feature. While, it is noted from the above equation that the apparent rate constants are proportional to the
surface/volume ratio of the sample. As mentioned above, the apparent hydrogen ad/desorption rate constants are 3/a, 2/a and 1/a times of real rate constants for spherical, cylindrical and flat sample, respectively. Then there will be 50%
deviation at most for evaluating the rate constants if experimental data are analyzed by assuming sphere for the sample powder consisting of cylinder-like particles. Figure 3 shows the simulations of time dependences of hydrogen absorption reacted fraction by spherical, cylindrical and plane samples with a all equal to 0.005cm, in which k1 and k1r are valued to be 7.18×10⁻⁸ [cm·Torr-1s-1] and 3.68×10⁻³ [cm·s-1], respectively, where the hydrogen absorptions are limited by surface reactions.
0 100 200 300 400 500
0 0.2 0.4 0.6 0.8
Reacted fraction C / Ce
1
1__spherical sample 2__cylindrical sample 3__plane sample 3
2 1
Fig.3. Hydrogen absorption simulations of spherical, cylindrical and plane samples with a values all equal to 0.005cm, in which k1 and k1r are valued to be 7.18×10⁻⁸ [cm·Torr-1s-1] and 3.68×10⁻³ [cm·s-1], respectively.
Time /s
2.) Particle size distribution
For samples in different size, one may observe quite different hydrogen absorption curves. The difference is not only caused by different apparent hydrogen ab/desorption rate constants predicted by Eq.16, but also by the change in the rate-limiting step with sample size.
The effect of different average sample size is easy to be noticed. However, concerning the particle sample, there exist some particles apart from average size. Thus the possible differences among hydrogen absorptions will be discussed for the samples with different size distributions.
0 100 200 300 400 500
0 0.2 0.4 0.6 0.8 1
Fig.5. Hydrogen absorption simulations of the samples with the size distributions shown in Fig.4, in which k1 and k1r are valued to be 7.18×10⁻⁸ [cm·
Torr-1s-1] and 3.68×10⁻³ [cm·s-1], respectively.
Time /s
3 4 1 2
0.000 0.002 0.004 0.006 0.008 0.010
0 100 200 300 400 500 600 3000 4000
0.0001 0.0008 0.0018 0.005
Count Distribution
Radius of the particles / cm
Reacted fraction c/ce
1 2 3 4
Fig.4. Four normal distributions N(μ, σ2) of particle size with same average value and different scatter coefficients. μ=0.005cm and σ=0.0001, 0.0008, 0.0018 and 0.005 as shown in the graph, respectively.
The curves in Fig.4 indicated four different particle size distributions with exactly the same average particle size, and all the four cases show normal distributions in size with different standard deviations. Simulations of the time dependences of hydrogen absorption reacted fraction by these samples of a given amount were instructed in Fig.5, in which k1 and k1r are also valued to be 7.18×10⁻⁸ [cm·Torr-1s-1] and 3.68×10⁻³ [cm·s-1], respectively, where the hydrogen absorptions are all limited by surface reactions. It is seen that the sample with the most uniform particle size shows the highest apparent hydrogen absorption rate constant than those samples with rather scattered distributions. In this present example, the highest apparent absorption rate is because of the largest specific geometrical surface area of sample 1. However, for diffusion controlled hydrogen absorption, the hydrogen diffusion inside the particles with different size causes the different apparent hydrogen absorption rates.
It should be noted, however, that as for the temperature dependence of the apparent rate constants the geometrical factors thus considered only affect the pre-exponential factors and the activation energies do not depend on the geometrical factors being inconsistent with the real shape and size distribution of samples.
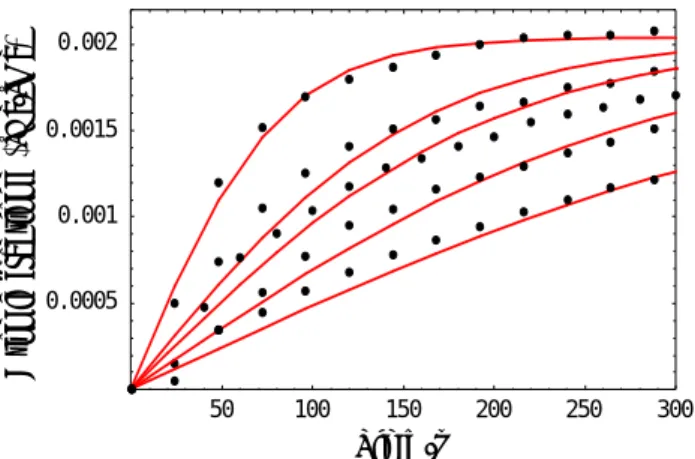
4.2 Surface poisoning
Besides the above problems, the same sample can change its apparent rate constants because of the reduction in surface cleanness during a series of experiments. In some cases, the absorption becomes to be totally limited by the surface reactions. Among the influencing factors discussed in the present paper, the cleanness factor f (i.e., the surface coverage of active sites) is the one the most difficult factor to be controlled in kinetic studies.
50 100 150 200 250 300
0.0005 0.001 0.0015 0.002
Fig.6. Experimental and simulation results of hydrogen absorption by Pd-8%Pt alloy at 293K, 1Torr H2. Points are experimental results and lines are simulations.
Diffusion is fast enough to keep the uniform H concentration inside the alloy particle. k1 and k1r are valued to be 3.25×10⁻⁸ [cm·Torr-1s-1] and 7.78×10⁻³ [cm·s-1], respectively. The ratio of f between the five cases are determined to be 1.0:0.50:0.40:0.28:0.19 from upside down.
Atomic fraction c ([H]/[M])
Time /s
Figure 6 shows an example of this problem observed for hydrogen absorption by Pd-8at%Pt alloy exposed in 1 Torr H2 at 293K. In the series of experiments, the absorption rate decreased step by step by repeating the measurements with the same sample. Since no particular surface cleaning treatment was executed between the experimental runs, the reduction in the absorption rate can be attributed to surface poisoning by impurities in the residual gas of the vacuum system and/or in the used H2-Ar mixture gas. It was found that the hydrogen absorption was controlled by surface reactions in all the cases, and the ratio among the apparent rate constants were 1.0, 0.50, 0.40,
0.28, 0.19 for the absorption curves from the top to the bottom. Data at different temperatures gave no clear straight lines for them, indicating both the pre-exponential factor and the activation energy cannot be obtained from the samples with varying cleanliness factor in a series of experiments; one can predict no absorption curves under any experimental conditions in this case.
5. Conclusions
Analyses of hydrogen absorption curves were described in detail as well as discussion of the possible influences such as geometrical factors and surface conditions of the sample that may cause deviation in evaluating hydrogen ab/desorption rate constants and activation energies. By using a sample with well-defined shape (plane, cylindrical or spherical), one can estimate the hydrogen ab/desorption rate constants, diffusion coefficient of hydrogen in the sample and their corresponding activation energies. As for the isotope effect on the absorption, one can obtain the reliable parameters in terms of rate constant and diffusion coefficient ratios at given temperature under given experimental conditions.
Acknowledgements
This work was partly supported by a Grand-in-Aid for Scientific Research from the Ministry of Education, Science and Culture of Japan.
References
[1] H. Noh, T. B. Flanagan, T. Sonoda and Y. Sakamoto, J. Alloys and Compounds, 228 (1995) 164.
[2] T. Yasumatsu, J.L. Wan, M Matsuyama, K. Watanabe, J. Alloys and Comp., 293/295 (1999) 900.
[3] R.V. Bucur, V. Mecea, T.B. Flanagan, Surface Science, 54 (1976) 477.
[4] R.V. Bucur, V. Mecea, Surface Technology, 11 (1980) 305.
[5] W. Auer, H.J.Grabke, Ber. Bunsenges. Physik. Chem., 75 (1971) 1130; 78 (1974) 58.
[6] Y. Li, Y. Ts. Cheng, Int. J. Hydrogen Energy, 21/4 (1996) 281.
[7] J.L. Wan, M. Hara, Y. Jin, K. Watanabe, Ann. Rept. HRC, 19 (1999) 9.
[8] J. Crank, The Mathematics of Diffusion (Sec. Ed.), Oxford University Press, 1975.
[9] I. Ali-Khan, K. J. Dietz, F. G. Waelbroeck, P. Wienhold, J. Nucl. Mater., 76-77(1978) 337.