The Effectiveness of Export, FDI and R&D on Total Factor Productivity Growth : The Cases of Taiwan and Korea
著者 Hwang Insang, Wang Eric C.
出版者 Institute of Comparative Economic Studies, Hosei University
journal or
publication title
Journal of International Economic Studies
volume 26
page range 93‑108
year 2012‑03
URL http://doi.org/10.15002/00007942
The Effectiveness of Export, FDI and R&D on Total Factor Productivity Growth:
The Cases of Taiwan and Korea
Insang Hwang and Eric C. Wang
*Abstract
The objective of this study is to examine the relationship between total factor productivity (TFP) growth and other variables such as openness to trade, FDI and R&D using segregated manufacturing industries data from Taiwan and Korea. The extreme bound analysis (EBA) is employed to investigate the robustness of the variables. Our empirical findings do not support the common belief of a positive and significant relationship between openness to trade and TFP growth. In addition, neither growth of FDI nor R&D shows a positive effect on TFP growth. However, our empirical results indicate that output growth has a robust and positive relationship with TFP growth for both countries.
Keywords: Export driven growth, FDI, R&D, TFP growth, Extreme bound analysis, Taiwanese manufactur- ing, Korean manufacturing
JEL Classification: F43; O13; O47; L60
1. Introduction
Studies on the source of technological growth have been, for many years, a challenge for economists, even though there is no doubt that technological progress is a crucial cause of long- term growth. Solow’s (1956) neoclassical growth model of technological growth argues that an economy without technological growth cannot sustain its growth over the population growth rate.
Solow (1956) used total factor productivity (hereafter TFP) as a measure of technology in his growth accounting method.1 Since then, TFP growth has been commonly employed as a measure of technological growth. Recent endogenous growth theories have argued that openness to trade, FDI, human capital accumulation, and R&D efforts could have a significant impact on TFP growth [Romer (1986), Lucas (1988), and Grossman and Helpman (1991)]. In particular, openness to trade and FDI inflow should induce improvement in TFP growth, as they tend to enhance competi- tiveness, enlarge production scales, bring in new technology, and lower the costs of production.
Successful economic growth in turn promotes further export expansion and import liberalization as well as FDI inflow. This kind of economic interaction will be termed the “virtuous cycle of trade and growth.”
* Insang Hwang (corresponding author), Economics and Business Department, International Christian University, 3-10-2, Mitaka, Tokyo, Japan: (e-mail) [email protected]. Eric C. Wang, Department of Economics, National Chung Cheng University, Chia-yi 621, Taiwan, ROC. We would like to thank helpful comments from a referee. We also thank John Maher and Tony Iaquinto for their kind comments. Any remaining errors are entirely our owns.
1Growth accounting method is a residual calculation between output growth and input growth
Many studies have been devoted to examining the relationship between openness to trade, FDI, and TFP growth. Feder (1983) proposed a theoretical two-sector model in which the export sector is not only more productive than the non-export sector but also generates some positive external effects; which in turn enhance the productivity of the non-export sector. As exports expand, increases in resources reallocation and production externality lead to an overall productiv- ity increase. The World Bank (1993) endorsed this view by arguing that the active promotion of manufactured exports showed a remarkable growth among High Performance Asian Economies (hereafter HPAEs). Kavoussi (1984), using a sample of 73 countries during 1960-1978, found that in both low- and middle-income countries, export expansion was strongly related with better eco- nomic performance and that a crucial cause of this relationship was the positive impact of exports on TFP. Nishimizu and Robinson (1984) also reported the existence of an important link between trade regimes and industrial productivity growth by using two-digit industry-level data in four countries: Japan, Korea, Turkey, and Yugoslavia. Dollar and Sokoloff (1990) studied South Korean manufacturing industries and found that there was a positive relationship between growth rates of TFP and export, but causality was not clear.
Using seven measures of openness, Harrison (1996) applied the Extreme Bound Analysis (EBA) approach to panel data of a large number of LDCs (i.e., Less Developing Countries). A positive relationship between GDP growth and openness to trade was found. Hwang (2010) study- ing the sources of technological progress of Korean aggregate manufacturing found that growth in trade variables had a robust relationship with technological progress. Edwards (1998), using panel data from 93 countries during 1960-90 and employing various measures of openness, found robust positive results of openness to trade on TFP growth. Hejazi and Safarian (1999) investigated the role of trade and FDI as a diffusion channel of technology from G6 to other OECD countries.
Their main findings indicate that the coefficient estimates for FDI were higher than those for trade in a standard model; the importance of trade was much reduced when FDI was considered. In a study of APEC countries over the period of 1980 to 1987, Wu (2000) decomposed the TFP growth into technological progress (TP), technical efficiency (TE), and scale efficiency (SE). Using national data, he found that openness to trade had a positive impact on both TP and TE. Miller and Upadhyay (2000) also employed pooled time-series and cross-section data to investigate important links between trade orientation and TFP growth. They found that higher openness benefited TFP growth. In addition to the studies using aggregate or industrial data, recent researches began to use firm/plant level data: Au, Chung, and Roberts (1998) using the data of Taiwan and South Korean exporting firms; Bernard and Jensen (1999)’s study of U.S. manufacturing plants; and a study by Hay (2001) using Brazilian firms. Most of these researches concluded that the link between trade openness and production efficiency was significant.
Despite these positive results, there is also a significant amount of work which shows a negative or inconclusive relationship between openness to trade, FDI, and TFP growth. Author like Rodrik (1995) were skeptical of the trade liberalization-TFP growth nexus. Rodriguez and Rodrik (1999) considered that the empirical studies did not provide convincing evidence and fur- ther argued that the effect of openness on growth is, at best, very tenuous, and at worst, doubtful.
Using EBA, Levine and Renelt (1992) found that almost all macroeconomic variables were fragile in relation to per capita output growth. The only exception was investment share. Chen and Tang (1990), using the TFP of Taiwan’s manufacturing industries, indicated that although the scale economies were a reliable factor in explaining the productivity growth for majority of industries, the export expansion had an ambiguous effect on productivity. Similar conclusions are reached by Wang (1995) who examined Taiwan’s manufacturing industries. In a study conducted by the Institute of Developing Economies (IDE) in Japan, Urata (1994) found that the impact of trade
liberalization on TFP growth turned out to be positive for five Asian countries: Korea, Thailand, Malaysia, Indonesia, and the Philippines, but the relationships were not always stable or statistically significant. Contrarily, trade liberalization was shown to have a negative influence on TFP growth for Taiwan. Okuda (1994) examined the relationship between TFP and trade policies of Taiwan’s manufacturing industry. Regressions with pooled time-series and cross-industry data found that (1) it is hard to identify a uniform statistical relationship between export ratio and the TFP; (2) an increase in the export ratio tends to improve sector productivity only if a sector becomes very capital-intensive or import competitive; and (3) progress in horizontal international specialization could improve sector TFP. Kim (2000) performed a test on 36 Korean manufactur- ing industries and found that while scale efficiency was prominent, the positive impact of trade lib- eralization on productivity was insignificant. Oczkowski and Sharma (2001) also reached the conclusion that no significant relationship existed between trade reform and TFP growth within seven Australian manufacturing industries. Hwang and Wang (2004) used 35 sectors of Japanese manufacturing data and investigated the robustness of trade variable for TFP growth by using EBA. They did not find any relationships between TFP growth and a number of trade variables.
Among the many growth empirics investigating the relationship between trade growth and economic growth, most empirical literature using cross-country data tend to show a significant and positive relationship between trade expansion and TFP growth. However, there are, at least, two shortcomings in using cross-country data. First, the use of cross-country data makes it impossible to control for unobserved country-specific differences, possibly biasing the results. Second, long run average or initial values for trade policy variables ignore important regime changes which may have occurred within a country. In this paper, we use the single time-series data from manufacturing industries of two countries: Taiwan and Korea. Taiwan and Korea are highly suc- cessful economies, and they share many common economic characteristics. Their rapid economic growth has been credited to an outward looking economic policy.
Considering current literature using cross-country analyses, the different feature of this study is using time series analysis and segregated data of manufacturing industries of Taiwan and Korea.
When we analyze segregated manufacturing industries of a country not aggregated economy, we can expect to get more precise policy implications from our empirical findings which can explain the microeconomic sources of economic growth. Therefore, the main contribution of this study is to examine various manufacturing industries in Taiwan and Korea and test the robustness of trade expansion, FDI, and R&D on the TFP growth of Taiwan and Korea. Our empirical findings from various manufacturing industries from two countries will provide us with more precise evaluation on the role of openness to trade for economic growth. We follow a two-stage method by first estimating the TFP growth of each industries and then performing a sensitivity test. We apply a variant of Leamer’s regression technique of using Extreme Bounds Analysis (EBA) to examine the effectiveness of export, FDI, and R&D on TFP growth for the cases of Taiwan and Korea. The rest of this study is constructed as follows. In the second section, we briefly review Taiwan and Korea’
s TFP growth. The third section is devoted to introducing the econometric methodology of EBA and the empirical model of TFP growth in this study. In the fourth section we present the main empirical results of TFP growth of Taiwan and Korea’s manufacturing sectors. The last section contains concluding remarks.
2. TFP Growth in Taiwan and Korea
In an official publication by DGBAS (Directorate-General of Budget, Accounting and
Statistics, 2003) regarding TFP measurement of Taiwan’s manufacturing, the translog-production model was applied for estimating TFP and factor intensities. The translog form is characterized by varied elasticity of input substitution and is subject to less constraint than other models. In case of Korean manufacturing, manufacturing data set used in Park and Kwon (1995) is employed to estimate TFP measurement.2Classification of industries between Taiwan and Korea for this study is different. Taiwan provides 22 numbers of manufacturing industries in Table 1 while 7 numbers of manufacturing are provided for Korea in Table 3. Furthermore, 7 manufacturing industries of Korea consist of different sub-sectors. The first industry appeared in Table 3 consists of Food, Beverage, and Tobacco industries. The second consists of Textiles, Wearing Apparel, and Leather.
The third consists of Paper and Products, Printing, and Publishing. The fourth is the sum of Chemical, Petroleum, Coal, Rubber, and Plastic. The fifth is composed by Non-metallic Mineral Products. The sixth consists of Basic metal. The last are Fabricated metal products and Machinery.
Table 1 shows average annual growth rates of TFP (GTFP), real production (GOP), and shares of R&D to sales (SRD) for each of the 22 manufacturing industries in Taiwan for the period of 1981-2001. GTFP for all manufacturing in Taiwan was 2.25 per annum. It can be seen that only
2The data set of Park and Kwon (1995) are using three factor-inputs (i.e., capital stock, labor, and material goods) for Korean manufacturing sectors over the period 1966-1996.
Table 1
Note: GTFP is average annual growth rate of TFP, GOP: growth rate of real production output, SRD is shares of R&D in total sales.
6 sectors showed a decline in TFP (Textile Mill Products, Wearing Apparel & other Textile Products, Leather, Fur & Related Products, Pulp and Paper Products, Printing & Kindred Products, Petroleum & Coal Products). It is also noted that there is a significant variation in TFP growth rate among the various sectors of manufacturing. Looking at the manufacturing production (GOP), we can see remarkably high growth rates with an average annual growth of 6.90%. Those industries
Table 2
with the highest growth rates are heavy and high technology industries: Electrical & Electronic Equipment (13.69% per annum), Machinery & Electrical Equipment (8.85%), and Transportation Equipment (6.69%). Table 2 reports correlation coefficients of GTFP alternatively with GOP, GRD (growth rate of R&D expenditure), GTT (growth rate of total trade), and GFDI (growth rate of FDI). GTFP has a significant positive correlation with GOP in all industries, except Chemical products and Petroleum & Coal. Surprisingly, GRD does not have a significant positive relation with GTFP, except in Paper & Pulp and Chemical products. Even more unexpectedly, the relation- ship between GTT and GTFP is not significant for most industries. Furthermore, leather & Fur, Paper & Pulp, Industrial Chemicals, and Plastic products show a negatively significant correlation coefficient. At last, GFDI does not seem to have a robust relation with GTFP except Leather &
Fur.
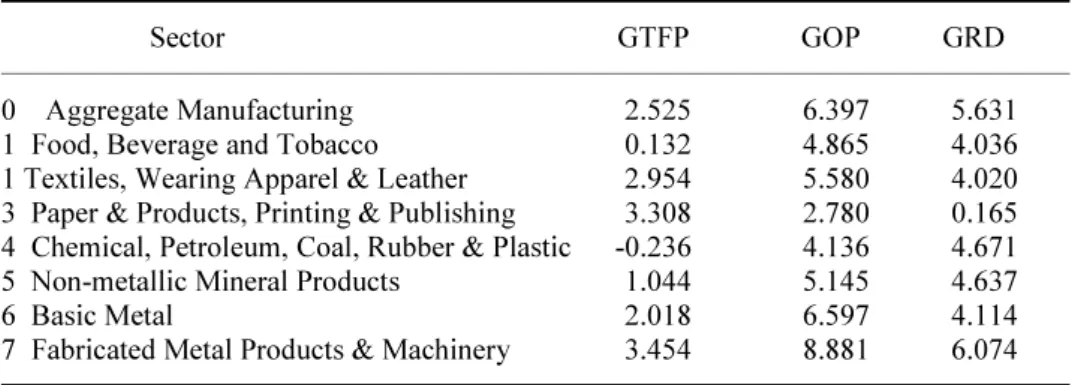
Table 3 records GTFP, GOP, and GRD of Korean’s manufacturing industries between 1967 and 1996. Table 3 explains that Korean manufacturing growth has been sustained by the sectoral growths of production and TFP. For the all manufacturing, GTFP and GOP have annual growth rates of 2.53 % and 6.40%, respectively. GTFP of Paper etc. in light industry shows 3.31% and that of Fabricated etc. in heavy industry reaches to 3.45%. Other statistics worth mentioning are the GTFP of Food, Beverage, and Tobacco, which is only 0.13, and that of Chemical, Petroleum, Coal & Rubber, which is a negative of 0.24, respectively. Growth rates of production (GOP) of all manufacturing industries are higher than those of GTFP except Paper etc. GOP of Fabricated etc.
shows the highest growth rate of 8.88%. GRD for all manufacturing is a remarkably 5.68%. We find that the average GRD for light and heavy industries in Korea exceeds 4.0%, except for Paper etc. In general, Korea’s manufacturing growth as a whole seems to be supported by TFP growths in both light and heavy industries. Compared to growth rates of Taiwan’s manufacturing, Korean manufacturing has shown a balanced growth pattern between light industry and heavy industry.
Table 4 shows the results of correlations analysis between GTFP and other growth variables of GOP, GRD, and GTT. GTFP has a significant positive correlation with GOP in all industries except Textiles, Wearing Apparel & Leather. However, there are only few significant correlations of GTFP with GRD and GTT: specifically in Textiles, Wearing Apparel & Leather; Basic Metal;
Chemical, Petroleum, Coal & Rubber; Fabricated Metal Products & Machinery. Even worse, GTT of Chemical, Petroleum, Coal & Rubber and Fabricated Metal Products & Machinery shows a negative and significant correlation with GTFP.
Table 3
Note: i) GTFP is average annual growth rate of TFP, GOP: growth rate of real production output, GRD: growth rate of real R&D expenditure.
3. TFP Growth Model and EBA Methodology
3.1. TFP Growth ModelTFP growth calculated by factor decomposition method of growth accounting is treated as a pure measure of technology improvement, assuming perfect competition, and no scale economics. In this study, the commonly used Tornqvist expression of TFP growth rate is applied and defined as:
whereYi,t , Sij, t , and Xij, t are output, the cost shares of factor, and factor input of industryiin time t, respectively. j represents three factor inputs of capital stock, labor and materials in an industry i. Taiwanese TFP Growth data are provided by DGBAS (2005). In principle, the calculation of Taiwanese and Korean TFP growth rates is following the Tornqvist rule explained in Equation (1). DGBAS (2003) provides the TFP growth rates of Taiwan’s manufacturing using the translog-production model for estimating TFP. Korean TFP growth rates were calculated by the Authors. Factor intensities represented by the cost shares of factor were applied for estimating TFP growth rates.
Equation 1 shows that real output growth can be divided into two portions. One is due to input growth and the other is due to TFP growth. Regarding to the meanings of TFP growth, there are two things to be mentioned. Firstly, this interpretation holds only in the case where long-run equilibrium is realized in production. In other words, it implies that production always takes place
Table 4
along the production efficiency frontier. However, in the short-run it is not always in equilibrium due to the presence of adjustment costs. In such cases, short-run changes in capacity utilization will give some influence on the estimated value of TFP. Inefficient management also makes it dif- ficult for a firm to carry on production along the frontier. In this respect, a rise in TFP might indicate a reduction in inefficiency together with technical progress. Second, expansion in the scale of production can lead to an improvement in efficiency. Moreover, a rise in efficiency due to scale economies also contributes to a rise in TFP. By and large, an increase in TFP should be interpreted broadly as an indication of improvement in production efficiency, reflecting not only achievement of technical progress but also reduction in managerial inefficiency and exploitation of scale economies.
Considering the above economic implications from firm’s production process, we employ a simple model of TFP growth composed by scale economies and R&D activities. The argument for scale economies emphasizes the benefits that can be derived by means of expanding the scale of operations. In the case of countries whose domestic markets are small in size, TFP can be improved through exporting, which impacts production scale. This argument was stressed by Chen and Tang (1990) and Kwon (1986) in their empirical studies on Taiwan and Korea, respectively.
Effort devoted to R&D denoted by its expenditure is considered a proxy for domestic technical progress, which explicitly contributes to TFP growth. Kim (2003) found a significant impact of R&D investment on the TFP growth in Korea’s information technology industries. Based on Kwon (1986), the theoretical model of TFP growth in this study is specified as follows:
GTFPit=b0+ b1GOPit+ b2GRDit+ uit (2) where GTFPitis the growth rate of TFP in industry i, GOPitis the growth rate of output production, and is the growth rate of R&D expenditure in the each time of t. This analysis is basically time series analysis using segregated manufacturing industry data from Taiwan and Korea. GODit and GRDit are employed in (2) to represent the scale effects and domestic technological progress, respectively. Benhabib and Spiegel (1995) used a similar model of technological progress which is a function of human capital and catch-up terms. While human capital represents the possibility of endogenous technological growth, catch-up term implies the diffusion of technology from abroad, respectively. Compared to the model of Benhabib and Spiegel (1995), our model reflects engines of growth only from domestic market, those are scale effect from output growth and technological growth from domestic R&D growth, respectively.
Our basic model of TFP growth represents a possible relationship between growths of technology, output, and R&D not that between level variables. Equation 2 will become the basic regression model of EBA for Taiwan and Korean manufacturing industries in the next chapter.
3.2. The EBA Model of TFP Growth
Existing empirical models concerning TFP growth do not completely specify what variables should be held constant, while conducting statistical inference on the connection between TFP growth and the variables of primary interest. We use a variant of the Extreme-Bound-Analysis (EBA) of Levine and Renelt (1992), which was first proposed by Leamer (1983 and 1985). Levine and Renelt (1992) using the EBA method to investigate whether there exists a robust or fragile relationship between per capita income growth and a variety of macro-variables in the changes of conditional information set. Expanding the basic TFP growth model in equation 2, the econometric specification of EBA in this study can be reformulated as follows:
GTFPit=b0+ bI Iit+ bM Mit+ bZ Zt+ uit (3) where GTFPit is the growth rate of TFP of each industry i, Iis a set of variables always included in the regression, which were specified asGOPit andGRDit in equation (2), Mis trade related variables and FDI, which are of primary interest, andZis a subset of variables chosen from a pool of macroeconomic variables, which are considered as potentially important explanatory variables. The M-variables chosen for Korea are the growth rate of export (GEX), the growth rate of import penetration ratio (GIP)3, the growth rate of the ratio of total trade (exports + imports) to production (GTT), and the growth rate of foreign direct investment (GFDI).
The core of EBA method involves varying the subset ofZ-variables included in the regression to find the widest range of coefficient estimates on the variables of interest, M, that standard hypothesis tests do not reject. We first choose a M-variable group, which has been the focus of past empirical studies, and run a basic regression that includes only the I-variables and the M- variable. We then compute the regression results for all possible linear combinations of up to three Z-variables and identify the highest and lowest values for the coefficient on the variable of interest (bm) that cannot be rejected at the 10 percent significance level. Thus, the extreme bound is defined by the group ofZ-variables that produces the maximum (minimum) value ofbmplus two standard errors. The degree of confidence that one can have in the partial correlation between GTFP and M variables can be inferred from the extreme bounds on the coefficient bm. Ifbm remains significant and the same sign within the extreme bounds, then one can maintain a fair amount of confidence in the partial correlation. In such case, the result is referred as “robust.” If the coefficient does not remain significant or change sign, one might feel less confident in the relationship between the GTFPand M. Because alternations in the conditioning information set change the statistical inferences that one draws regarding the GTFP-M relationship. In this case, the result is seen as “fragile.”4
The main objective of this paper is to test the robustness of trade growth, R&D growth, and FDI expansion on the TFP growth of Taiwan and Korea. In the case of Taiwan, six macroeconomic variables are considered as Z-variables: real economic growth rate (GRE), growth rates of wholesale price index (GWI) reflecting inflation rate, growth rate of money supply M1B (GM1), change rate of balance of payment in current account (GBP), growth rate of manufacturing employment (GUM), and change rate of the ratio of surplus-deficit to government net revenue (GGS). Similar six macroeconomic variables are chosen as Z-variables for Korea. They are growth rates of consumer price index (GCP), growth rate of the ratio of government consumption to GDP (GDC), growth rate of the ratio of total exports to GDP (GWX), the growth rate of the ratio of total imports to GDP (GWM), the growth rate of M1 (GM1), and change rate of unemployment (GUM).
These variables demonstrate the monetary side and real side of an economy, domestic and external factors, as well as government and private sectors. In each EBA test, three of the Z-variables are included in a way consistent with Levine and Renelt (1992) and Hwang (2010). For the case of Korea, the M-variables chosen are the same as in the case of Taiwan except FDI due to the unavailability of data for each sub-industry. The M-variables are GEX, GIP, GTT, and GFDI.
Annual data are used for two countries. The time periods under study are 1981-2002 for Taiwan and 1967-1996 for Korea, respectively. It is understandable that the regression results of using equation 3 imply no causal relationship between the right-hand-side variables and TFP growth rate.5
3Following Okuda (1994), import penetration is defined as [(import value)/(import value + production value – export value)].
4For the possible drawbacks of EBA method, see Levine and Renelt (1992).
5For a few studies regarding causality between openness and growth, see Harrison (1996) and Bernard and Jensen (1999).
4. Empirical Results of EBA
The main interest of this study is to test the robustness of openness to trade, FDI, and R&D on TFP growth. Empirical estimation carried out in this study covers the aggregate manufacturing as well as its sub-industries. All variables are in real terms and expressed in the form of growth rate. All growth rates are calculated by first difference in logarithm function.6
4.1 Results of Taiwan and Korea:
Empirical results of the EBA tests for each of Taiwan’s manufacturing industries are summarized in Table 5.7It can be seen that real output growth rate of each industry is a good I- variable in explaining the TFP growth of Taiwan’s manufacturing. It shows a robust and positive effect on TFP growth in 10 out of 20 sectors examined. Unexpectedly, real R&D expenditure does not contribute to the TFP growth at all. Contrary to our expectation, it shows a robust negative impact on TFP growth in Wearing Apparel, while a fragile effect on all other industries. As far as
6First difference in logarithm function may remove unit root problem in regression analysis.
7We don’t provide all the statistical results of EBA in this paper. However, the full results of EBA can be requested to authors anytime. Hwang and Wang (2008) also report all results of EBA appeared in this study.
Table 5
Notes: i) GOP indicates average annual growth rate of real production output, GRD: growth rate of real R&D expenditure, GEX: growth rate of ratio of export value to production value, GIP: growth rate of import penetration ratio, GTT: growth rate of total trade to production, GFDI: growth rate of FDI. ii) R stands for Robust and F for Fragile. iii) -- represents unknown results because of data unavailability.
the trade variables are concerned, the EBA test results of Taiwan’s manufacturing do not support the hypothesis of the ‘virtuous cycle of trade and growth’. The results for testing (1) GEX (the growth of the ratio of export to production), (2) GIP (the growth of import penetration ratio), and (3) GFDI(the growth of FDI) are fragile for all 20 sub-sectors. They are either insignificant or varying in sign when various combinations of Z-variable are included in the sensitivity test. Only the variable GTT, which is defined as growth rate of total trade (export + import) value to produc- tion value, shows a robust positive effect in Precision Equipment, which is ranked second in trade ratio as seen in Table 3.1. Furthermore, in the case of all manufacturing, the test results are fragile forI-variables andM-variables.
In the case of Korea, in addition to the categories of total manufacturing, seven number of 2- digit industries are tested for their robustness of trade on TFP growth. Empirical results of EBA tests for each of Korea’s manufacturing industries are reported in Table 6. It can be seen that,
similar to the case of Taiwan, GOP is a robust I-variable in explaining the TFP growth, but GRD is not a robust variable. Among the M-variables, GEX is not a robust variable in all industries tested.
GIP (the growth rate of import penetration ratio) is positively robust in Textile etc., but strangely negatively robust in Paper and Printing and also in Fabricated etc., respectively. The negatively robust results indicate that the more domestic-market opening to foreign competition, the lower TFP growth was resulted. Finally, GTT is not robust in most cases tested, but is negatively robust in the case of Fabricated etc. which is a heavy industry.
4.2 Comparison between Taiwan and Korea
This study examined the significance of the effects of openness to trade, R&D, and FDI on TFP growth using segregated data of 22 Taiwan’s and 7 Korea’s manufacturing industries, respec- tively. It is interesting to see the similarities and differences in the test results between Taiwan and Korea regarding the effects of output growth, R&D variables, and trade variables on TFP growth.
The general results from two countries show that there are more significant similarities but few differences. First, the variable of real production growth (GOP), which represents the scale variations, has a robust positive effect on TFP growth in most industries of Taiwan and Korea. It
Table 6
Notes: i) GOP indicates average annual growth rate of real production output, GRD: growth rate of real R&D expenditure, GEX: growth rate of ratio of export value to production value, GIP:
growth rate of import penetration ratio, GTT: growth rate of total trade to production. ii) R stands for Robust and F for Fragile.
seems to imply that enlarging production scale in these two countries will improve TFP growth.
Second, the growth rate of real R&D expenditure (GRD), the second I-variable, displays either fragile effect or negative robust effect on TFP growth in Taiwan and Korea.8 This result is contrary to the common understanding and needs further analysis. One possible explanation is that R&D expenditure itself is not an accurate indicator to describe the technological progress. R&D investment may be a necessary, not the sufficient condition for promoting productivity. The efficiency of combining R&D capital stock with R&D manpower is probably more crucial in solving this puzzle. Third, as far as the M-variables are concerned, the growth rate in the ratio of export value to production value (GEX) shows no robust effects on TFP growth in both Taiwan and Korea.
Fourth, the M-variable that shows a highly inconsistent result among two countries is the import penetration variable (GIP), which is defined as [(import value) / (import value + production value – export value)]. This variable shows no robust effects on TFP growth in Taiwan. However, two industries in Korea show robust and negative results. Fifth, the GTT variable, which is the growth rate in the ratio of total trade (import + export) to production value, also has mixed impacts on TFP. It shows a positive robust effect in only one industry in Taiwan and displays a negative robust effect in two of Korea’s industries. But most industries in these two countries exhibit no correlations between TFP growth and GTT variations. Sixth, the growth of FDI shows no robust results among all industries in Taiwan. Seventh, our empirical findings between two countries imply that there exists an industry specific different relationship between TFP growth and other important variables. Considering all these empirical findings, the final results from the EBA tests on the manufacturing industries of Taiwan and Korea do not strongly support the ‘virtuous cycle of trade and growth’ hypothesis.
The above empirical results show that only variable of output growth (GOP) representing scale efficiency is significant in explaining manufacturing TFP growth of Taiwan and Korea, while international trade, R&D, and FDI do not show robust results. This finding that output growth can better explain TFP growth is similar to that found in Chen and Tang (1990) and Okuda (1994) about Taiwan; and Kim (2000) about Korea. From these findings, we may have further economic conjecture and implications. When both scale effect (i.e., output growth) and trade expansions are taken into account at the same time, the scale effect stands out as the dominant explanatory variable for TFP growth and the direct trade effects fade out. This seems to imply that trade expansion leads to scale enlargement, thereby contributing to productivity growth. Aside from its contribution to production scale, export expansion has a rather ambiguous and weak link with TFP growth in both Taiwan and Korea. This suggests that openness to trade forces firms to operate in a more competitive environment, which is conducive to productivity growth. However, competing in foreign markets requires adjustments in the whole chain of production process, from product design to after-sales service. This imposes an extra burden on production costs and is thereby detrimental to TFP growth. Therefore, it is unclear a priori that trade openness always enhances productivity.
5. Conclusion
Considering recent debates on the growth experience of HPAEs, this study examines the sig-
8An endogeneity of R&D variable may give a fragile result in our EBA estimation. We are using growth rate of R&D variable not level of R&D. Our basic growth model based on Kwon (1986) and Benhabib and Spiegel (1994) are all employing growth rates of output and R&D not lagged growth rates or level variables.
nificance of the effects of openness to trade, R&D, and FDI on total factor productivity growth using segregated data of 22 Taiwan’s and 7 Korea’s manufacturing industries, respectively.
Growth accounting method was used to define and calculate total factor productivity growth. The EBA test was employed to investigate the robustness of openness to trade, R&D, and FDI in the relationship with TFP growth. The EBA test results in two countries are not consistent with the common belief of ‘virtuous cycle of trade and growth.’ Firstly, regarding the I-variables, only the real output growth shows robust effects on TFP growth in the two countries studied, and the R&D variable does not have robust effects at all. Secondly, regarding the M-variables, all variables related to openness to trade show almost no robust effects upon TFP growth in two countries.
Third, our empirical findings show that there exists industry specific different relationship between TFP growth and other important variables. The expected positive effect of openness to trade, R&D, and FDI on TFP growth seems to be an industry specific phenomenon not the same for all subsectors of manufacturing. Our investigation of Taiwanese and Korean industries revealed that more than any other variables of trade expansion, R&D, and FDI, the scale economies is very strong and significant factor in explaining the TFP growth for most industries of two countries.
Given our findings that trade expansion has an insignificant and ambiguous effect on TFP growth, a constant belief of “virtuous cycle of trade and growth” will be a question. Other factors that might contribute to the TFP growth in the industries of Taiwan and Korea still remain unclear and deserve further researches in the future. In addition, there might be some endogeneity problem between technological growth and other variables such as level data of R&D variable and FDI.
Further studies will need to consider IV estimation or structural VAR model in order to provide more robust estimation between TFP growth and important variables such as R&D, FDI, and Exports.
References
Aw, B.Y, S. Chung and M. J. Roberts (2000), “Productivity and Turnover in the Export Market: Firm Level Evidence from Taiwan and South Korea,” World Bank Economic Review, 14 (1), pp. 65-90.
Behabib, J. and M.M. Speigel (1994), “The Role of Human Capital in Economic Development: Evidence from Aggregate Cross-country Data,” Journal of Monetary Economics, 34, pp. 143-173.
Bernard, A.B. and J.B. Jensen (2004), “Exporting and Productivity in the USA,” Oxford Review of Economic Policy, 20 (3), pp. 343-357.
Chen, T.J. and D.P. Tang (1990), “Export Performance and Productivity Growth: the Case of Taiwan,”
Economic Development and Cultural Change, 38(3), pp. 577-584.
DGBAS (2003), The Trends in Multi-factor Productivity of Industrial Sector, Taiwan Area, Directorate- General of Budget, Accounting and Statistics, Taipei.
Dollar, D. and K. Sokoloff (1990), “Patters of Productivity Growth in South Korean Manufacturing Industries 1964-1979,” Journal of Development Economics, 33, pp. 309-327.
Edwards, S. (1998), “Openness, Productivity, Growth: What do We Really Know?”
Economic Journal, 108, pp. 383-398.
Feder, G. (1983), “On Exports and Economic Growth,” Journal of Development Economics, 12, pp. 59-73.
Grossman, G.M. and E. Helpman (1992), Innovation and Growth in the Global Economy, MIT Press, Cambridge, MA.
Harrison, A. (1996), “Openness and Growth: a Time-series, Cross-country Analysis for Developing Countries,” Journal of Developing Economies, 48, pp. 419-447.
Hay, D.A. (2001), “The Post-1990 Brazilian Trade Liberalization and the Performance of Large
Manufacturing Firms: Productivity, Market Share and Profits,” Economic Journal, 111, pp. 620-641.
Hejazi, W. and A. E. Safarian (1999), “Trade, Foreign Direct Investment and R&D Spillovers,” Journal of International Business Studies, 30(3), pp. 491-511.
Hwang, I. (2010), “Fundamental Sources of Technological Progress in Korean Manufacturing during 1973- 1993,” Kyungje Yonku, 31 (1), pp. 56-77.
Hwang, I. and E. C. Wang (2004), “Does Openness to Trade Affect Total Factor Productivity Growth:
Evidence from 35 Japanese Manufacturing Industries,” Journal of Economic Research, 9, pp. 147-173.
Hwang, I. and E. C. Wang (2008), The Effectiveness of Export, FDI, and R&D on Total Factor Productivity, Growth: The Cases of Taiwan and Korea, Monograph Series 14, Social Science Research Institute, International Christian University.
Kavoussi, R.M. (1984), “Export Expansion and Economic Growth: Further Empirical Evidence,” Journal of Development Economics, 14, pp. 241-250.
Kim, E. (2000), “Trade Liberalization and Productivity Growth in Korea Manufacturing Industries: Price Protection, Market Power, and Scale Efficiency,” Journal of Development Economics, 62, pp. 55-83.
Kim, S.J. (2003), “Information Technology and Its Impacts on Economic Growth and Productivity in Korea,”
International Economic Journal, 17(3), pp. 55-75.
Kwon, J.K. (1986), “Capital Utilization, Economies of Scale and Technical Change in the Growth of Total Factor Productivity,” Journal of Development Economics, 24, pp. 75-89.
Leamer, E. E. (1983), “Let’s Take the Con out of Econometrics,’ American Economic Review, 73(1), pp. 31- 43.
Leamer, E. E. (1985), “Sensitivity Analyses Would Help,” American Economic Review, 75(3), pp. 308-313.
Levine, R. and D. Renelt (1992), “A Sensitivity Analysis of Cross Country Growth Regressions,” American Economic Review, 82 (4), pp. 942-963.
Lucas, R. (1988), “On the Mechanism of Economic Development,” Journal of Monetary Economics, 22, pp.
3-42.
Miller, S.M. and M.P. Upadhyay (2000), “The Effect of Openness, Trade Orientation, and Human Capital on Total Factor Productivity,” Journal of Development Economics, 63, pp. 399-423.
Nishimizu, M. and S. Robinson (1984), “Trade Policies and Productivity Change in Semi-industrialized Countries,” Journal of Development Economics, 16, pp. 177-206.
Oczkowski, E. and K. Sharma (2001), “Imperfect Competition, Return to Scale and Productivity Growth in Australia Manufacturing: A Smooth Transition Approach to Trade Liberalization,” International Economic Journal, 15(2), pp. 99-113.
Okuda, S. (1994), “Taiwan’s Trade and FDI Policies and Their Effect on Productivity Growth,” Developing Economies, 32 (4), pp. 423-443.
Park, S. R. and J. K. Kwon (1995), “Rapid Economic Growth with Increasing Returns to Scale and Little or No Productivity Growth,” Review of Economics and Statistics, LXXII, pp. 332-351.
Rodriguez, F. and D. Rodrik (1999), Trade Policy and Economic Growth: a Skeptic’s Guide to the Cross- National Evidence, NBER Working Paper, 7081.
Rodrik, D. (1995), “Trade Policy and Industrial Policy Reform,” in J. Behrman and T.N. Srinivasan (eds.) Handbook of Development Economics, Vol. 3B, North-Holland, Amsterdam.
Romer, P. (1986), “Increasing Returns and Long Run Growth,” Journal of Political Economy, 94, pp. 1002- 1037.
Solow, R. (1956), “A Contribution to the Theory of Economic Growth,” Quarterly Journal of Economics, 70, pp. 65-94.
Solow, R. (1957), “Technical Change and the Aggregate Production Function,” Review of Economics and Statistics, 39, pp. 312-320.
Urata, S. (1994), “Trade Liberalization and Productivity Growth in Asia: Introduction and Major Findings,”
Developing Economies, 32 (4), pp. 363-372.
Wang, E.C. (1995), Promoting Sustainable Development through Trade: the Case of Taiwan’s Manufacturing Productivity, Conference Paper, ADIPA 11th General Meeting, Sabah, Malaysia, October 1995.
World Bank (1993), The East Asian Miracle: Economic Growth and Public Policy, Oxford University Press, New York.
Wu, Y. (2000), Openness, Productivity and Growth in the Asian-Pacific Economies: an Alternative Approach, 7thConvention of East Asian Economic Association, Singapore.
Appendix: Data Sources and Definitions
Taiwan:Data Sources:
CEPD (Council for Economic Panning and Development), Taiwan Statistical Data Book 2002, Taipei, 2002.
DGBAS (Directorate General of Budget, Accounting and Statistic), The Trends in Multi-factor Productivity of Industrial Sector, Taiwan Area, ROC, Taipei, 2003.
DGBAS, Statistical Yearbook of the ROC, 2002, Taipei, 2002.
DGBAS, National Income in Taiwan Area, ROC, Taipei, various issues.
DGBAS, Quarterly National Economic Trend, Taiwan Area, ROC, Taipei, various issues.
MOEA (Ministry of Economic Affairs), Industrial Production Statistics Monthly, Taiwan Area of ROC, Taipei, various issues.
MOEA, Annual Statistics on Overseas Chinese & Foreign Investment, Outward Investment, and Indirect Mainland Investment of ROC, Taipei, 2002.
NSC (National Science Council), Indicators of Science and Technology, ROC, Taipei, 2002
MOF (Ministry of Finance): Monthly Statistics of Exports and Imports, Taiwan Area, ROC, Taipei, various issues.
Definition:
All growth rates are calculated by using logarithm difference: . All changing rates are calculated by .
GTFP: Growth rate of Total Factor Productivity GOP: Growth rate of Production Output R&D: Real R&D Expenditure
GRD: Growth rate of R&D
GIP: Growth rate of imports penetration ratio.
GTT: Growth rate of the ratio of total trade (exports + imports) to GDP FDI: Foreign Direct Investment
GFDI: Growth rate of FDI GRE: Real economic growth rate,
GWI: Change Rate of Wholesale price index GM1: Growth rate of Money supply M1B
GBP: Change rate of balance of payment in current account GUM: Growth rate of manufacturing employment (GME),
GGS: Change rate in the ratio of surplus-deficit to government net revenue
Korea:
Data Sources
ICSEAD (The International Centre for the Study of East Asian Development), East Asian Economic Perspectives, Recent Trends and Prospects for Major Asian Economies, Kitakyushu, Japan, various issues.
KNSO (Korea National Statistical Office), The Reports on Mining and Manufacturing Survey and Industrial Census, Seoul, Korea, various issues.
Seung Rok Park and Jene K. Kwon (1995), “Rapid economic growth with increasing returns to scale and little or no productivity growth,” The Review of Economics and Statistics, Vol. LXXII, 332-351.
Data Definition
All growth rates are calculated by using logarithm difference: . All changing rates are calculated by .
GTFP: Growth rate of Total Factor Productivity GOP: Growth rate of production output
GEX: Growth rate of the ratio of Export to Production GIP: Growth rate of imports penetration ratio.
GTT: Growth rate of the ratio of total trade (exports + imports) to GDP R&D: Real R&D Expenditure
GRD: Growth rate of R&D
GCP: Growth rate of Consumer Price Index GCG: Growth rate of Government Consumption GWX: Growth rate of ratio of Exports to GDP GWM: Growth rate of ratio of Import to GDP GUM: Change rate of Unemployment Rate GM1: Growth rate of M1