The Relationship Between the Size of Written and Spoken Vocabularies and the Use of EFL Vocabulary Learning Strategies
著者 Amano Shuichi
journal or
publication title
Journal of Shizuoka University Education
volume 11
page range 239‑248
year 2015‑03‑25
出版者 Shizuoka University. Educational Development Center
URL http://doi.org/10.14945/00008805
The Relationship Between the Size of Written and Spoken Vocabularies and the Use ofEFL Vocabulary Learning Strategiesr
SHUICHI AMANO (Education Development Center)
Introduction
Previous studies on the relationship between the use of vocabulary leaming strategies (VLSs) and second language (L2) receptive vocabulary sizes have provided usefirl information for the introduction of VLS instructions into classrooms (cf., Ansarin, Zohrabi, & Zeynali,2012; Hamzah, Kafipour, & Abdullah, 2009; Saida, 2006; Tanyer & Ozhrk, 2014; Waldvogel, 2013). Saida (2006) examined student vocabulary size and its relationship to the use ofVLSs among first-year students at a Japanese public high school with a high percentage of students pursuing a college or university degree. The estimated vocabulary size among the students was approximately 1700 words, and those with relatively larger vocabularies tended to use a wider variety of strategies. The use of organization strategies, which are methods to assist in leaming unfamiliar words in relation to known words, differed significantly in frequency depending on each participant's vocabulary size. In a recent survey
of adult Spanish leamers, Waldvogel (2013) found a meaningful relationship between the size of
receptive vocabularies and the VLSs of advanced leamers, although this relationship was not present among beginner and intermediate learners.
Studies such as those mentioned above have generally employed vocabulary size tests that involve written test items. However, spoken vocabulary size should also be considered since the visual and auditory vocabularies of English learners whose hrst language (L1) is Japanese tend to differ in
size (Mizumoto & Shimamoto, 2008).2 The dissimilarity in vocabulary size between the two modalities may cause a different relationship with VLSs, wherein leamers whose visual and auditory vocabulary sizes vary may use distinct types of VLSs. Mine et al. (2006), who examined whether effective VLSs differed according to listening proficiency or visual vocabulary size, suggested employing a spoken vocabulary size test as an outlook for future research, since they adopted only a written test.
Japanese leamers of Engiish as a foreign language @FL) seem to have larger visual vocabularies. Mizumoto and Shimamoto (2008) compared the visual and auditory vocabulary sizes of
Japanese leamers using both written and spoken tests. Regardless of leamer proficiency, the tests revealed a considerable difference between the participants' visual and auditory vocabulary sizes, wherein the former was consistently larger. This indicates that the acquisition ofmorphological forms does not always ensure the acquisition ofphonological forms, and that wdtten tests are clearly different
- 239 -
from spoken tests. Similarly, Amano (2014) compared the scores ofJapanese EFL undergraduates who completed a word translation task composed of both written and spoken stimuli. The overall mean scores were significantly higher for written stimuli, a result that was consistent for 28 of the 30 words.
This study provides further insights into the relationship between VLS use and visual and auditory vocabulary sizes among EFL university students with Japanese language backgrounds. Since vocabulary size generally affects the use of VLSs (Saida, 2006; Waldvogel, 2013), there may be a disparity in their use between leamers whose visuaVauditory vocabulary sizes considerably differ and those whose sizes are similar for both types. If so, VLS instructions should vary depending on the degree of similarity in vocabulary sizes between both modalities.
Survey Participants
The participants included 151 first-year students from four universities and colleges in Aichi, Japan, who received six years of formal EFL instruction at Japanese junior and senior high schools.
None of the students resided in English-speaking countries for a period exceeding a month. Only students who participated in each of the tlree survey sessions, which involved visuaVauditory vocabulary size tests and a questionnaire conceming VLSs, were included in the analysis. Therefore, the analysis included data from the remaining 142 pNticipants, which consisted of58 and 84 males and females respectively.
VLS Questionnaire
Given that this study attempts to include auditory vocabulary size in its analysis, a variable that has been ignored in prior VLS studies, the questionnaire used in the VLS survey needed to be capable ofdocumenting a wide range ofstrategies, since those that have traditionally received limited attention could actually play major roles. Therefore, Tanaka's (2012) questionnaire for vocabulary consolidation was adopted for this study, since it contains up to 26 items including oral and written rehearsals as subscales. The surveys were conducted during the first sessions ofeach EFL course that the participants were enrolled in. Responses were analyzed on a 5-point Likert scale, with 1 representing "strongly disagree" and 5 representing "strongly agree."
Vocabulary Size Test
Mizumoto and Shimamoto's (2008) written and spoken vocabulary size tests, which comprise eight stages (from the 1000 to 8000 word level) consisting of20 questions each, were adapted for use in this study. Considering the paxticipants' Foficiencies, the time required to complete both tests, and
-240 -
the test results reported in Mizumoto and Shimamoto (2008), only the first four stages (from the 1000 to 4000 word level) were used. The formula used to estimate vocabulary size was identical to Nation's (1990, p. 76), which is:
Number of correct answers x Total number in word list / Number of test items
The test was composed of multiple-choice L1-L2 translation, as in the example from the written version provided below (Mizumoto & Shimamoto, 2008, p. 39):
1静かな、穏 やかな
lA)succeSSm (B)quid
(C) strange ① )truC
For the visual version, questions and choices were written on a test sheet in Japanese and English respectively, and participants wele instructed to choose the correct answer for each question. For the auditory version, only Japanese questions were printed on the test sheet; choices were read aloud by a female, native speaker ofAmerican English, whose voice had been recorded onto a compact disc earlier.
The auditory and visual vocabulary size tests were conducted during the second and eighth sessions respectively of each EFL course that the participants were enrolled in. Following the auditory test, participants' test sheets were collected to ensure that they could not review them prior to the visual test.
Vocabulary Size Test
Table 1 summarizes the answer
Results
data from 142 participants for both vocabulary size tests.
Participants were allotted one point per correct response, with the perfect score for each word level being 20. The table contains the means, standard deviations (SDs), minimums, arid maximums for each of the four word levels, in addition to totals. The Cronbach's coefficient alpha was also calculated to
assess the internal consistency of each vocabulary size test, and the same results were found for both visual and auditory tests (.91). The total mean score was highest (58.88) and lowest (50.42) for the visual and auditory tests respectively, a result that was consistent across all levels. A paired t-test showed that the difference was significant (l (141) = 14.37, p < .001, d: 0.73).
‑241
Table l
Dのο″を2万ツι Srarお″οノb′ 乃οαι″″ッSize ra,ぉ
1000 3000 4000 Total
Audtory Audめ7 Attltoげ
Audrow
ハガお,Mean
わ ヽ輸
NIa―
m5888 5042 1110 1181
20 11 76 71
1826
236
8 20
1669 297
3
20
1506 413
2 20
1377 334
4 20
1439 332
4 20
H16
374
0 18
1117 324
2 17
880 375
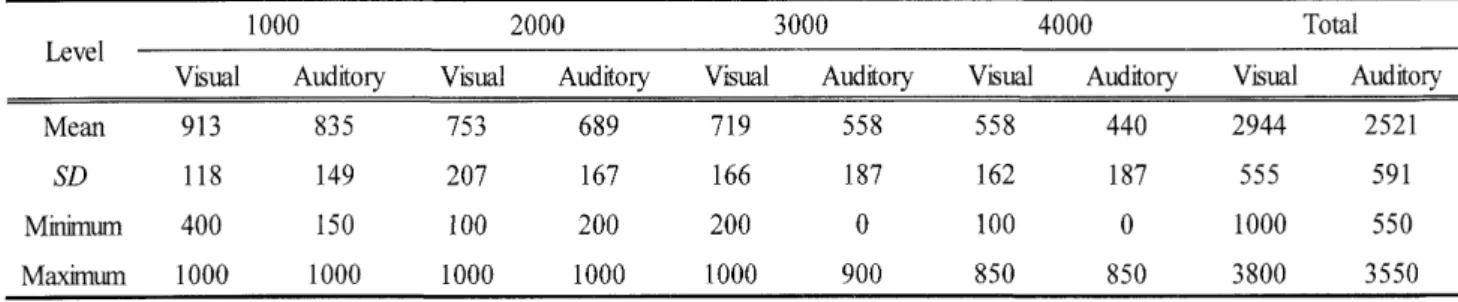
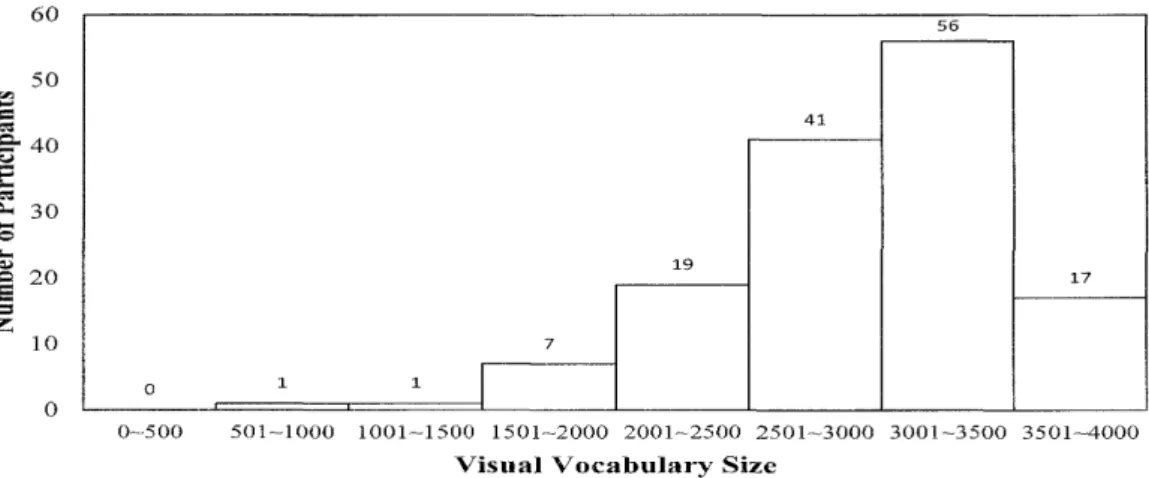
0 17Regarding estimated receptive vocabulary sizes (see Table 2), the mean was sigrificantly higher for the visual test (2944 words) when compared to the auditory test (2521 words) (paired t{est, t (l4l):14.36, p < .001, d: 0.73). Furthermore, Figure 1 shows that the vast majority of participants possessed larger visual vocabularies, although there were eleven exceptions (7.75 percent), which are represented by dots placed below the diagonal line. The correlation between written and spoken vocabulary sizes was rather strong (r: .81). Histograms for the number of participants in each 500 word-range are provided in Figures 2 and 3. The visual and auditory vocabularies of 82.39 and 81.69 percent ofthe participants respectively were between 2001 to 3500 words.
Tab1e2
Estimated Wsual and Auditory Vocabulary Sizes
1000 2000Auditory Vjsual AuCitory Visual Auditory Vjsual Auditory
AudroγMean 913
SD H8 M―
n1 400
Ma―
m 1000
835 149 150 1000
753 207 100 1000
689 167 200 1000
719 166 200 1000
558 187 0 900
558 162 100 850
440 187 0 850
2944 555 1000 3800
2521 591 550 3550
3500
o o ︒ m o o ︒
m m
3
2
2
1
1
あ日 む
︻こ目
´S 卜o
﹃ 漏
>
0 500 1000 1500 2000 2500 3000 3500
Auditory Vocabulary Size
Figure I . Scatter plot ofparticipants' estimated vocabulary sizes.
。
.
。 ti::::。 :タ ダメ
.', i"'-'::r: "**
. │ 。 .. 8
。̀ ".シ.● 0 ● レイ●・・
う´る 。
‑242‐
ヨ .■40
ゼ
■ 30
増 20
Z
●Visual \/ocabulary Size
Figure 2. Number ofparticipants in each 500 word-range for the visual test.
.340鷺
榎
〜 30
増
20 Z
Auditory Vocabulary sレ
eFttκ
3 Number ofparticipantsln cach 500 word― range for the auditO,tcst
YLS Questionnaire
The means and SDs for each questionnaire item are provided in Appendix. The Cronbach's coefficient alpha was calculated to determine the intemal consistency reliability of each subscale, as
shown in Table 3. Since the values were consistently high, the means for each subscale were computed and analyzed as scale scores (see Table 4). Both rehearsal tlpes were frequently used, although 'hritten
rehearsal" was the most popular; "reference" was also a common strategy among participants. In conffast, "language exposure" was the least frequently employed strategy, which involves an autonomous effort to expose oneselfto English outside ofthe classroom.
Table 3
Internal Consistency Reliability for Each Subscale
oral rehearsal Y*:, Note-taking orgnizatbn Reftrerpe ?!|ee Metacognirive
S'Jbscabrelrearsal""e.qrosure
76 80 87 83 87
0 0
0 0 6 5
0 0
0〜500 501〜1000 1001〜1500 1501‑2000 2001〜 2500 2501‑3000 3001〜 3500 3501‑4000
0‑500 501〜 10oo lo01〜1500 1501〜2000 2001〜2500 2501〜3000 3001‑35oo 3501〜 4000
76 84
‑243‐
Tablc 4
睦 α 溶 グ
Sra″グα 〃Dαゎあ溶ヵ′
Eαι み助おι α ル
,PSCale omlrehearsal 輛
Noie-hking Orgnization ReGrerrce 螺 驚 Metacom
Meall
D318
091362
097226
082
267
085
317
102196
080
290 090
Comparison of VLSs
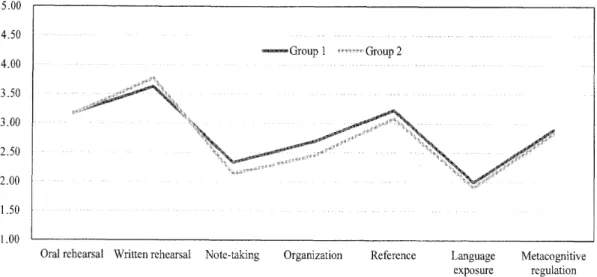
After considering several analysis methods, it seemed most appropriate given the data size to divide participants into two groups, with reference to Kelly (1939) and Ohtomo (1996), to compare the VLSs used by both. Participants who exhibited a relatively minor difference in vocabulary size between modalities were included in Group 1, which comprised leamers from the top twenty-seventh percentile. In contrast, Group 2 included participants from the bottom twenty-seventh percentile, whose vocabulary sizes differed significantly between modalities. As shown in Table 5, there was roughly an 800-word difference in the vocabulary size between modalities for Group 2. A Mann- Whitney U-test revealed a substantial difference in the visual minus auditory vocabulary size between the two groups (z:7.52, p < .001, r : .86), although a significant difference in the frequency ofVLS
use did not exist between them (see Table 6 and Figure 4).
Tablc 5
Zι
α
ers わSteBι
ttνι
̀″
βO″ ルああ ″
tiesVisual vocabulary size Audiiory vocabr. ary size
Vttllal―a調
雌o呼Ooup
1
2
38 38
2678 2946
2649 2096
29 82 1 一 2 8
456
607
567
29 850
Table 6
brence in WS Use Between
Group 2 Subscale
Oral rehears al Written rehears al
Note-taking Orgartization Reference Ianguage eryosure
Metacognitive
317
3.62
233 269 322
2.00 2.89
0.83
091
089 069103
080 094316 377 214 245 309
1.91 2.83
095 093 068 078
0.97
075 090
018 068
100 137
0.53
035
0.37
86 50 32
17 .59 .73 7102 08
12 16 .06̲04
04
‑244‑
1.50
Oral
rehea$al
Writtenrehea$al Noh-taking Oryanization
ReferenceLanguage
Metaaognitiveexposure
rcgulationFigure 4. Aline graph showing the difference in VLS use between groups
Discussion and Conclusion
A comparison of written and spoken vocabulary sizes revealed a clear difference between the two modalities, a finding consistent with Mizumoto and Shimamoto (2008). Most (92.25 percent) of
the participants possessed a larger visual rather than auditory vocabulary. Nevertheless, since the correlation between written and spoken vocabulary sizes was fairly strong (r = .81), both types of
vocabulary knowledge were closely linked in the mental lexicon. Furthermore, as Table 6 shows, there were generally no distinctive trends in \rLS use among participants regardless of their written or spoken vocabulary sizes; as such, VLS use alone cannot explain differences in spoken and written vocabulary sizes.
These results suggest that language teachers should not require students at this level to take both written and spoken vocabulary size tests, as such tests aiming to gauge student vocabulary size for both modalities may not prove beneficial in designing leamer-appropriate VLS insfluctions. This assertion is based on four observations: 1) no relationship was found between the use ofVLSs and differences in visual and auditory vocabulary sizes, 2) a strong correlation was found between visual and auditory vocabulary sizes, 3) students may feel overburdened if required to complete both types of vocabulary size tests, and 4) time constraints may prohibit instructors from administering both test types.
Three limitations of this study must be mentioned. First, considering the participants' L2 proficiency and time constraints, only the first four stages of Mizumoto and Shimamoto's (2008) tests were used. However, the fifth stage should have been included as well since 17 participants' visual vocabularies ranged between 3501 to 4000 words (see Figure 2). In some cases, this may have resulted
-245 -
in the underestimation of participants' visual vocabularies. Second, there was limited variation in proficiancy among participants. As Waldvogel (2013) indicated, overall proficiency can be a factor that affects the relationship between receptive vocabulary size and VLS use. Since participants in this study were fairly homogeneous in terms of their lack of experience abroad in English-speaking countries and their length of formal EFL education, it is highly possible that a wider range of
proficiencies could reveal additional findings. In that respect, the study's third limitation involves the
limited rage of its participants' vocabularies: over 80 percent of tle leamers surveyed possessed vocabularies ranging between 2001 to 3500 words. Therefore, if similar studies are to be undertaken in the future, they should include leamers of varying proficiencies ald vocabulary sizes.
. Notes
1. An earlier version of this paper was presented at the 83rd conference of the Japan Association for
Language Education and Technology, Chubu Chapter, at Aichi University of Education onMay 24,
20t4.
2. While this is true among leamers of English whose Ll is Japanese, Milton and Hoplins (2006) found that English leamers whose Ll is Arabic did not show much difference in size compared to those whose L1 is Greek.
References
Amano, S. (2014). Lexical factors affecting modality differences in word translation by Japanese ruriversity EFL learners. Nagoya Zokei University ofArt and Design Bulletin, 20,87-94.
Ansarin, A. A., Zohrabi, M, & Zeynali, S. (2012). Language leaming strategies and vocabulary size of hanian EFL leamers. Theory and Practice in Language Studies, 2,184l-1848.
Harnzah, M. S. G., Kafipour, R., & Abdullah, S. K. (2009). Vocabulary leaming strategies of hanian undergraduate EFL students and its relation to their vocabulry size. European Journal of
Social Sciences, I 1, 39-50.
Kelly, T. L. (1939). The selection of upper and lower groups for the validation of test items. Journal of Education Psychologt, 30,1714.
Milton, J., & Hoplins, H. (2006). Comparing phonological and orthographic vocabulary size: Do vocabulary tests underestimate the knowledge of some learners? Canadian Modern Language Review, 6j,127-147.
Mine, H., Edasawa, Y, Yoshimura, M., Imai, Y, Fuse, K., & Hiraiwa, Y (2006). Risuningu ni okeru
goi saizu to gakushu horyaku [Vocabulary size and leaming strategies in listening
comprehensionl. Bulletin of lrxtitute for Interdisciplinary Studies of Culture, Doshisha
‐
246‑
Women b College of Liberal Arts, 23,5949.
Mizumoto, A., & Shimamoto, T. (2008). A comparison of aural and written vocabulary size of Japarese university EFL leamers. Language Education and Technology, 45,35-52.
Ohtomo, K. (1996). Komoku oto riron nyumofi: Gengo tesuto deta no atardshii bunseki ho [An introduction to item response theory: A new method for analyzing language test datal , Tokyo:
Taishukan Shoten.
Saida, C. (2006). Koko I nensei no 'goi saizu to goi gakushu sutorateji tono kankei'no ichikosatsu [Relationships between vocabulary size and the use of vocabulary leaming strategies of first
year high school students using structure equation modelingl. KATE Bulletin, 20,63-74.
Tanaka, H. (2009). Vocabulary leaming strategy use by Japanese EFL university fieshmen. Research Bulletin of English Teaching, 6,1741.
Tanaka, H. (2012). Daigakusei eigo gakushusha no goi gakushu horyaku chosa oyobi go shinmitsudo
ni motoduku denshi potoforio ni yoru goi gakushu horyaku shien [Investigating Japanese college EFL leamers' vocabulary leaming strategy and assisting strategy use by e-portfolio based on word familiarityl. Language Education and Technolog, 49,93-120.
Tanyer, S., & Ozfirk, Y. (2014). Pre-service English teachers' vocabulary leaming strategy use and vocabulary size: A cross-sectional evabtation. Journal of Language Teaching and Research, 5,
3745.
Waldvogel, D. A. (2013). The relationships between vocabulary leaming strategies and vocabulary size among adult Spanish foreign language leamers. Journal of Language Teaching and Research, 4 , 209-219
.- 247 -
Appendix
Means and standard
Note. Tt'te oi$ral Japanese version of this questionnaire was used in the survey. The above items were translated by referring to another questionnaire developed by Tanaka (2009).
グのたノ jO溶 each itetrt
2θf2SN
SubscalesQugstiomaire items Frequeflcy ofuse
Mean SD
1 2 3
Ora[ rehearsal Oral rehearsal Oral rehearsal
When I try to remember
awor4 I read it abud.
When I try to remember a word, I repeatedly irnagine its sormd in my mind.
When I try to remember a wor4 I read it abud repeatedly.
4 7 3 1 2 1
l.l0
l.l1 t.l2
4
5
6
7
'Written rehearsal Written rehearsal 'Written rehearsal Written rehearsal
I txy to remember
aword by writing it,
I try to remember
aword by writing it while being corscious of its spelling.
When I try to remember
awor4 I $rite it repeatedly.
I try to remember
aword by writing it whfu being coDscilus of its Eeaniog
3.74 3.49 3.68 3.56
1.15
1.25
1.ll
8 9
︲0
Note-takiog Note-taking Note-taking
I take notes not only about the meanitgs ofa word, but ako other informatbrl such as its antonyls, ryrronyms,
a,lldusage.
I take notes not ony abou the meaniogs of
aword, but also its colk calbDal informatior"
I take notes not or y about the meanings of a word, h, ako exa@le seniences.
2.34 2.37 2.M
0.99 0.96 1.02
11
12
l3 t4
Organization Organization Organization Olganization
I make concparkors between words wifh siil'lar mearrings (e.g., claim and demard).
I make comparisors or create rehtiorishbs between known and urmown words in order to remember them.
I make
corparisons
and createrelationships
between a word'sderivatives, including
nouns, verbs, and adjectlvesto rerErnber it
(e.g., agreement,agee
and agreeable).I attempt to remember a word alongside its arrton),rn (e.g., increase and decrease).
2.36 2.78 2.63 2.90
1.06
1.09
1.06
1.t2 l5
l6
17
l8
Reference Reference Reference Reference
I use a dictk nary to deepen my krowbdge and understandiog of lorown wGds.
I refer to a dictioDary to check the usage ofwords and phmses.
I refer to a dbtionary to check the meanings of kxrown words and pbases.
I use a dbtbnary to hcate example sentences for klogm words and phases.
2.95 3.45
3.2',1
2.99
1.211.20
1.19
1.24
19
20
2l
22
LaDguage exposu:e Laflguage exposure LaDguage exposue Larguage exposwe
I seek oppoftEiries to be erqosed to English words and phrases by conrmunicating with people via chat or email
I seek oppommties to be e).?osed to English words and plrases by reading book. magagines- and teaflfng rDateriah.
I seek opportunities to be exposed to Englbh beyond class assignments and school-provided leaming materiah.
I
seekoppoftunities to be exposed to English words
andphrases by Iistenhg to the radio or educatiooal materials and by watohhg television prograhs and films.
1;17
1.v2
2.01.
2.15 0.84 0.94 1.05
1.12
u
25
2i
Metacognitive regulation Metacognitiiye regubtbn Metacognitive reguhtbn Metacognitive regulation
I try to relea.rn words or phases that I caruIot remember well ot forget.
I attempt to bam words and pbrase by setting a goal by myself.
I attempt to bam wolds and phrase usirg a self-directed phIL I leam words aad phases autdromously.
3.02 2.87 2.70
3.4
1.10
1.05
l,.w
1.03