EORC
Annual Report 2006 No.10
March 2007
Earth Observation Research Center (EORC)
Japan Aerospace Exploration Agency
Tsukuba Space Center
2-1-1 Sengen,Tsukuba-shi,Ibaraki,305-8505 Japan Tel. +81-29-868-5608 Fax. +81-29-868-5987
EORC Bulletin Annual Report No.10
Contents
Foreword
㩷 㩷 㩷 㩷 㩷 㩷 㩷 㩷 㩷 㩷 㩷 㩷 㩷 㩷 㩷 㩷 㩷 㩷 㩷 㩷 㩷 㩷 㩷 㩷 㩷 㩷 㩷 㩷 㩷 㩷 㩷 㩷 ጟ䊶ᶆ 㩷 㩷 㩷 㩷 㩷 㩷 㩷 㩷 㩷1. OUTLINE OF EARTH OBSERVATION RESEARCH CENTER
(EORC)
㩷 㩷 㩷 㩷 㩷 㩷 㩷 㩷 㩷 㩷 㩷 㩷1.1 Objectives ···4
1.2 Organization ···5
1.3 Science Projects ···7
1.4 Individual Research Activities ···7
1.5 Major Activities ···7
1.6 Affiliated Graduate School
㩷···10
㩷 㩷 㩷 㩷 㩷 㩷 㩷 㩷 㩷 㩷 㩷 㩷
2. RESEARCH ACTIVITIES
㩷 㩷 㩷 㩷 㩷 㩷 㩷 㩷 㩷 㩷 㩷 㩷 㩷 㩷 㩷 㩷 㩷2.1 Research Programs/Projects
㩷···12
2.1.1 TRMM and GPM ···12
㩷 㩷 㩷 㩷 㩷 㩷 㩷 㩷 㩷 㩷 㩷2.1.2 GCOM
㩷···17
2.1.3 ALOS
㩷···29
2.1.4 GOSAT
㩷···54
2.2 Future Programs
㩷···57
2.3 Research on Instrumentation
㩷···60
2.3.1 SGLI
㩷···60
㩷 㩷 㩷 㩷 㩷 㩷 㩷 㩷 㩷 㩷 㩷2.3.2 AMSR2
㩷···62
2.3.3 EarthCARE/CPR
㩷···64
2.3.4 Large-diameter Mirror ···65
3. GROUND SYSTEM AND DATA PRODUCTS
㩷 㩷 㩷 㩷3.1 EOC Overview ···68
㩷 㩷 㩷 㩷 㩷 㩷 㩷 㩷 㩷 㩷 㩷3.1.1 Operation History and Current Status ···68
3.1.2 System Overview ···71
3.2 Mission Operations for Earth Observation Satellites
㩷···72
㩷 㩷3.2.1 TRMM ···72
3.2.2 AMSR-E Data Processing System
㩷···77
3.2.3 ADEOS-II Mission Operation System ···80
3.2.4 ALOS Mission Operation System
㩷···84
㩷 㩷 㩷 㩷 㩷 㩷 㩷 㩷 㩷 㩷 㩷3.3 Active Archive of Earth Observation Satellite Product
㩷···93
3.4 Studies for Future Projects
㩷···95
3.5 Data Analysis System
㩷···96
3.5.1 Overview of Data Analysis System ···96
3.5.2 Operation and Development of Data Analysis System ···98
3.6 Direct Data Receiving from EOS ···104
3.7
㩷Data Delivery Statistics
㩷···106
4. INTERNATIONAL COLLABORATION
㩷 㩷 㩷 㩷 㩷 㩷 㩷 㩷4.1 International Meetings ···108
4.2 International Collaboration Research ···108
4.3 Foreign Guest Researchers ···108
4.4 International Arctic Research Center (IARC) ···109
5. LIST OF SCIENTIFIC CONTRIBUTIONS
㩷 㩷5.1 Scientific Journal Articles ···112
5.2 Books ···112
5.3 Reviews and Others ···113
5.4 Conference Proceedings ···113
5.5 Oral Presentations ···114
5.5.1 Open Conferences ···114
5.5.2 EORC International Workshops ···114
5.5.3 Japanese Society Meetings ···114
6. EORC PUBLICATION LIST ···117
7. BUDGET AND PERSONNEL
㩷 㩷 㩷 㩷 㩷7.1 Budget ···120
7.2 Number of Personnel
㩷···120
㩷 㩷 㩷
8. HISTORY OF EORC ···121
㩷 㩷 㩷 㩷 㩷 㩷 㩷 㩷 㩷 㩷 㩷9.
㩷ACRONYMS AND ABBREVIATIONS
㩷···131
1
Foreword
The Earth Observation Research Center (EORC) has been developing satellite data analysis technology and exploring Earth observation research activities since April 1995 under the National Space Development Agency of Japan (NASDA). The Japan Aerospace Exploration Agency (JAXA) has taken over these activities since October 2003 involving the Earth Observation Center (EOC) which is the ground station at Hatoyama, a technology division of instrumentation and data receiving/processing, and groups for international liaison, promoting data utilization and publicity.
In May 2006 EORC which was the abbreviation of Earth Observation Research and application Center at that time, was divided into the Satellite Application Promotion Center (SAPC) which focuses on satellite data application and its promotion and EORC which takes responsibility for satellite data analysis and research.
EORC has continued to play a major role in the Office of Space Application of JAXA as a unified field center of Earth observation. EORC has been deploying extensive researches in following areas: optical and microwave instrumentation, algorithms to extract physical quantities from satellite data, calibration and validation of satellite data, data processing and distribution system and data application to Earth environmental sciences, weather forecast, fishery, agriculture, forestry, water management, land use, resource exploration and management, natural hazard watch etc., as well as satellite operation and data receiving at EOC, planning of future Japanese Earth observation satellites.
EORC has been involved in several satellite projects of Earth observation since its foundation, including Japanese Earth Resources Satellite - 1 (JERS-1 operated in 1992-98), Advanced Earth Observation Satellite (ADEOS operated in 1996-97), NASA’s Tropical Rainfall Measurement Mission with Precipitation Radar (TRMM/PR operating from 1997 ), NASA’s EOS-Aqua with Advanced Microwave Scanning Radiometer-E (Aqua/AMSR-E operating from 2002) and Advanced Earth Observation Satellite-II (ADEOS-II operated in 2002-03). The Advanced Land Observing Satellite (ALOS) was successfully launched in January 2006. ALOS carries Phased Array L-band Synthetic Aperture Radar (PALSAR), Panchromatic Remote sensing Instrument for Stereo Mapping (PRISM) and Advanced Visible and Near Infrared Radiometer - 2 (AVNIR-2), to observe the Earth with high resolution. ALOS has been taking the 0.7 TB/day data for various capabilities of data application. Our present task is to make our experience be applied to Earth science on global changes and practical fields of data utilization for societal benefits such as watch and mitigation of disasters.
In 2006 a new project, namely Global Change Observation Mission (GCOM) was started. GCOM consists of two satellite series, GCOM-W and GCOM-C, as successors of ADEOS-II. GCOM continues to observe the Earth beyond 10 years for better understanding of global change. GCOM will provide us quite useful data in various fields.
This report was prepared to give the overview of the EORC activities in the fiscal year 2006. We hope that it would be useful as a reference book on EORC and help you to understand EORC. In concluding, we would like to thank all EORC colleagues for their utmost endeavors, and many people outside EORC for their continuing support and guidance.
Autaum 2007
Toshio Doura, EORC Director Katumi Musiake, Technical Counselor
3
͑͢͟Ά΅ͽͺͿͶ͑ͷ͑ͶͲ΅͑
ͳ΄Ͷ·Ͳ΅ͺͿ͑Ͷ΄ͶͲʹ͑
ʹͶͿ΅Ͷ͙͑Ͷʹ͚͑
1. OUTLINE OF EARTH OBSERVATION RESEARCH CENTER
1.1 Objectives
The Earth Observation Research Center (EORC) has been developing continuously as the core organization covering the full spectrum of Earth-observation activities in JAXA, i.e., mission planning, R&D of sensors, algorithms, calibration, validation, data products, ground segments, operations of mission data handling, research coordination, promotion of applications, support of administrative and strategic matters, and so on. In EORC, we analyze observation data acquired by Earth-observation satellites, develop algorithms to derive geophysical parameters and to calibrate and validate satellite data, and try to maintain the quality of the data. We also promote research and application of satellite data in the fields of meteorology, control of forestry and fisheries resources, disaster prevention and national land use, and global environmental changes. To conduct these activities smoothly, we employ new Earth observation instruments, and develop and operate the ground system for Earth-observation satellite data. As part of this task, we operate the Earth Observation Center (EOC) to receive, process, and distribute satellite data.
EORC was founded to conduct Earth-observation satellite data acquisition, processing, and research in April 1995, and has three major goals of data utilization: climate change, disaster monitoring and resource management. After the October 2003 integration of three space institutions in Japan, NASDA, ISAS and NAL, all Earth-observation projects were defined as enterprises of Office of Space Applications (OSA). In 2006, EORC (the former name of Earth Observation Research and application Center) was divided in two centers. One is the Earth Observation Research Center (EORC), which is the core for the analysis and research of Earth-observation satellite data. The other is the Satellite Applications and Promotion Center (SAPC), which is responsible for promoting satellite data and products. The new EORC moved from Tokyo to Tsukuba Space Center in 2006 and has started to communicate with institutions and agencies in Tsukuba.
The global climate and environment changes in recent years are of great concern and even threaten the continuation of the Earth system. Global change may even menace people's daily lives by generating frequent storms and flood damage such as mighty typhoons. The Global Earth Observation System of Systems (GEOSS), a cooperative project for international Earth observation, was started from 2006 to cope with such changes. In concert with these international activities, the Earth Observation and Ocean Exploration System including Earth-observation satellite systems was selected as a national key technology by the Council for Science and Technology Policy (CSTP) in March 2006.
JAXA has been establishing Earth-observation systems to contribute to Earth observation and ocean exploration systems and GEOSS. “Daichi” (ALOS), which was launched on 24 January 2006, participates in the system together with the on-going TRMM and AMSR-E programs.
GOSAT and Dual-frequency Precipitation Radar (DPR) on board the GPM core satellite are now in phase C/D and are also expected to participate in the system. To contribute to the future global change mission, EORC has initiated a phase A study of GCOM-W and GCOM-C as the successors of ADEOS-II and AMSR-E aboard EOS-Aqua. Accordingly, the GCOM-W1 project was established in April 2007. In addition, the study of the Cloud Profiling Radar (CPR) aboard EarthCARE is progressing in cooperation with ESA and NICT.
As Japan's core organization for Earth observation, EORC contributes to building a safe and secure society through the development of these satellite systems.
5 1.2 Organization
In the 3.5 years since the birth of the Japan Aerospace Exploration Agency (JAXA), EORC’s role has remained basically the same as before but with modification due to the change of the framework of the Office of Space Applications of JAXA. In May 2006, the Space Application and Promotion Center (SAPC) was established, and the Earth Observation Research and application Center (EORC) became the Earth Observation Research Center (EORC). Accordingly, the functions of general data utilization promotion, coordination of international cooperation, and governmental data utilization promotion were transferred from EORC to SAPC. EORC is a center for research related to Earth-observation satellite data and is a department of the Office of Space Applications of JAXA. Mr. Toshio Doura presides over all organizational activities and reports to the Executive Director of the Office, Dr. Yasushi Horikawa, and Deputy Executive Director of the Office, Mr. Hideshi Kozawa. Prof. Yoshihumi Yasuoka, successor to Prof. Toshihiro Ogawa, is leading research activities as Technical Counselor.
Research activities are conducted in a matrix organization, i.e., researchers of atmosphere, ocean and land disciplines work partly for their own research and partly for satellite projects. Senior Researchers lead their scientist groups, and Project Coordinators manage the projects. The Research Planning Division coordinates and supports all the activities from the management side.
The system and information group supports development and operations of computers and network systems. EORC conducts research on future space-borne sensors, and develops and operates ground systems in EOC.
O O f f f f i i c c e e o o f f S S p p a a c c e e A A p p p p l l i i c c a a t t i i o o n n s s
OSA
President of JAXA
PMID SAPC
Other Depts., etc.
Y. Horikawa H. Kozawa T. Doura T. Fukuda
Fig. 1.2-1㩷Organization of OFFICE of Space Application as of March 2007
Technical Counselor
Y. Yasuoka
EORC
T. Doura
E E O O R R C C Ma M at t r r ix i x O O pe p e ra r at ti io on n o o f f R R e e se s e a a rc r ch h er e rs s
EORC
ALOS GOSAT TRMM/GPM
Project String
Discipline
String R. Oki
~4 ~ 40 0 R
Re es se e ar a rc c he h er r s s
M. Shimada
Fig. 1.2-2 EORC organization as of March 2007
Global Warming Eco-system Data Analysis
Water Cycle Disaster Risk
T. Moriyama K. Imaoka
GCOM
Y. Tange Instrumentation
Shimada
7 1.3 Science Projects
Science projects consist of several satellite projects and Earth science/application projects.
The JERS-1 science project, led by Dr. Masanobu Shimada, Senior Researcher at EORC, continues to process its L-band Synthetic-Aperture Radar (SAR) data to create global forest mapping and to develop analysis technology for applications to detect crustal deformation.
The ADEOS science project, led by Prof. Haruhisa Shimoda, Invited Researcher from Tokai University, continues to process OCTS and AVNIR data mainly for global change study.
The TRMM science project, led by Dr. Tetsuo Nakazawa, Senior Researcher at the Meteorological Research Institute, continues to process PR, TMI, VIRS and LIS data mainly for global change study and improvement of weather forecasting.
The ADEOS-II science project, led by Prof. Akimasa Sumi and Prof. Yoshibumi Yasuoka, Invited Researchers from the University of Tokyo, are improving algorithms to retrieve geophysical parameters from AMSR and GLI and studying a variety of science applications.
The ALOS science project, led by Prof. Ryosuke Shibazaki, Invited Researcher from the University of Tokyo, developed algorithms for orthographic mapping and DEM applications from PRISM, AVNIR and PALSAR. It also carried out the CAL/VAL of PRISM, AVNIR-2, and PALSAR.
The Greenhouse Gas Observing Satellite (GOSAT) was approved to advance into phase C/D. The augmented follow-on mission of a part of AMSR, GLI and SeaWinds aboard ADEOS-II, called
“Global Change Observation Mission (GCOM)” as well as Global Precipitation Mission (GPM) are being studied in phase A/B.
The Global Energy and Water Cycle Experiment (GEWEX) project, led by Prof. Akimasa Sumi, is primarily studying TRMM, ADEOS-II and AMSR-E data validation and applications for Asian Monsoon study and for data assimilation.
1.4 Individual Research Activities
About 40 researchers, including invited and post-doctoral researchers, conduct their own research as well as project activities as stated above. There were nine reviewed papers and letters and over 30 oral and poster presentations in calendar year 2006.
1.5 Major Activities
There were two successful H-IIA launches in fiscal year 2005. ALOS was successfully launched on 24 January 2006 by H-IIA F8, and Multi-functional Transport Satellite-2 㧔MTSAT-2), by H-IIA F9 on 18 February 2005, after the M-V rocket launched ASTRO-EII and ASTRO-F and a Russian Donieple Rocket launched OICETS/INDEX. The series of successful launches of two H-IIA launch vehicles in FY2005 following two successful H-IIA launches in FY2004 seems to suggest JAXA’s complete recovery to reliable operational launch services under the new president Dr. Keiji Tachikawa, who was appointed on 15 November 2004. It should be mentioned that TRMM celebrated its eighth anniversary of continuous observation of rainfall, after the discussion of NASA’s further operation beyond the formerly planned period. In addition, AMSR-E has also surpassed its mission design and will continue observations beyond the three-year design life time.
Future programs GOSAT and GPM were approved to advance into phase C/D, with planned
launch dates of 2008 for GOSAT and 2010 for GPM. In the GCOM mission, studies on improved sensors SGLI and AMSR-2, successors of GLI and AMSR/AMSR-E, have started.
TRMM/GPM
TRMM operation is entering its eighth year. Based on the accumulated data, we have compiled the seven-year rainfall record in the tropics. A new service, the EORC Tropical Cyclone Database integrating TRMM and Aqua/ADEOS-II database pages, is now open at URL (http://sharaku.eorc.jaxa.jp/TYP_DB/index_j.shtml). Access to the TRMM Tropical Cyclone Database increased in FY2004 because many typhoons struck Japan. New PR algorithms for V6 data production were developed, and V6 data processing began on 1 April 2004. Reprocessing of the PR data for 32 of 76 months was completed. The Second TRMM International Science Conference hosted by JAXA, NASA and NICT was held in Nara on 6-10 September. There were about 150 participants in total, and recent scientific results obtained from TRMM observation were presented. The Third Latent Heat Algorithm Workshop was held also on 10 September in Nara.
TRMM research activities based on the Fourth RA (FY2004-2006), mainly focusing on data applications, started in 2004, and the first interim report meeting attended by 22 PIs was held on 3-4 March 2005.
The Global Precipitation Mission (GPM) has proceeded to the phase-B study. The Fourth GPM International Workshop was held in June 2004 in the US. The first-term research (FY2003-2004) to develop the GPM/DPR algorithms in cooperation with three invited PIs has concluded, and the second-term research will begin.
ADEOS-II
Research and applications using ADEOS-II and AMSR-E aboard Aqua continued, standard data products were continuously evaluated and validated, and EORC continued upgrading the product version. Using archived ADEOS-II data sets and living AMSR-E and MODIS data, the capabilities for improving the numerical weather forecasting, fishery information service, and the sea-ice information service were demonstrated in Japan, and some other countries have reached the operational level. Data analyses of the acquired data sets reveal some important signals of climate changes such as the decreasing area of sea-ice cover in Arctic Sea by comparing anomalies or deviations in the years 2003 to 2006 from the average climatology. For the water and energy cycle observation and the global carbon cycle, ADEOS-II and AMSR-E aboard Aqua provided scientific data sets of essential variables required by major international research programs, and useful for scientific projects such as CEOP under WCRP, IGCO under IGOS-P, and UNEP.
In the fields of disaster monitoring and resources management, ADEOS-II and AMSR-E operations demonstrated global medium-resolution imagers to be very significant for the operational global monitoring such as visualization and quantitative estimation of damage and frequent revisiting capability for updating geo-informatics. In the long-term efforts to integrate multiple platforms, multiple sensors, and observations and models, this fiscal year is the first stage after each data product from each sensor has matured. EORC is continuing to produce new water and energy-cycle products using AMSR (water vapor over ocean), GLI (water vapor over land) and SeaWinds (sea-surface winds) and to develop a combined correction algorithm for AMSR and SeaWinds. Multi-sensor data sets for the atmosphere, ocean, snow and vegetation continue to be validated through comparative studies, and data continuity was improved. In efforts to integrate
9
satellite data and numerical weather forecasting, the Japan Meteorological Agency has explored AMSR-E data use in an operational system for heavy rain and typhoon track prediction. The Agency achieved positive impacts in experiments on events. These results prove the possibility of a future operational observation system from satellites. These results and the future mission concept were presented and explored in the AMSR/GLI Workshop and PI workshop held in Tsukuba in January 2007.
ALOS/JERS-1
The JERS-1 science project has been conducted over the last several years, but is now beginning to wind down. In order to prepare for PALSAR and PRISM high-level products, we generated the JERS-1 InSAR DEM for several sites and the JERS-1 OPS DEM (DSM) for the Japan area. The Global Rain Forest Mapping Project using JERS-1 SAR data has generated mosaic images of South East Asia, including Peninsular Malaysia, New Guinea, Sumatra, Java, Borneo, Sulawesi, and the Philippines.
After the ALOS launch on January 24, 2007, EORC concentrated on algorithm development and calibration/validation. During PRISM DSM/ORTHO algorithm development, we improved the algorithm to match the target accuracies using real GCP and sensor data. We also set up several calibration sites with Ground Control Points (GCPs) for geometric calibration. The PALSAR DEM/ORTHO algorithm was also improved, and the calibration sites have been set up in cooperation with scientists internationally in the ALOS calibration/validation team activities. We held two review meetings, one on October 23, 2006, and one on March 29, 2007. Through these two review meetings, we achieved the calibration goal set for PALSAR and PRSIM/AVNIR-2 before the ALOS launch. ALOS data acquisition simulations based on the observation requests for the calibration/validation and basic observation scenario were conducted to evaluate and improve the data acquisition plan and the simulation software itself. With regard to disaster mitigation, we responded to the Charter Call by generating and analyzing the ALOS images acquired and disseminating them to users.
The Kyoto and Carbon Initiative (K&C) project intends to quantify the carbon sink-source balance for five years using PALSAR and supporting optical sensor data. We organized one K&C Science Advisory Panel meeting to discuss the definition of high-level prototype products and the establishment of an international science team.
GOSAT
GOSAT is being developed through cooperation among MOE, NIES and JAXA. JAXA is primarily responsible for instrument and satellite development, launching, operational L0/L1 processing, and post-launch calibration; NIES and MOE are responsible for data utilization of L2 processing and further CO2 data applications. The project completed the preliminary design stage of satellite and sensors, passed the preliminary design review, and is proceeding to the phase-C/D detailed design.
The EORC research project is responsible for post-launch calibration and data utilization of other parameters such as atmospheric O3. We conducted the preliminary planning of calibration activity and algorithm development and proceeded into the phase-C study for detailed planning.
1.6 Affiliated Graduate School
EORC is affiliated with graduate schools of two universities in the field of Earth observation. A contract with Chiba University concerning cooperation between EORC and their Graduate Schools was made on March 31, 1998, and that with Tokai University, on February 18, 2004. As a part of this cooperation, EORC provided lectures in Tokai University by dispatching personnel as affiliate professors in Fiscal Year 2006.
11
ͣ͑͟Ͷ΄ͶͲʹ͑Ͳʹ΅ͺ·ͺ΅ͺͶ΄͑
0
2. RESEARCH ACTIVITIES
2.1 Research Programs and Projects 2.1.1 TRMM and GPM
1) Overview
TRMM is entering its tenth year of operation. At the end of September 2005, NASA and JAXA decided to operate the TRMM satellite until September 2009. However, after this decision, NASA changed their system to evaluate continuity of satellite missions, and now NASA evaluates all operating missions every two years. TRMM will be evaluated again in 2007, and the decision will be announced in the summer of 2007. There is no significant change of satellite operation from the previous year (2005). Based on the accumulated data, we have compiled a nine-year rainfall record in the tropics.
We have been intensively implementing the phase-B study of Global Precipitation Mission (GPM) .
2) Nine-year record of rainfall by Precipitation Radar㧔PR㧕
Fig. 2.1.1-1 Annual accumulated rainfall from 1998 to 2006 measured by PR.
2004 1999
2005 2000
2006 2001
2002
2003 1998
13
We have been evaluating the monthly rainfall in the tropics from 1998 to the present. The primary data of PR is the monthly rainfall map covering 35ºN to 35ºS. The observation area covers half of the Earth. We can clearly identify the regional features of rainfall such as those in the intertropical convergence zone (ITCZ), the arid desert, and the monsoon region and their inter-annual variations.
3) Research highlights
Re-processing of PR data by the latest algorithms (Version 6) for the whole observation period was completed in January 2005. Much research with Version 6 products has now been done.
As a result of applying the V6 algorithm independently developed for PR and TMI, the difference of estimated rain rate between PR and TMI has decreased in comparison with the V5 algorithm, though the TMI rain rate still tends to be greater than that of PR.
Fig. 2.1.1-2 Surface rainfall accumulation as zonal mean for land (1998-2004) derived from the V6 PR data (red line), the V6 PR-TMI combined data (purple broken line), and the V6 TMI data (blue dotted line).
4) Outreach
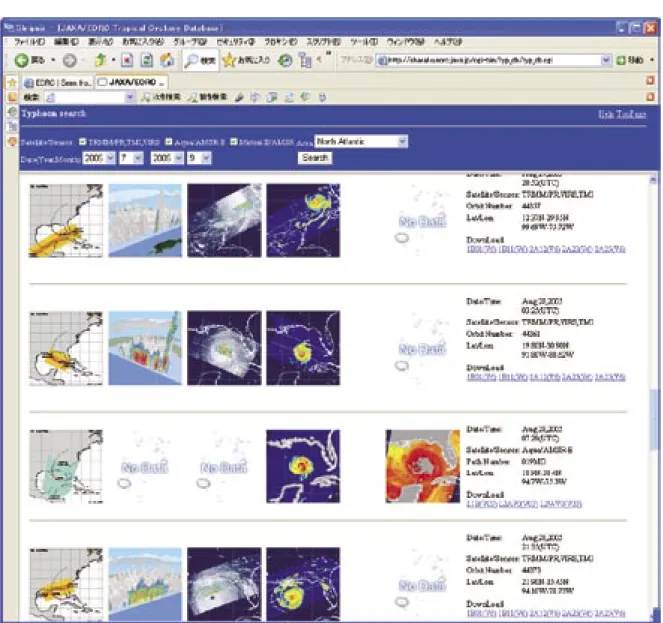
The EORC TRMM real-time Tropical Cyclone monitoring service, that was previously limited to only Pacific region, was extended to cover the entire globe in March 2007. Users can now access all tropical cyclone images observed by TRMM in near-real time, that is within 5 or 6 hours after observation. The URL of the TRMM real-time Tropical Cyclone monitoring service is:
http://www.eorc.jaxa.jp/TRMM/NRTtyphoon/index.htm
At the same time, the new service of EORC Tropical Cyclone Database, integrating TRMM and Aqua/ADEOS-II database pages, has been became operated since in June 2005 at the URL http://sharaku.eorc.jaxa.jp/TYP_DB/index_j.shtml. Users are easily able to search tropical cyclone images and data observed by TRMM/PR, TMI, VIRS, Aqua/AMSR-E and Midori-II on the same database page. Furthermore, three-dimensional cyclone images measured by TRMM/PR were avairable from this page so that users can look at brief 3D movies showing depicting detailed cyclone structures.
Fig. 2.1.1-3 An Example of the TRMM real- time Tropical Cyclone monitoring service web page.
15
Fig. 2.1.1-4 An Example of JAXA /EORC the JAXA/EORC Tropical Cyclone Tropical Cyclone Database Database web page.
5) International science workshop
The 6th GPM International Planning Workshop hosted by NASA and JAXA was held in November 2006 in the United States, where (GPM is the follow-on mission to TRMM, and its mission profile is shown below.) There were 136 participants from 11 countries and regions in total, and information on recent progress of GPM partners and users was exchangted.
6) Research announcement and research invitation a. TRMM Research Announcement (RA)
TRMM research activities based on the 4th RA (FY2004-2006), mainly focusing on data applications, started in 2004, and the final report meeting attended by PIs was held on March 5-6, 2007.
The 5th Research opportunity was announced in February to start the new joint TRMM research covering FY2007-2009 in February.
Constellation Satellites
• Microwave Radio- meters installed on each satellite
Frequent precipitation measurement
Expected Partners:
NASA, NOAA, ESA, CNES-ISRO China, others
3-hourly global rainfall map The Concept of
Global Precipitation Measurement (GPM)
2 satellites
8 satellites Blue: Inclination ~65º (GPM core)
Green: Inclination ~35º (TRMM)
Core Satellite
• Dual-frequency Precipitation Radar (DPR)
• Microwave Radiometer (GMI)
Highly sensitive precipitation measurement
Calibration for constellation radiometers
Fig. 2.1.1-5 The Concept of Global Precipitation Measurement (GPM) mission.
b. TRMM Research Invitation (RI)
Development of the next version (Version 7) of TRMM/PR algorithms as a three3-year research period (FY2004-2006) continues in cooperation with three invited PIs.
c. GPM Research Invitation (RI)
The second-term researches (FY2005-2006) started to develop the GPM/DPR algorithms in cooperation with three invited PIs.
16 2.1.2 GCOM
In addition to the continuous research activities using the ADEOS-II and AMSR-E data, we have been defining the mission objectives, examining appropriate sensor capabilities and performance, and investigating the feasibility of new products and algorithms of the Global Change Observation Mission (GCOM) based on the ADEOS-II experience. Therefore, we are going to use “GCOM” to cover all ADEOS-II and GCOM activities. Japanese fiscal year 2006 was the second year of the research activities solicited via the ADEOS-II 3rd research announcement. The activities covered algorithm development/improvement, validation, Earth science, model applications, and operational use of AMSR, AMSR-E, GLI, MODIS, and SeaWinds products. We held the AMSR/GLI Workshop on January 29 followed by the AMSR and GLI PI workshop on January 30 and 31. About 130 people attended the first-day workshop from various organizations including universities, governmental agencies, and private sectors.
Fig. 2.1.2-1 Group photos at PI workshops (Left, AMSR; Right, GLI)
GCOM consists of two satellite series: GCOM-W (Water) and GCOM-C (Climate). Each series will have multiple generations (e.g., three generations) with a one-year overlap to obtain long-term and consistent data records. GCOM-W1 and GCOM-C1 are the first-generation satellites of the GCOM series. The Advanced Microwave Scanning Radiometer 2 (AMSR2) and the Second-generation Global Imager (SGLI) will be the mission instruments of GCOM-W1 and GCOM-C1, respectively. The GCOM-W1 mission was evaluated by JAXA internal reviews and the Space Activities Commission (SAC) of Japan in this fiscal year. In consequence, the GCOM-W1 project team will be set up at the beginning of JFY 2007. We have also prepared for the system requirement review for GCOM-C1 in this fiscal year. We will try to take the GCOM-C1 mission forward into the next stage in JFY 2007.
1) Research and data analysis for AMSR and AMSR-E
The AMSR-E instrument had successfully completed its three-year mission life in 2005 and is continuing to perform global observation. Data products are being used by a wide variety of scientific programs and communities including the Coordinated Enhanced Observing Period (CEOP) and the Global Data Assimilation Experiment (GODAE). All the operational users including the Japan Meteorological Agency (JMA), Japan Fisheries Information Service Center (JAFIC), the National Oceanic and Atmospheric Administration (NOAA), and Canadian Ice Service use the AMSR-E products continuously. The antenna motor torque has been gradually increasing from the summer of 2006. The operation team at JAXA’s Earth Observation Center is carefully monitoring this phenomenon. All other Aqua mission instruments, except the Humidity Sounder for Brazil (HSB), are still performing global observations.
We revised some of the retrieval algorithms for the AMSR and AMSR-E products and released the latest version (version-5) of geophysical products on March 12, 2007. The updated products include sea surface temperature (SST), sea surface wind speed (SSW), and sea ice concentration (SIC).
a. Calibration and data evaluation
Although post-launch calibration activities to improve the quality of brightness temperature (Tb) products were continued, we have not updated the Tb product version this year as we have identified issues in the current calibration procedure. Regarding the assessment of radio-frequency interference (RFI), we have investigated and discussed the C-band channel configuration of AMSR2 on the GCOM-W1 satellite based on the aircraft survey data acquired in the previous year jointly with the Flight Systems Technology Center of JAXA. At least over Japan, there is some RFI-silent frequency ranges around 7.3GHz. In consequence, we proposed the additional channels in 7.3GHz (350MHz) to help eliminate the RFI signals.
b. Algorithm development and validation
Retrieval algorithms for the EORC processing system have been updated by Principal Investigators (PI) and EORC researchers. This fiscal year, three of the EORC research algorithms, the SST, SSW, and SIC algorithms, were selected and implemented on the EOC operational processing system. Correction for SSW was incorporated into the SST algorithm in light of the air-sea temperature difference. Reduced SST errors were observed in some areas including around Japan and the east coast of North America. For the SSW algorithm, some improvements were made for the coefficients of the retrieval scheme and internal Tb correction portion. The SIC algorithm switches between two procedures depending on ice concentrations. The threshold of switching the procedures was changed. No changes were made for other algorithms.
c. Field campaigns
Two monitoring activities are now underway: the ADEOS-II Mongolian Plateau Experiment for Ground Truth (AMPEX) and snow-depth measurement at the Yakutsuk and Tibetan Plateaus. The former is being led by Professor I. Kaihotsu of Hiroshima University, and the latter by Professor T.
Koike of the University of Tokyo, both as AMSR PIs. Since the monitoring sites of these parameters are quite sparse worldwide, the measurements are valuable and are expected to be maintained not only for the AMSR project but also for ALOS and related activities.
d. Other activities
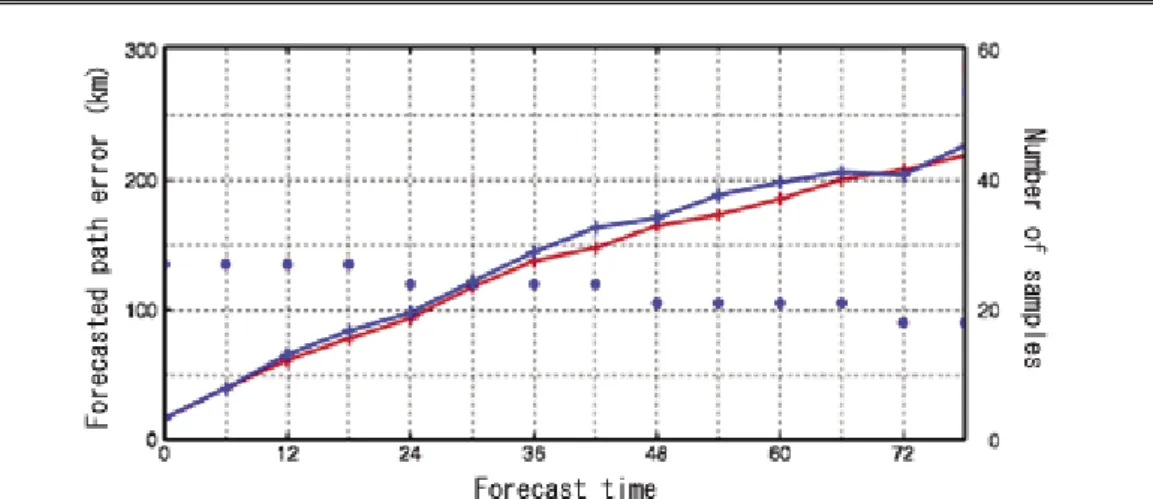
In addition to the application for the meso-scale numerical prediction model (used for small-scale weather forecasting around Japan), JMA started to use Tb values of microwave radiometers including AMSR-E for the global numerical prediction model on May 15, 2006. Water vapor information in the lower atmospheric layer can be provided by microwave Tb values. The accuracy of forecasting typhoon movement was confirmed to be improved by using the Tb information in the objective analysis of the global numerical prediction model. Figure 2.1.2-2 plots the forecast errors of typhoon movement for each forecast. The red line represents the forecast with microwave radiometer data; the blue line, that without the data. It can be seen that the red line is generally lower than the blue one. This indicates that the forecast accuracy was improved by using the microwave Tb values. The blue dots are the number of samples used for accuracy verification.
Figure 2.1.2-3 depicts observation areas of the five microwave radiometers used in the current analysis. The AMSR-E data (in green) covers oceans that are not covered by the other radiometers could not observe. Therefore, the AMSR-E measurements are imperative for covering the world’s oceans.
18
Fig. 2.1.2-2 Forecast errors of the center paths of Typhoons Nos. 11 to 18 in 2004 (courtesy of JMA).
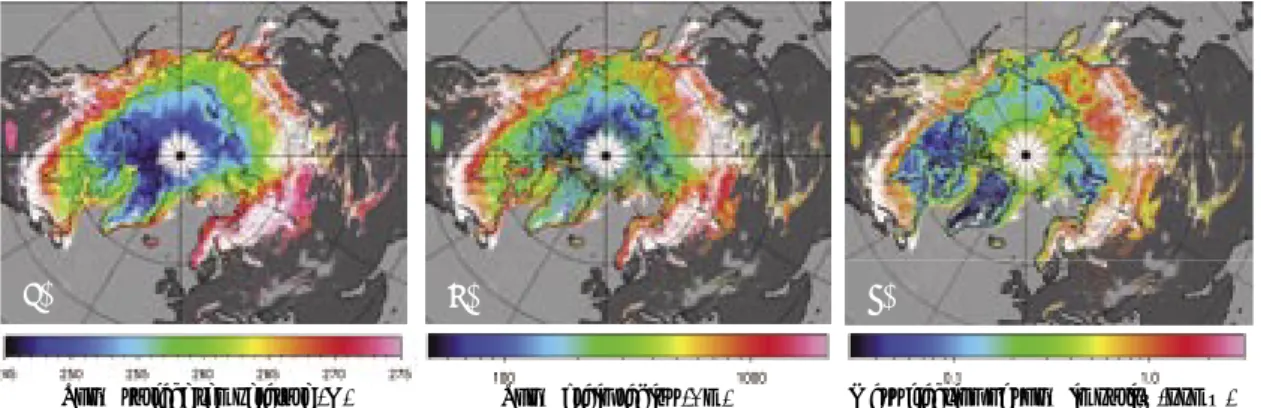
Fig. 2.1.2-3 Spatial distributions for microwave radiometer data. Green dots are for Aqua/AMSR-E, blue dots for TRMM/TMI, red dots for SSM/I-F13, orange dots for SSM/I-F14, and purple dots for SSM/I-F15 (courtesy of JMA).
The various AMSR-E images and data have been continuously updated. In JFY 2006, we opened a new page titled “SST anomaly in the northern high latitude ocean.” Figure 2.1.2-4 depicts the monthly SST anomaly in July of 2002 and 2006. Although the anomaly distribution differs year-to-year, the SST anomaly in the northern high latitude oceans has tended to exhibit positive values in recent years. This phenomenon is consistent with the decrease of sea-ice areas observed by satellite microwave radiometers including AMSR-E. Also, El-Nino and La-Nina events are continuously monitored and displayed on the “AMSR-E El-Nino Watch” page. The El-Nino event in late 2006 was clearly indicated by the AMSR-E observation as seen in the Fig. 2.1.2-5.
EORC ANNUAL REPORT
Fig. 2.1.2-4 Examples of monthly SST anomaly in northern polar region for July 2002 (left) and July 2006 (right) (from “SST anomaly in the high-latitude ocean” website).
Fig. 2.1.2-5 Examples from “AMSR-E El-Nino Watch” website. From top to bottom, AMSR-E SST distribution (pentad average), SST anomaly distribution, and time series of SST anomaly in the monitoring area indicated by black rectangular box in top and middle images.
20
Please visit our website “http://www.eorc.jaxa.jp/AMSR/” for more information and images.
2) Research and development on Global Imager (GLI) and Second generation GLI (SGLI)
The GLI researchers at EORC continued to analyze and validate GLI data products using standard and/or research algorithms. This year we conducted the following research.
a. Validation and re-analysis of GLI products
b. Analysis of long-term datasets for detecting climate change c. Development of new products for SGLI
a. Validation and re-analysis of GLI products
Improvement of the algorithm for retrieving precipitable water and its validation
Absorption coefficients of water vapor employed in the development of the standard GLI algorithm for retrieving precipitable water were replaced with high-resolution coefficients to reduce errors in this product. The uncertainty of the GLI precipitable water product was then estimated using data from sonde and microwave radiometers installed on the ground.
Figure 2.1.2-6 compares results between GLI precipitable water and sonde data. The current GLI standard algorithm based on low-resolution absorption coefficients of water vapor saturates in high precipitable water ranges (right image). After the water vapor absorption coefficients were improved, however, GLI data and sonde became much more consistent. Figure 2.1.2-7 compares GLI-derived precipitable water and that from ground-based microwave radiometer data. GLI data and microwave radiometer data are also very consistent, with an error of around 10%.
Fig. 2.1.2-6 Comparison of GLI precipitable water with sonde data. Left image is the results with high-resolution absorption coefficients; the right, with low-resolution coefficients.
Fig. 2.1.2-7 Comparison of GLI precipitable water with microwave radiometer data.
Left: Results for Hefei (China). Right: Results for SriSamrong (Thailand).
0
Comparison between GLI cloud and aerosol products and those of MODIS
Monthly mean MODIS products are compared with GLI products to evaluate the performance of the GLI algorithms in retrieving cloud and aerosol properties. Figure 2.1.2-8 illustrates GLI- and MODIS-derived cloud optical thicknesses. The parameters are very consistent except for the high-latitude area in the southern hemisphere.
Figure 2.1.2-9 illustrates GLI- and MODIS-derived cloud effective particle radii. The GLI radius tends to be smaller than that of MODIS.
Fig. 2.1.2-9 (a) GLI- and (b) MODIS-derived cloud effective particle radius, and (c) latitudinal distribution of both sensor products.
Fig. 2.1.2-8 (a) GLI- and (b) MODIS-derived cloud optical thickness, and (c) latitudinal distribution of both sensor products.
(c)
(a)
(b)
(c)
(a)
(b)
22
Figure 2.1.2-10 illustrates GLI- and MODIS-derived aerosol optical thicknesses (AOT). GLI AOT tends to be discontinuous around the equator, mainly from the lack of data due to the current sun-glint correction scheme and also seems to have erroneous peaks at 60 degrees south latitude probably due to cloud contamination. Thus, the schemes for sun-glint correction and cloud detection at low sun-elevation angles should be improved in future development.
Re-analysis of GLI snow products
GLI snow products (snow/sea-ice cover extents, snow temperature, snow impurity, snow grain sizes) were re-analyzed, and their quality was evaluated for future data release to the public (planned in FY2007). In this analysis, the composite scheme to generate 16-day average hemispherical datasets was also re-designed. Resultant products were found to have good quality and to exhibit spatially smoother distributions of snow parameters than the previous version (Fig.
2.1.2-11).
Fig. 2.1.2-11 GLI-derived spatial distribution of (a) snow-surface temperature, (b) snow-grain size, and (c) mass fraction of snow impurities averaged over April 7-22, 2003.
Fig. 2.1.2-10 (a) GLI- and (b) MODIS-derived aerosol optical thickness, and (c) latitudinal distribution of both sensor products.
(c)
(a)
(b)
Mass fraction of snow impurity (ppmw) Snow grain radius (Pm)
Snow surface temperature (K)
(a) (b) (c)
The retrieved snow-surface temperature and grain size can be used to generate a metamorphosis potential map of snow cover. This map indicates how the snow cover will behave physically in the near future. For example, fresh fine snow located under warm temperature tends to rapidly metamorphose to large particles (i.e., unstable) whereas re-frozen old snow under cold temperature tends to remain at it is (stable). Figure 2.1.2-12 presents examples of metamorphosis potential maps.
Fig. 2.1.2-12 Concept of the metamorphosis potential of snow cover (left) and the spatial and temporal variation of the potential (middle and right).
Finally, using the relationship between the snow-surface temperature and grain size, the melt on-set date and melt duration can be determined as depicted in Fig. 2.1.2-13.
b. Analysis of long-term datasets for detecting climate change
Vegetation index in the eastern Australia grain zone and chlorophyll-a concentration at the equator Fig. 2.1.2-13 (a) Melt on-set date and (b) melt duration
derived from GLI
snow-surface temperature and snow grain size parameters.
(SeaWiFS product by OBPG )
Fig. 2.1.2-14 (a) NDVI anomaly map in Australia of the 4th quarters in 2002 and 2006. (b) Temporal variation of NDVI values December 1997 to December 2006 extracted for the polygon area in (a).
4th quarter, 2002 4th quarter, 2006
(a) (b)
stable
unstable April 7-22, 2003
stable unstable
A B
April 23-May 8, 2003
Unstable snow cover at point A disappeared.
A B
Snow surface temperature䋨K䋩 Re-frozen old snow
Ј stable
Fresh fine snow Ј unstable
B A
Snow grain radius (Pm)
Melt onset date in 2003
Apil10 April30 May20 June9 June29 July19 Aug.8 Aug.28
Melt duration period (day)
(a) (b)
24
In 2006, eastern Australia suffered the worst drought in 1000 years. Wheat production was reported to decrease significantly and affected the crop trade market all around the world in that year. Figure 2.1.2-14 plots the 10-year NDVI trend in eastern Australia. NDVI in the 4th quarter in 2006 was lower than usual. Thus, the variation of NDVI indicates the effect of environmental stress (water, insolation, and temperature) on vegetation.
The figure indicates that a similar drought occurred in 2002 when there was a severe El Niño.
Figure 2.1.2-15 plots the 10-year anomaly trend of the equatorial chlorophyll-a concentration and the relation to El Niño events. In 2002 and 2006, two El Niño events occurred, which resulted in the unusual negative anomaly of the equatorial CLA. These El Niño events are clearly synchronized with the unusual lower NDVI values observed in eastern Australia.
In Fig. 2.1.2-15, another El Niño event, which is the strongest in the last 10 years, can also be identified in 1997-1998. However, the NDVI trend strangely exhibits no reduction in that period (see Fig. 2.1.2-14). These examples tell us how complicated the relationships between climate variables such as NDVI and CHA are. In some cases, the variables are teleconnected but not in others. Therefore, careful and continuous long-term monitoring of the Earth’s environment in various approaches is desired to further our understanding of the climate system.
c. Development of new products for SGLI
Atmospheric correction over land using GLI 380nm channel
A new scheme for atmospheric correction using GLI channel 1 (WL: 380nm) reflectance was developed for ocean and land applications. Figure 2.1.2-16 depicts the resultant performance of the atmospheric correction. Using the 380nm reflectance, both Rayleigh scattering and Mie scattering by aerosol particles are clearly eliminated from the resultant reflectance images, even over land areas. After the reflectances are validated with ground truth observations, this scheme would significantly contribute to enhancing the accuracy of land products in the future SGLI mission.
Fig. 2.1.2-15 Relation of the temporal variation of equatorial chlorophyll-a (CLA) concentration anomaly and El Niño events.
The CLA trend is depicted as a longitude-time
cross-section along the equator derived by four different optical sensors.
㪣㪸㩷㪥㫀ñ㪸
㪜㫃㩷㪥㫀ñ㫆 㪜㫃㩷㪥㫀ñ㫆
㪣㪸㩷㪥㫀ñ㪸 㪜㫃㩷㪥㫀ñ㫆
㪦㪚㪫㪪
㪞㪣㪠㩷 㪪㪼㪸㪮㫀㪝㪪
㪘㫈㫌㪸㩷 㪤㪦㪛㪠㪪
Southern Oscillation Index Sea surface temperature within the Enso-index region Niño-3
Fig. 2.1.2-16 Performance of the atmospheric correction scheme with and without using 380nm channel (GLI channel 1) reflectance.
Shadow index (SI) and water stress trend (WST)
New generation vegetation indices, shadow index (SI), and water stress trend (WST) are now being developed for monitoring biomass and for assessing vegetation health. SI is a measure of the shadow fraction within the IFOV and will be used for discriminating various vegetation types and also for assessing the health of plants, whereas WST is a trend of vegetation conditions under various water stresses derived from the variation in temperature.
Figure 2.1.2-17 illustrates the shadow index image of the Kanto area retrieved from GLI 250m-resolution data. The SI image clearly indicates the difference of vegetation types observed on the ground. The SI will contribute to monitoring the boundary of grass and forest areas and also to enhancing the accuracy of biomass estimation and land-surface classification.
Fig. 2.1.2-17 GLI false color RGB composite image (left) and retrieved shadow index image of Kanto area in Japan.
Only Rayleigh After the 380nm
RGB = Ch. 28, 23, 22
SI
2003/7/28-2003/8/12
Shadow index
low high
26
Fig. 2.1.2-18 MODIS-derived 6-year water stress trend (WST) in the eastern Asian region.
Fig. 2.1.2-18 depicts a water stress trend (WST) map of the eastern Asian region retrieved from six-year MODIS data. In the figure, the WST for each year is color-coded by comparing with that in 2000 when little water stress was observed. Seriously water-stressed areas include the Gobi desert and Tibetan Plateau areas, which implies that those areas are getting drier as compared with 2000.
d. Other research
Several other research activities are going on in the GCOM project.
Efforts to reduce uncertainty of radiation budget x Cloud process and properties
¾ Estimation of vertical structure of cloud particle size (Cloud convection process)
¾ Estimation of cloud bottom height by O2 absorption band (763nm) x Aerosol
¾ Evaluation of radiative forcing by aerosols using a ground observation system (SKYNET)
¾ Estimation of aerosol properties by GLI NUV (380nm) and combination with POLDER Polarimetry
¾ Evaluation of long-term trend of particle size of Asian ocean aerosols x Snow/ ice
¾ Estimation and process of snow-surface albedo considering snow grain size and impurities (dust and black carbon)
x Water vapor
¾ Improvement of column water vapor accuracy over land Estimation of primary production and carbon cycle
x Ocean Primary Production
¾ Evaluation and improvement of OPP algorithms by in-situ OPP observations in each ocean area
x Land Net Primary Production
¾ Construction of vegetation surface model database for multiangle satellite observation to 䂰 2000-2001
䂰 2000-2002
䂰 2000-2003
䂰 2000-2004
䂰 2000-2005
䂰 2000-2006
Stress in 2000
Stress in 200X
improve biomass estimation
¾ Estimation and evaluation of global land NPP Contribution to numerical models
x Structure of interactive development between numerical models and satellite observations Application possibilities
x Improvement (accuracy and temporal and spatial resolution) of microwave-TIR SST merging x New, quick technique of ocean color atmospheric correction
3) Data simulation service using radiative transfer
The GLI Signal Simulator (GSS) is a useful tool for the science and engineering community of Earth-observation satellites to simulate top-of-atmosphere radiance. Any scientist, engineer or general user can use it (http://bishamon.eorc.jaxa.jp/ENTGSS/index.html). GSS versions 6.4 and 6.5 were released this year. GSS ver.6.4 can be used by 10 people at the same time (previously two people). Also, comments for the execution time of each calculation are added to the HTML description for sensor channel selection.
4) Publication of a booklet and CD-ROM for GLI scientific results
We published a booklet and CD-ROM entitled “Improving Our Understanding of Climate change - Observing Our Planet Earth Using Global Imager” (ISBN4-906653-03-0), which contains many GLI images from research on Earth science using 10-month GLI datasets.
Booklet
CD-ROM
This CD-ROM contains the PDF version of the booklet, which is also available at the following URL, http://suzaku.eorc.jaxa.jp/GLI/doc/GLI_BOOK_CD/START.HTM
16 2.1.3 ALOS
1) Overview
ALOS was launched on January 24, 2006, in a sun-synchronous polar orbit of 691km height with a 46-day recurrence cycle. It carried three high-resolution imaging sensors, highly accurate attitude sensors, and dual-frequency GPS receivers. The initial mission check and calibration were performed soon after orbit insertion. The ALOS research activities also started at the same time.
Data simulation
We compiled observation requests for ALOS calibration/validation and basic observation scenarios.
Using the mission simulation software and the satellite orbit data after the launch, we optimized the operation scenario and evaluated success rates for each observation request submitted by the ALOS users. The simulation results help us modify the observation plan to achieve higher data acquisition rates.
Data utilization system
The ALOS Geoscience and Application Processor (AGAP) generates the ALOS products for the ALOS science activities. It demonstrates that the computing system consisting of 64 Intel Pentium machines is suitable for data conversion from level zero to level 1.0; image processing of PALSAR data; high-level processing of PALSAR, PRISM and AVNIR-2 data; data archiving; and distribution of these data. Computing power is essential for processing the PALSAR data on a continental scale so it can be adapted for the Kyoto and Carbon Initiative project.
Calibration/validation (CAL/VAL)
The three sensors were calibrated and validated using the CAL/VAL sites deployed world wide.
Calibration and validation of the three ALOS sensors were concluded at review meetings on October 23, 2006, and March 29, 2007.
Algorithm development
We have tuned the routines of the PRISM DEM/ORTHO algorithm, which generates a DEM through a pixel-matching technique and a coarse-to-fine iterative technique. The JERS-1 OPS data was used to verify the method and to demonstrate that the algorithm could generate a DEM within a theoretical error limit. We have developed basic routines of the PALSAR DEM/ORTHO algorithm and confirmed the functions using the JERS-1 SAR data. The current version of the software can generate a DEM corrected for atmospheric delay using meteorological analysis data.
Kyoto and Carbon Initiative (K&C Initiative)
The ALOS Kyoto & Carbon Initiative is supported by the Global Forest Mapping program of JERS-1 SAR in the era of ALOS and ADEOS-II GLI. Using PALSAR as a principal data source, it organizes four themes (i.e., forestry, wetlands, desert and water, and SAR mosaic products) to support regional- to continental-scale data and information requirements for terrestrial carbon researchers (GTOS TCO Panel, IGOS-P GCO and IGOL Themes), environmental conventions (UNFCCC Kyoto Protocol and Ramsar Convention), and nature conservation. The K&C Science Advisory Panel / Science Team meeting consisting of some 20 scientists from 13 countries met at EORC from February 28 to March 3, 2006, to focus on defining high-level prototype products and the ALOS data acquisition plan. During the first three years after the ALOS launch, the Science Team, along with EORC, is to develop and subsequently generate verified, regional-scale prototype products, including forest and deforestation maps in four continents, flood duration maps in major
river basins, subsurface desert geomorphology maps in Africa, and 50-meter-resolution PALSAR mosaics of all land areas of the Earth.
PI activities
After the Initial Calibration phase was completed on October 24, 2006, JAXA started releasing calibrated ALOS standard products to the public including PIs. PI research agreements covering 101 of the 124 existing PIs (excluding JAXA PIs, and resigned or disagreeing PIs) were completed in 2006. JAXA issued the second ALOS Research Announcement (RA) on December 8, 2006, for researchers in Asian and Russian countries, based on the ALOS Data Node (ADN) concept that came into effect in 2006. By the March 2007 deadline, 128 effective research proposals were submitted.
2) Calibration and validation of PRISM and AVNIR-2
CALVAL during the initial calibration phase (May 16, 2006 to Oct. 23, 2006) resulted in the sensor characterizations and the radiometric accuracies of PRISM and AVNIR-2 almost meeting the goal (except for band-4 of AVNIR-2). However, the geometric accuracies were inadequate because the satellite attitude was not precise or the offset components (i.e., sensor alignments) were not evaluated.
In the operational phase after Oct. 23, 2006, we continued to improve the absolute accuracies of PRISM and AVNIR-2. We also continued to evaluate their stabilities.
a. Geometric calibration
PRISM and AVNIR-2 were geometrically calibrated in two steps, i.e. relative calibration and absolute calibration. The relative geometric calibration was done by evaluating and correcting parameters for band-to-band registration of AVNIR-2, and relative CCD alignments for PRISM.
The absolute geometric calibration was done by evaluating the sensor alignments for both AVNIR-2 and PRISM.
AVNIR-2
The uncalibrated band-to-band registration, which is referred to as band 3, was measured as -0.3 to +0.4 pixels errors, but was improved to less than 0.2 pixels (Fig. 2.1.3-1) by tuning the band-to-band registration parameters. Pointing angle dependency of the error is also improved using the GCPs as seen in Fig. 2.1.3-2.
(a) Before correction. (b) After correction.
Fig. 2.1.3-1 Improved band-to-band registration for AVNIR-2 (0 degree pointing angle, X direction).
18
(a) Before correction. (b) After correction.
Fig. 2.1.3-2 Improved sensor alignment for AVNIR-2 (Y direction).
PRISM
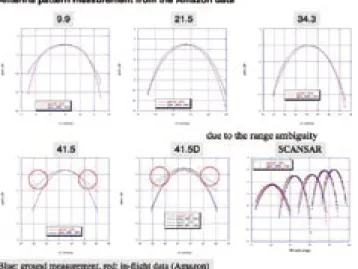
While the nadir radiometer has six CCD units to cover a 70km swath, the forward and backward radiometers have eight CCD units to cover the area viewed at nadir with time gaps of about 46 seconds as the Earth rotates. Alignments were measured on the ground before launch, but they might be changed due to vibrations of the launch and changes of thermal conditions in space.
Residuals of exterior orientations using 706, 943 and 734 GCPs were used to measure the on-orbit alignment. GCP residuals of exterior orientations, which are back-projected on the image space of the nadir with uncalibrated CCD alignment models, are shown in Fig. 2.1.3-3. Linear regression was applied to govern the deviation at each CCD unit in each sensor. We will keep monitoring its accuracy and variation with season and update them if necessary.
㪄㪌 㪄㪋 㪄㪊 㪄㪉 㪄㪈 㪇 㪈 㪉 㪊 㪋 㪌
㪇 㪌㪇㪇㪇 㪈㪇㪇㪇㪇 㪈㪌㪇㪇㪇 㪉㪇㪇㪇㪇 㪉㪌㪇㪇㪇 㪊㪇㪇㪇㪇
㪘㪹㫊㫆㫃㫌㫋㪼㩷㪧㫀㫏㪼㫃
㫍㫏㫀㩷㪲㫇㫀㫏㪼㫃㪴
1 2 3 4 5 6 CCD
㪄㪌 㪄㪋 㪄㪊 㪄㪉 㪄㪈 㪇 㪈 㪉 㪊 㪋 㪌
㪇 㪌㪇㪇㪇 㪈㪇㪇㪇㪇 㪈㪌㪇㪇㪇 㪉㪇㪇㪇㪇 㪉㪌㪇㪇㪇 㪊㪇㪇㪇㪇
㪘㪹㫊㫆㫃㫌㫋㪼㩷㪧㫀㫏㪼㫃
㫍㫐㫀㩷㪲㫇㫀㫏㪼㫃㪴
1 2 3 4 5 6 CCD
(a) X direction. (b) Y direction.
Fig. 2.1.3-3 Relative CCD alignments at PRISM.
b. Radiometric calibration
Stripe noise needs to be eliminated during standard products processing. The power spectrum of the PRISM image in Fig. 2.1.3-4 shows that a high correlation appears at 1/2 cycle (sample number 2048) and a low correlation at 1/4 cycle (sample number 512). This means that stripe noises appears at every pixel or every other pixel. Zero filling and inverse FFT resolves this problem. Some images were recovered successfully (no stripes), but some were not. Additionally, we implement the averaging DN method to correct the odd-even DN difference.
Cross-calibration using the calibrated satellite data was adopted. We used two types of existing satellite data, a moderate-spatial resolution sensor and a high-resolution sensor.Moderate-spatial- resolution sensors (MODIS on TERRA and AQUA) are used to increase the number of evaluations; high-spatial-resolution sensors (ASTER, SPOT-5, and Landsat) are used to evaluate their pixel scale. Simultaneous observations with ALOS are difficult. We collected many test areas whose images look homogeneous and stable (White Sands, Lunar Lake, Rail Road Valley, and
0
Ivanpah Playa) and which were observed by ALOS and the other satellites within a one-day time difference and a five-degree difference of incidence angle as the line of sight.
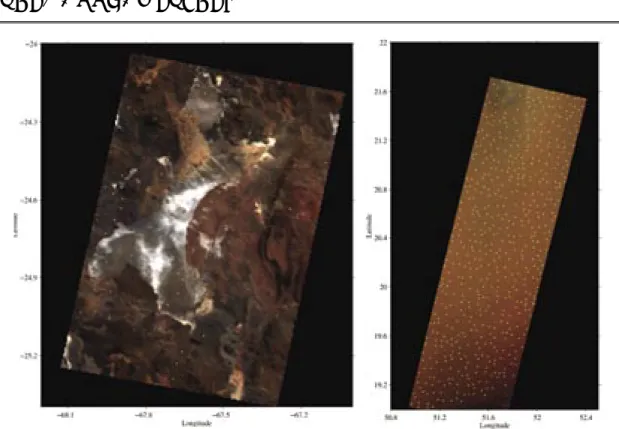
Figure 2.1.3-5 presents evaluation points for AVNIR-2 and MODIS. The left image is Arizaro Salt Lake, Argentina, where the altitude is about 4,000m and the atmosphere is stable. Arizaro was used for calibrating EO-1/Hyperion with the AVIRIS airborne sensor, and the surface reflectance was investigated during the campaigns. The right image is Rab Khali Desert, Saudi Arabia. The yellow dots indicate the evaluation points. The AVNIR-2 data were averaged over a 500m x 500m area.
The variance of digital number (DN) is within three percent, indicating a stable target. Figure 2.1.3-6 compares radiance (W/m2/str/micro-m) for each band without atmospheric correction between MODIS (x-axis) and AVNIR-2 (y-axis); the upper figure is a comparison with TERRA/MODIS, and the lower, a comparison with AQUA/MODIS. Figure 2.1.3-6 indicates good agreement between MODIS and AVNIR-2 except for band 4. The reflectance of band 4 of AVNIR-2 is below the estimate for MODIS. Table 2.1.3-1 summarizes the initial results of cross-calibration with MODIS, as derived from Fig. 2.1.3-6. The radiometric accuracies of AVNIR-2 are less than 4.6 percent for bands 1 to 3, and 15.6 percent for band 4.
Absolute calibration of PRISM involves AVNIR-2 using simultaneous images over Arizaro (Fig.
2.1.3-7) and exhibits good agreement.
c. Summary of calibration
Table 2.1.3-2 summarizes the calibration results of standard products (level 1B2) as of March 29, 2007. The satellite position and attitude are precisely determined. The relative geometric accuracies almost met design requirements. The absolute geometric accuracy of AVNIR-2 was improved. The absolute accuracy of PRISM depends on that of the pointing alignment parameter that will be continuously updated. The radiometric accuracies generally met requirements, except for stripe noise in PRISM.
0 0.1 0.2 0.3 0.4 0.5 0.6 0.7 0.8 0.9 1
0 512 1024 1536 2048
Cycles/4096pixels
Power
Fig. 2.1.3-4 Power spectrum of PRISM nadir image (CCD #4).
20
Fig. 2.1.3-5 AVNIR-2 image cross-calibrated with MODIS (Yellow dots denote evaluation points.
Left: Arizaro, Argentina. Right: Rab Khali Desert, Saudi Arabia.).
Fig. 2.1.3-6 Comparison of radiances between MODIS (TERRA (upper) and AQUA (lower)) and AVNIR-2 (Left to right: bands 1 to 4. Plots include results for six AVNIR-2 scenes.).
Table 2.1.3-1 Results of radiometric cross-calibration of AVNIR-2 and MODIS (as of March 29, 2007).
AVNIR-2 TERRA/MODIS AQUA/MODIS
Band Number Slope RMSR Number Slope RMSR
1 1910 0.978 2.2 % 1727 0.962 3.8 %
2 1922 1.046 4.6 % 1732 1.035 3.5 %
3 1804 0.999 0.1 % 1718 0.978 2.2 %
4 1575 0.851 14.9 % 1449 0.844 15.6 %
* Number: Number of evaluation points. Slope: Radiance ratio of AVNIR-2/MODIS. Ave: average of AVNIR-2’s radiance (W/m2/str/micro-m); and RMSR: root mean square of residual.