Effects of Sibship Size and Gender on Educational Attainment in Japan:
Analyses of JGSS-2006
Keiko HIRAO Faculty of Humanities
Sophia University
女子の高等教育進学選好に対する少子化の影響−JGSS-2006のコホート分析−
平尾 桂子
上智大学文学部
This paper explored the effect of sibship size on the educational attainment of men and women born in Japan between 1916 and 1986. The data used in this study come from JGSS-2006, which is a part of the East Asian Social Surveys Project. Using multinomial logistic regression, the odds of attending 4-year university and junior college vs. high school or lower, were estimated. I found that the negative effect of sibship size was stronger for women’s probability for attending 4-year university, but not for their attending junior college. The gender-specific negative effect was significant for the youngest cohort born after 1970 on women’s probability of attending 4-year university. These results suggest changing patterns of educational investment for daughters in Japan, in which gender per se is beginning to have weaker effect, but the constraints on the part of parents’ resources that interact with gender is determining parents’
willingness to invest in their daughters’ education.
Key Words: JGSS, educational attainment, sibling structure
教育達成に対するきょうだい数の影響、特に性別による相違について
JGSS-2006 を用いて検証した。使用したサンプルは、1916 年から
1986年生まれの男女
4254名である。
進学先を1)大学以上、2)短大・高専、3)高校以下のカテゴリー変数とする多項ロジス ティック回帰分析を用いて推定した結果、教育達成に対するきょうだい数の負の影響は特 に女子の
4年制大学への進学確率に対して強くはたらくこと、さらに、この交互作用は特 に
1970年以降生まれの若いコホートで有意に達していることが明らかになった。その一 方で、短大への進学確率に対しては、きょうだい数と性別の交互作用はどのコホートでも 有意に達していない。これらの結果から、女子の4年制大学への進学決定に対して、主に 性別による選択的教育投資から予算制約による選択的投資に移行していることが示唆さ れる。
キーワード:JGSS,教育達成,きょうだい構成
1. Introduction
When infant mortality declines along with economic development, the parents’ demand for
“quality” of their children surpasses the demand for their “quantity” (Becker 1981; Becker and Lewis 1973). Past research in the field of stratification and sociology of education supports this statement with the robust findings on the negative relationship between sibship size and educational attainment of children (e.g. Blake 1989; Steelman et. al, 2002; Blau and Duncan 1967). The resource dilution hypothesis has been one of the strongest explanations on this negative association (Blake 1989). It maintains that parents’ resources (both monetary and non-monetary) are “diluted” when shared among multiple children; thus each child receives a smaller amount of the resources as the number of their siblings increases. The causal mechanisms, however, are still subject to further scrutiny, because studies on the effects of birth order, spacing of birth timing, and gender composition have yielded mixed results (Steelman et al, 2002). A major body of the past literature is based on the data collected in the U.S., and thus little is still known about the patterns of parental investment in different cultural contexts, particularly where there is asymmetric preference on the sex of the children.
In the East Asian context, where there is strong preference for sons, the fertility decline has resulted in different fates for girls and for boys. As can be seen from the cases in China and Korea, for example, the demographic change has interacted with the existing patriarchal cultural values and resulted in intensified gender inequality. The gender-asymmetric effect of fertility decline includes an imbalance in the sex ratio among registered children, higher mortality rates among female infants, (Hull 1990; Park 1983; Ren 1995; Zeng et al. 1993), “feminization” of orphans (Johansson and Nygren 1991), and suspected selective abortion (Park and Cho 1995). Regarding the effect of sibling configuration on educational outcome, Greenhalgh (1985) demonstrated and Chu, Xie and Yu (2007) confirmed that parents in Taiwan sacrifice the educational opportunities of older daughters and use their earnings to subsidize the education of their younger brothers and sisters.
If Greenhalgh’s (and Chu, Xie and Yu’s) argument holds true across different stages of industrialization, we should expect “the historical residue of patriarchal institutions” (Greenhalgh 1985: 265) to remain in a highly industrialized society with a patriarchal background, such as Japan.
If, on the other hand, what Greenhalgh observed in the parental behavior in Taiwan was their transitional reaction to the rapid growth of market economy, we would expect to see, in an industrialized East Asian country, a different system through which parents allocate their resources to their sons and their daughters.
This paper explores the effect of sibship size on the educational attainment of men and women born in Japan between 1916 and 1986. Of particular interest is whether there has been a change in intra-family transfer of resources for boys and for girls. The last two decades in Japan have marked a rapid change in gender attitude, women’s status, and intergenerational relations. For one thing, the enrollment patterns for higher education have shown dramatic changes especially for women; more women are aspiring to 4-year university rather than junior colleges, which used to be a predominantly
“female track” for higher education. For the other, the sex preference has turned to favor daughters.
The shift of sex preference took place in the mid-1980s, which coincides with the time when women’s enrollment patterns for higher education began to change. In this respect, Japan presents a very interesting case for examining how demographic shift and changes in traditional values interact with each other and mediate the impact of gender on the intergenerational allocation of resources.
The project presented in this paper is a part of the East Asian Social Surveys Project (EASS
2006), which investigates family structure and relations in Japan, Korea, Taiwan and China. The
strength of EASS Project is that it uses comparable questionnaires (wording and scales, etc). The
findings presented in this paper are the first step toward comparable research in the East Asian context.
First, I will discuss the contextual background on how Japanese educational system is structured vis-à-vis intra-family transfer of resources on men and on women. Second, I will describe the data and method used in this research, followed by the results and conclusion.
2. The Japanese Context
2.1 Gender Track in Higher Education
Many scholars have pointed out the gendered nature of higher education in Japan. The enrollment rates to “higher education,” when 4-year university and junior college are combined, the gender gap has now disappeared or even reversed. When we look at the enrollment rates by school types, however, there is a sharp distinction: a very small number of men would go to junior college, while junior college was an option that a majority of women were tracked into.
Shinotsuka (1995), for example, points out that the increase in the female enrollment in “higher education,” especially until the early 1970s, occurred mainly in the women’s colleges and junior colleges that burgeoned in this period. The average annual growth rate in the women-only 4-year colleges was 4.5% between 1951 and 1971, while the overall number of 4-year universities increased at 2.8% during the same period. Expansion of junior colleges was even more dramatic; the average annual growth rate in the number of junior colleges, most of which accept only women, was more than 5.0% during the same period. Even though the post-World War II higher-educational system adopted coeducation as a principle, in reality the gendered track in higher education continued at least until the 1980s. The steady increase in the number of women-only universities and junior colleges during this period reflects the demand for sex-segregated education and the expectation that these institutions would provide different kinds of schooling for women.
Similarly, Japanese parents are known to hold different educational aspirations for boys and for girls. For example, even in 2002, when the Cabinet Office conducted the Second Basic Survey on Youth, 65% of parents of school-age boys answered that they want their child to proceed to 4-year university, while only 41% of fathers and 47% of mothers of girls hold the same aspiration (Cabinet Office 2002). In spite of such gender-differentiated aspirations for the educational attainment of their offspring, in the recent years there has been a significant change in the enrollment patterns for higher education.
Figure 1 shows the trends of enrollment rates for men and women by types of school. Solid lines represent male and broken lines represent female; solid dots are for 4-year university and white dots are for junior college respectively. (The “cohort” represents the breakdown of the birth cohort, which will be described in detail in the method section.) As in the case of other industrialized countries, there has been a gradual improvement in educational opportunity, but the distinct gender segregation in higher education is apparent. It was only in 1996 that the women’s enrollment rate for 4-year university surpassed that for junior college.
This structural change is more apparent in figure 2 where the actual number of students admitted
every year to each type of school is plotted along with the changes in the cohort size of 18 year-olds
(solid black line). It shows that the male enrollment number for 4-year university stays around
370,000 in the 1990; the increase in the enrollment rate for male was mainly due to the decline of the
denominator, the cohort size. On the other hands, the number of women enrolled in 4-year university
increased from 104,000 in 1985 to 250,000 in 2002, while the number of women enrolled in junior
college dropped from 236,000 in 1993 to 93,000 in 2004. In other words, the gender track of higher
education is changing both in enrollment ratio and in actual number of student admissions.
Figure 1 Trends in Enrollment Rates by School Type and Sex 0.0
10.0 20.0 30.0 40.0 50.0 60.0
1954 1956
1958 1960
1962 1964
1966 1968
1970 1972
1974 1976
1978 1980
1982 1984
1986 1988
1990 1992
1994 1996
1998 2000
2002 2004 Year
%
Male University Female University Male JC Female JC
Cohort <=1945 Cohort 1946-1955 Cohort 1956-1970 Cohort 1970+
Source: Basic School Survey and Census, various years
0 50,000 100,000 150,000 200,000 250,000 300,000 350,000 400,000
1955 1957
1959 1961
1963 1965
1967 1969
1971 1973
1975 1977
1979 1981
1983 1985
1987 1989
1991 1993
1995 1997
1999 2001
2003 Year
Male 4-year Univ Female 4-year Univ Female JC Cohort Size of 18 Year-olds by 100)(
Source: Basic School Survey and Census, various years First Baby-boomer
Second Baby-boomer
Figure 2 Trends in the Actual Number of Students Admitted to Different Types of Higher Education by Sex and the Cohort Size of 18 Year- olds
Has the declining fertility, which translates into declining number of children per family, affected the parents’ investment patterns for children’s education? Does the negative effect of sibship size affect boys and girls in the same way? These questions constitute the core issue of this study.
2.2 Sex Preference
Another interesting feature of the Japanese fertility trend, when compared with other East Asian societies, is the weakening of son preference. As mentioned above, decline of fertility has somewhat intensified the son preference in China and Korea, but this was not the case in Japan.
According to the Twelfth National Fertility survey conducted in 2002, among the married women
who answered the ideal number of children to be “one”, 73% preferred the only child to be a girl.
Among those who answered the ideal number of children to be “two,” 12% chose “all females,” while only 1.9% chose “all males.” The pattern that favors female offspring has been observed since the Ninth Fertility Survey administered in 1987 and the tendency to prefer girls has gradually intensified (National Institute of Population and Social Security Research 2003). While the most popular answer has continued to be “two children, one of each sex,” parents now seem to prefer daughters when they are asked to choose between the two sexes.
We can also see the trend toward female preference in the expected fertility; for all categories of existing number of children, planned fertility was consistently higher for those who do not have any daughters. That is, those who do not yet have daughters are more willing to add children (Ministry of Health and Welfare 1993).
There has not been much research done to investigate the underlining structure of this shift in sex preference. Sakai (1992) reports regional differences as well as occupational differences: those living in Chugoku, Shikoku and Kyushu areas show relatively high proportions of son preference; those who are self-employed tend to prefer sons as well. He also reports some effects of attitudes on the value of children, suggesting a relative increase in the value of daughters as providers of elderly care.
Kojima (2003) reports that men are more likely to prefer sons, while women are more likely to favor daughters. Despite these intra-society differences, the overall weakening of son preference in Japan is apparent compared with the cases in Taiwan and Korea, where there still remains strong preferences for sons (Kojima 2006).
Whether distinctiveness of the Japanese case is a historical phenomenon or due to some structural difference is subject to further investigation. Some researchers, however, speculate that increased demands for emotional support and for actual care in parents’ older ages (e.g. listening to problems and keeping the social networks) account for the trend to favor girls over boys (Ministry of Health and Welfare 1993; Sakai 1996).
How do these changing attitudes on children’s value regarding their sex translate into the patterns in which parents allocate their resources for the education of their sons and their daughters? It is a key question to understand the implication of demographic change on gender structure. It is because education functions as an important indicator of the social status and economic well being of an individual through its ties with employment opportunities. In this sense, it is not too much to say that gender equality (or inequality) lies in the patterns of intra-family resource transfer.
3. Data and Method
The data used for this study come from the Japanese General Social Surveys (JGSS), a national representative survey project started in the year 2000. For the analyses of the study presented in this paper, I used the JGSS-2006, conducted in October - December 2006 among men and women between the ages of 20 and 89. The samples were drawn using a stratified two-stage random sampling procedure, stratified by regional block and by population size. The survey was administered via face-to-face interview for the core question items, along with self-administered modules, part of which were developed in accordance with the East Asian Social Surveys (EASS). The sample size is 4,254 with the response rate of 59.8%.
3.1 Dependent Variable
Past research has conventionally used years of schooling as an indicator of educational attainment.
This method assumes that the educational outcome can be measured in interval scale; the difference
between 14 and 15 years of schooling is the same as the difference between 12 and 13. However, I use categorical measurement in this study for two reasons. First, parents’ decision for educational investment for children is not continuous; rather it is a discrete decision of 1) whether they want their child(ren) to proceed beyond high school;
(1)2) if so, which “type” of school do they want their child(ren) to attend. Second, the cost of education is not continuous; it costs extra money for the parents in the first year that their children proceed to the upper school. The extra costs include application and admission fees, registration fees, etc.; such one-time costs impose a heavier financial burden on the parents. Third, as shown in figures 1 and 2, years of schooling do not depict the gender-specific tracks in the higher education in Japan. As described above, a majority of men, when they are to attain tertiary education beyond high school, would go to 4-year university, while until recently a majority of women were tracked into junior college. It is only in the past ten years that this pattern has begun to change.
3.2 Explanatory Variables
Sibship size is defined as the number of children in the respondents’ family of origin, which is computed as a sum of elder/younger brothers and sisters (including the deceased) plus one (respondent). Therefore, if a respondent does not have any brothers or sisters, this would take a value of one (only child). Unfortunately, the JGSS does not ask the birth year of each sibling; therefore, we know the birth order and gender composition of the respondents’ siblings but not the spacing of birth timing. Also unavailable is their siblings’ educational outcomes, which prevents us from controlling unobserved heterogeneity of their family background. A dummy variable of female is coded as one if the respondent is female and otherwise as zero.
3.3 Controlling Variables
Controlling variables include birth cohort, fathers’ education, city size of residence and living standard at the age of 15. The birth cohort is coded as 1) 1916 -1945, 2) 1946-1954, 3) 1955-1970, and 4) 1970-1986. These categories roughly correspond with the 1) pre-World War II, 2) post-war baby boomers, 3) cohort born during the high economic growth, and 4) cohort born during the slow economic growth. The “birth cohort” in figure 1 shows the historical time when each cohort reached the age 18. The oldest cohort is used as a reference category. City size of residence at the age 15 is categorized into: 1) large city, 2) small-/mid-sized city, 3) township, and 4) village (reference category). Likewise, the living standard at the age 15 is categorized into: 1) far above average, 2) above average, 3) average, 4) below average, and 5) far below average (reference category). Father’s education is determined as “the last school attended” and is categorized as 1) 4-year university or higher, 2) junior college, 3) unknown,
(2)4) high school or lower (reference category).
3.4 Methods
I employ multinomial logistic regression with “high school or lower” as the reference category.
In the first stage, the main effect of sibship size and sex is estimated (MODEL I), and in the second
stage, the interaction term of sibship size and sex in added in the model to test if there is a different
effect of sibship size for men and for women (MODEL II). This procedure is adopted for the total
sample, and then for each cohort to investigate if there has been a change in the effect of the
explanatory variables.
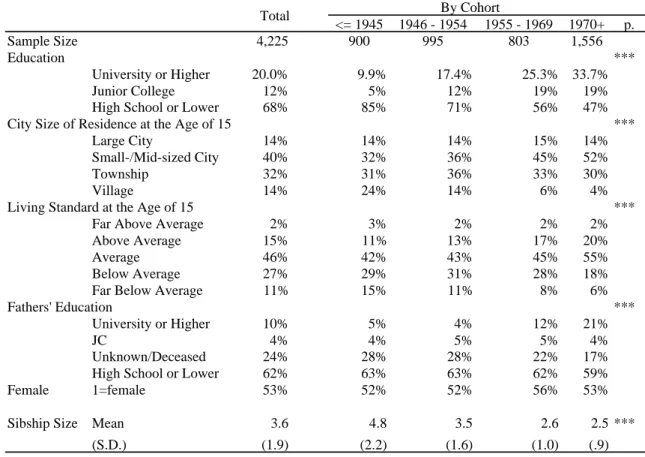
Table 1 Descriptive Statistics of Variables Used in the Analyses
<= 1945 1946 - 1954 1955 - 1969 1970+ p.
Sample Size 4,225 900 995 803 1,556
Education ***
University or Higher 20.0% 9.9% 17.4% 25.3% 33.7%
Junior College 12% 5% 12% 19% 19%
High School or Lower 68% 85% 71% 56% 47%
City Size of Residence at the Age of 15 ***
Large City 14% 14% 14% 15% 14%
Small-/Mid-sized City 40% 32% 36% 45% 52%
Township 32% 31% 36% 33% 30%
Village 14% 24% 14% 6% 4%
Living Standard at the Age of 15 ***
Far Above Average 2% 3% 2% 2% 2%
Above Average 15% 11% 13% 17% 20%
Average 46% 42% 43% 45% 55%
Below Average 27% 29% 31% 28% 18%
Far Below Average 11% 15% 11% 8% 6%
Fathers' Education ***
University or Higher 10% 5% 4% 12% 21%
JC 4% 4% 5% 5% 4%
Unknown/Deceased 24% 28% 28% 22% 17%
High School or Lower 62% 63% 63% 62% 59%
Female 1=female 53% 52% 52% 56% 53%
Sibship Size Mean 3.6 4.8 3.5 2.6 2.5 ***
(S.D.) (1.9) (2.2) (1.6) (1.0) (.9)
* p<.05 ** p<.01 *** p<.001
By Cohort Total
4. Descriptive Statistics
Table 1 shows the descriptive statistics of the variables used in the analyses. The educational attainment reflects the general improvement of educational opportunities. The city size of residence at the age of 15 shows general trend of urbanization, but not necessarily to large cities. The living standard at the age of 15, though statistically significant, shows little difference among cohorts, with approximately half of the respondents answering that their living standard in the past was “average.”
Fathers’ education shows increasing proportion of university attainment while more than half in every cohort have education of high school or lower. The average number of siblings shows a significant decline from 4.8 for the oldest cohort to 2.5 for the youngest cohort. Moreover, the variance is smaller among younger cohort, indicating the strengthening of “two children” as the norm.
5. Results
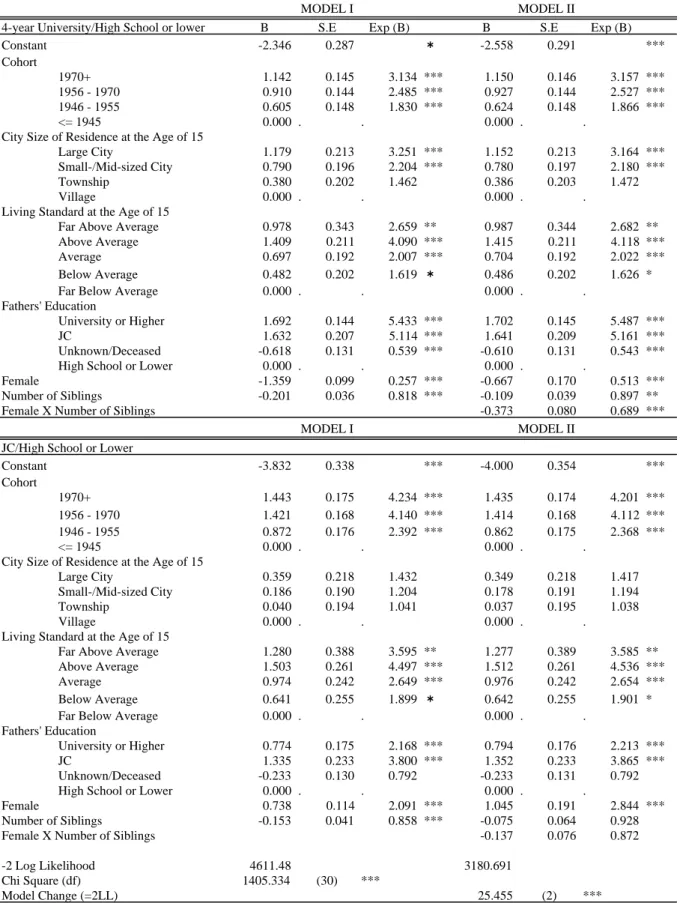
Table 2 shows the result of multinomial logistic regression on the total sample. In general, the younger cohorts have a higher chance of attending higher education. Living in the urban area, higher living standard, and having a father with higher education increase the odds of attending a 4-year university, but does not show any effect on the odds of attending a junior college. Being female substantially decreases the odds of attending a 4-year university but increases the chance of going to a junior college. Compared with men, women have about 25% probability of attending 4-year university, while there is about twice the chance of being tracked to junior college. The number of siblings decrease the probability of proceeding beyond high school; about 20% decrease in the chance with every sibling added to the family.
This negative effect of sibship size is stronger for women attending 4-year university (MODEL
II). With every sibling added to the family, men experience about 10% (1-.89) decrease in their
Table 2 Coefficients from the Multinomial Logistic Regression; Overall Samples
MODEL I MODEL II
4-year University/High School or lower B S.E Exp (B) B S.E Exp (B)
Constant -2.346 0.287 * -2.558 0.291 ***
Cohort
1970+ 1.142 0.145 3.134 *** 1.150 0.146 3.157 ***
1956 - 1970 0.910 0.144 2.485 *** 0.927 0.144 2.527 ***
1946 - 1955 0.605 0.148 1.830 *** 0.624 0.148 1.866 ***
<= 1945 0.000 . . 0.000 . .
City Size of Residence at the Age of 15
Large City 1.179 0.213 3.251 *** 1.152 0.213 3.164 ***
Small-/Mid-sized City 0.790 0.196 2.204 *** 0.780 0.197 2.180 ***
Township 0.380 0.202 1.462 0.386 0.203 1.472
Village 0.000 . . 0.000 . .
Living Standard at the Age of 15
Far Above Average 0.978 0.343 2.659 ** 0.987 0.344 2.682 **
Above Average 1.409 0.211 4.090 *** 1.415 0.211 4.118 ***
Average 0.697 0.192 2.007 *** 0.704 0.192 2.022 ***
Below Average 0.482 0.202 1.619 * 0.486 0.202 1.626 *
Far Below Average 0.000 . . 0.000 . .
Fathers' Education
University or Higher 1.692 0.144 5.433 *** 1.702 0.145 5.487 ***
JC 1.632 0.207 5.114 *** 1.641 0.209 5.161 ***
Unknown/Deceased -0.618 0.131 0.539 *** -0.610 0.131 0.543 ***
High School or Lower 0.000 . . 0.000 . .
Female -1.359 0.099 0.257 *** -0.667 0.170 0.513 ***
Number of Siblings -0.201 0.036 0.818 *** -0.109 0.039 0.897 **
Female X Number of Siblings -0.373 0.080 0.689 ***
MODEL I MODEL II
JC/High School or Lower
Constant -3.832 0.338 *** -4.000 0.354 ***
Cohort
1970+ 1.443 0.175 4.234 *** 1.435 0.174 4.201 ***
1956 - 1970 1.421 0.168 4.140 *** 1.414 0.168 4.112 ***
1946 - 1955 0.872 0.176 2.392 *** 0.862 0.175 2.368 ***
<= 1945 0.000 . . 0.000 . .
City Size of Residence at the Age of 15
Large City 0.359 0.218 1.432 0.349 0.218 1.417
Small-/Mid-sized City 0.186 0.190 1.204 0.178 0.191 1.194
Township 0.040 0.194 1.041 0.037 0.195 1.038
Village 0.000 . . 0.000 . .
Living Standard at the Age of 15
Far Above Average 1.280 0.388 3.595 ** 1.277 0.389 3.585 **
Above Average 1.503 0.261 4.497 *** 1.512 0.261 4.536 ***
Average 0.974 0.242 2.649 *** 0.976 0.242 2.654 ***
Below Average 0.641 0.255 1.899 * 0.642 0.255 1.901 *
Far Below Average 0.000 . . 0.000 . .
Fathers' Education
University or Higher 0.774 0.175 2.168 *** 0.794 0.176 2.213 ***
JC 1.335 0.233 3.800 *** 1.352 0.233 3.865 ***
Unknown/Deceased -0.233 0.130 0.792 -0.233 0.131 0.792
High School or Lower 0.000 . . 0.000 . .
Female 0.738 0.114 2.091 *** 1.045 0.191 2.844 ***
Number of Siblings -0.153 0.041 0.858 *** -0.075 0.064 0.928
Female X Number of Siblings -0.137 0.076 0.872
-2 Log Likelihood 4611.48 3180.691
Chi Square (df) 1405.334 (30) ***
Model Change (=2LL) 25.455 (2) ***
chance of attending 4-year university while women’s chance for attending 4-year university decreases
by 70% (1- .689 x .513). On the other hand, the sibship size does not have any effect for women
attending junior college, or rather, being female and having more siblings seems to slightly increase
the chance of being tracked to junior college, as the main effect of being female increases from 2.1 to
2.8 when the interaction is taken into account. In separate analyses, I tested the effect of gender
Table 3 Coefficients from the Multinomial Logistic Regression by Cohort
-1945 1946-54 1955-69 1970+
MODEL I MODEL I MODEL I MODEL I MODEL II
University/High School or Lower Exp (B) Exp (B) Exp (B) Exp (B) Exp (B) City Size of Residence at the Age of 15
Large City 7.61 *** 2.46 * 2.74 * 1.06 1.02
Small-/Mid-sized City 2.51 ** 1.82 2.56 * 1.07 1.02
Township 1.68 1.22 1.32 0.96 0.93
Village . . . . .
Living Standard at the Age of 15
Far Above Average 0.87 16.93 *** 1.78 4.04 4.52
Above Average 5.68 *** 8.34 *** 2.46 * 3.20 ** 3.45 **
Average 2.35 * 2.04 1.63 2.03 2.21
Below Average 1.57 2.15 1.46 1.47 1.55
Far Below Average . . . . .
Fathers' Education
University or Higher 8.65 *** 10.78 *** 4.69 *** 4.65 *** 4.67 ***
JC 6.10 *** 6.53 *** 6.27 *** 3.24 * 3.40 *
Unknown/Deceased 0.64 0.38 ** 0.49 ** 0.70 0.70
High School or Lower . . . . .
Female 0.09 *** 0.19 *** 0.27 *** 0.53 *** 1.27
Number of Siblings 0.94 0.72 *** 0.67 *** 0.63 *** 0.82
Female X Number of Siblings 0.54 **
-1945 1946-54 1955-69 1970+
MODEL I MODEL I MODEL I MODEL I MODEL II
JC/High School or Lower Exp (B) Exp (B) Exp (B) Exp (B) Exp (B)
City Size of Residence at the Age of 15
Large City 1.91 3.13 * 0.71 0.61 0.60
Small-/Mid-sized City 1.14 2.37 0.83 0.65 0.63
Township 1.19 1.89 0.63 0.65 0.64
Village . . . . .
Living Standard at the Age of 15
Far Above Average 2.17 8.76 3.67 4.60 4.77
Above Average 5.64 *** 10.80 ** 4.61 ** 2.56 2.66 *
Average 1.55 6.14 * 3.12 * 2.13 2.21
Below Average 1.13 3.30 2.01 2.28 2.35
Far Below Average . . . . .
Fathers' Education
University or Higher 4.17 *** 3.18 2.20 * 1.72 1.72
JC 4.32 ** 4.40 ** 3.31 * 3.71 ** 3.86 **
Unknown/Deceased 0.71 0.93 0.76 0.80 0.80
High School or Lower . . . . .
Female 1.25 1.83 * 2.93 *** 2.63 *** 3.93 **
Number of Siblings 0.95 0.81 * 0.82 * 0.59 *** 0.68
Female X Number of Siblings 0.77
-2 Log Likelihood 849.7 622.3 824.9 766.1 758.1
Chi Square 321.5 *** 245.6 *** 301.9 *** 197.7 *** 205.7 *
df 24 24 24 24 26
Model Change (=2LL) 8.005
* p<.05 ** p<.01 *** p<.001
composition of the sibling, particularly of the existence of brothers; however, neither elder nor younger brother showed any significant effect. (Results not shown.)
Table 3 presents the estimates from multinomial logistic regression applied for each cohort. The
model that includes the interaction effect of sibship size and sex is presented only when the model fit
is improved. In general, the negative effect of being female on the probability of attending 4-year
university shows a gradual decline; however, even for the youngest cohort born after 1970, women have only half the chance of attending 4-year university as men have. The interaction term of sibship size and sex is significant only for the youngest cohort for attending 4-year university, and when this term is added the main effect of sex is no longer significant. While the odds of women attending junior college show stable effect, the effect of sibship size is decreased for the youngest cohort. The effect of sibship size does not have any significant effect for women attending junior college, and adding this interaction term slightly increases the main effect of females attending junior college.
Having a father with higher educational background increases the chance of men and women going to 4-year university, but this effect is somewhat weaker for the probability of going to junior college. The declining effect of city size for 4-year college and no effect for junior college suggest increasing educational opportunities in the rural areas.
6. Discussion and Conclusion
This study explored the effect of sibship size on educational outcome of men and women born between 1916 and 1986 in Japan. The negative effect of sibship size is replicated in this study and I found that, when tested with the total sample, it is stronger for women attending 4-year college, but not for them attending junior college. Women are more likely to be tracked into junior college when parents decide to provide them with education beyond high school. The probability of women going to a junior college compared with that of men is approximately twice as much, regardless of the number of siblings.
The cohort analyses revealed that there is a gradual increase in the probability of women attending 4-year university and the negative interaction with the sibship size is found significant only for the youngest cohort born after 1970. In other words, for the cohorts born before 1969, the gender of the child was the most important factor, if not the only factor, when parents decided how much and to whom they would transfer their resources for the education of their offspring. This result is in accordance with the findings of Yano (1982), who found that the private return for women’s education in the 1970s was higher for junior college than for 4-year university. In light of his findings, it was a rational choice for parents to send their daughters to junior college, which provides higher return on educational investment with maximized chance in the marriage market. Yano (1996) also found that the private return for junior college declined in the 1980s, suggesting the declining market value of women with diplomas from a junior college.
It seems that the patterns of parents’ educational investment for their daughters is responding to this change and that they began to send their daughters to 4-year colleges. The effect of sibship size that disfavors women among the younger cohort, in a sense can be seen as a sign that the constraints on parents’ resources count more rather than the sex of the child per se. In other words, when a daughter does not have “competitors” for her parents’ resources, gender alone began to have a relatively smaller effect on her parents’ decisions about whether they are willing to provide 4-year university education.
Needless to say, there are more factors to be investigated on the direction and the degree of
changing patterns of educational investment for women in Japan. The results presented in this paper
will take on deeper meanings when I can extend the analyses in comparative terms. I hope to revisit
the findings of this study when the EASS data for other East Asian countries become available.
[Acknowledgement]
The Japanese General Social Surveys (JGSS) are designed and carried out at the Institute of Regional Studies at Osaka University of Commerce in collaboration with the Institute of Social Science at the University of Tokyo under the direction of Ichiro TANIOKA, Michio NITTA, Noriko IWAI and Tokio YASUDA. The project has been financially assisted by Gakujutsu Frontier Grants from the Japanese Ministry of Education, Culture, Sports, Science and Technology for the 1999-2008 academic years.
[Footnotes]
(1) The enrollment rate in high school is above 97%.
(2) The “unknown” category was created in order to maintain the sample size.
[References]