Effects of the ω-3 Polyunsaturated Fatty Acid, EPA,
in Suppressing Abdominal Aortic Aneurysm
Formation
Jack
ジャックHung
ホ ン-Wen
ウ ェ ンWang
ワ ンEffects of the ω-3 Polyunsaturated Fatty Acid, EPA, in
Suppressing Abdominal Aortic Aneurysm Formation
Department of Cardiovascular Medicine, Graduate School of Medicine
The University of Tokyo
Research supervisor: Professor Issei Komuro
Jack Hung-Wen Wang
1
CONTENTS
1. Abbreviations
pp. 2
2. Abstract
pp. 3 - 4
3. Introduction
pp. 5 - 19
4. Materials and Methods
pp. 20 - 31
5. Results
5.1. Effects of EPA on aneurysmal tissue remodeling
pp. 32 - 56
5.2. Effects of EPA on vascular calcification in the
aneurysm
pp. 57 - 65
6. Discussion
pp. 66 - 77
7. Acknowledgments
p. 78
2
1. ABBREVIATIONS
AAA Abdominal aortic aneurysm CCL CC-chemokine ligand
COX Cyclooxygenase
CT Computed tomography
ECM Extracellular matrix EPA Eicosapentaenoic acid
EVAR Endovascular aneurysm repair FACS Fluorescence-activated cell sorting FBS Fetal bovine serum
IL Interleukin IP Intraperitoneal LPS Lipopolysaccharide MMP Matrix metalloproteinase NFκB Nuclear factor κB OPG Osteoprotegrin
PBS Phosphate buffered solution PCR Polymerase chain reaction
PG Prostaglandin
PUFA Polyunsaturated fatty acid
RANKL Receptor activator of nuclear factor κB ligand TIMP Tissue inhibitors of metalloproteinase
3
2. ABSTRACT
Abdominal aortic aneurysm (AAA) is a prevalent vascular disease that can
rupture with a high rate of mortality. Inflammation and active remodeling of the aortic
wall have been suggested to be critical in its pathogenesis. Omega-3 polyunsaturated
fatty acids such as eicosapentaenoic acid (EPA) are known to reduce cardiovascular
events, but its role in AAA management remains unclear. Here, I show that EPA
attenuates murine CaCl2-induced AAA development. AAA tissues from mice fed an
EPA-diet appeared less inflamed and less calcified, and had relative preservation of
aortic elastic lamina compared to those from mice in the Control diet group. AAA
diameters were also significantly smaller in the mice fed an EPA-supplemented diet.
Mechanistically, Mmp9 mRNA levels and activity in the AAAs were reduced after EPA
treatment. Consistent with this finding, RAW264.7 macrophages treated with EPA
showed attenuated Mmp9 levels after TNF-α simulation. Another effect exhibited by
EPA was the suppression of AAA calcification, which was consistent with the reduction
in levels of the vascular calcification factor Rankl (Tnfsf11) in the mice treated with EPA.
Up-regulation of Rankl and Mmp9 levels was found to be temporally related in the early
4
Mmp9 expression in cultured peritoneal macrophages. These results demonstrate a
novel role of EPA in attenuating AAA formation via the suppression of
macrophage-derived MMP-9 as well as possibly via the suppression of aneurysmal
Rankl expression levels, and raise the possibility of using EPA for AAA prevention in
5
3. INTRODUCTION
Abdominal aortic aneurysm (AAA) is a disease involving the gradual and
irreversible dilatation of the abdominal aorta [1]. While aneurysms can technically
affect any part of the abdominal aorta, the term AAA is generally reserved for
aneurysms of the infra-renal aorta, which is by far the most common site of aneurysm
formation. Abdominal aortic aneurysms are common particularly in men older than 65
years of age and has a reported prevalence of 4-9% in men and 1% in women [2,3]. The
most important risk factors for developing the disease are advanced age, smoking, and
male gender [3,4]. Natural disease progression of untreated AAAs result in a high risk
of aneurysm rupture that has an associated mortality rate as high as 65% to 85% [3].
Therefore, current consensus on the clinical management of AAAs focuses on the early
diagnosis, monitoring, and if required, treatment of AAAs prior to rupture. However,
while AAAs can be easily detected with an imaging modality such as abdominal
ultrasound, diagnosis of this disease in its early stages prior to rupture remains difficult
because most patients do not present for clinical assessment as AAAs often remain
asymptomatic or are only associated with non-specific symptoms such as lower back
6
checkups or as part of AAA screening programs, particularly in those identified as being
at high risk of the disease.
The most commonly accepted clinical definition of an AAA is when the
maximum infra-renal abdominal aortic diameter exceeds 3.0 cm, although definitions
that use a maximum abdominal aortic diameter of more than 1.5 times that of the
expected normal diameter has also been proposed [4]. While current guidelines in the
clinical management of AAA remain region-specific across the world and each differs in
certain aspects, the major consensus that these guidelines share is to tailor management
based on the size of AAAs. In particular, most guidelines stipulate that patients with a
maximum infra-renal aortic diameter of 5.5 cm or greater should be referred to a
vascular surgeon for consideration of treatment, as evidence has firmly established that
AAAs larger than this have an exponential increase in the annual rate of rupture of 10%
to 22% that is much greater than the typical rates of complication of elective AAA
repairs [4,5]. Treatment options remain limited, however, with open surgical repair or
minimally invasive endovascular aneurysm repair (EVAR) being the only definitive and
curative treatment options for AAAs to date. Open surgical repair, as the name suggests,
involves a laparotomy, excising the aneurysmal tissue, and replacing with an aortic graft.
7
inserting a stent-graft via the femoral arteries into the aneurysmal lumen first, followed
by deployment of the stent-graft within the AAA so that the graft excludes the
aneurysmal sac from the circulation. This leads to a reduction in pressure on the
aneurysmal sac, which over time eventually undergoes thrombosis and decreases in size
[6]. The choice of treatment is typically dependent on several factors, such as clinical
characteristics of the patient (for example, whether or not the patient could cope with a
prolonged surgical repair, presence of comorbidities that would preclude the patient
from surgery, etc.), the anatomical characteristics of the AAA itself, and patient
preference. However, as AAAs are mostly a disease of the elderly, patients often have
numerous comorbidities (for example, concomitant cardiovascular or renal disease) that
reduce their suitability for surgical repair, leaving them with even fewer treatment
options in reality.
In light of the current limitations in surgical treatment, emphasis of current
basic and clinical research has focused on trying to uncover pharmacological therapies
that may be useful in the prevention or slowing of AAA development, thereby delaying or circumventing completely the need for surgical intervention. A number of pharmacological agents have been shown to suppress AAA formation in experimental
8
antibiotics, beta blockers, and anti-inflammatory agents. Given their potential in
limiting AAA progression, many of these agents have been investigated in various
human clinical trials [4,7,8]. However, results of most of the completed trials have been
disappointing in that the studied medical treatments had either no or only marginal
benefits in retarding aneurysm expansion [7,9-12]. While the administration of some of
these agents are nevertheless recommended in the optimal medical management of
patients with diagnosed AAAs, there remains an urgent need for a new and more
effective pharmacological therapy to be discovered for the prevention or slowing of
AAA development.
Over the last two decades, our understanding of the pathological mechanisms
underlying AAA development has improved dramatically. This is in part due to the
advent of animal models of AAA that has allowed researchers to investigate the
mechanisms of aneurysmal formation ever more closely and without having to use
human tissues, which is often a rare resource. There are currently three major animal
models of AAAs commonly used in this research field. The first is the induction of
murine AAA formation by the direct perivascular application of calcium chloride
(CaCl2) to the infra-renal aorta in mice. This was a modification of a technique
9
formation in rabbit common carotid arteries, which has since been adapted for use in
murine abdominal aortas [13,14]. By eliciting an inflammatory reaction in abdominal
aortas with CaCl2, the authors were able to obtain a doubling in the diameter of the
infra-renal abdominal aorta over a 3 week period after the AAA surgery. The second
animal model involves the continuous infusion of angiotensin II via subcutaneous
osmotic pumps into ApoE-/- or LDL receptor-/- mice over a 3 to 4 week period [15]. By
virtue of their genetic deficiencies of ApoE or LDL receptor, these mice have deranged
lipid profiles and were surprisingly found to produce AAAs with a high incidence upon
additional angiotensin II infusion. However, these AAAs are typically located in the
supra-renal abdominal aorta, a position that is markedly different from the most
common infra-renal site of human AAA disease. The third model is also a
chemically-induced AAA model that involves the direct infusion of elastase into the
infra-renal aorta. Elastase is infused via a micro-catheter inserted into the infra-renal
aorta at the level of the iliac bifurcation while the infra-renal aorta is temporarily ligated
at a level just below the renal arteries [16]. Elastase infused into the aorta disrupts and
destroys aortic elastic fibers, thereby leading to structural vascular wall weakness,
inflammation, and gradual AAA formation [16,17]. While each of these models differ in
10
central features, such as medial aortic wall degeneration and inflammatory response, are
shared across all three models. Despite some differences, these models have
nevertheless been utilized widely, with many of their findings translated to and
confirmed in human diseases as well.
Pathohistologically, the hallmark features of AAAs are the fragmentation of
elastin, which forms the elastic fibers that give arteries their elastic properties, and loss
of collagen, which provides tensile strength and maintain arterial structural integrity [3].
Loss of these connective tissue components within the abdominal aortic wall lead to
reduced vascular wall strength and eventual arterial dilatation, resulting in the formation
of an AAA. These fibers can be degraded by proteases, the most notable of which are
the matrix metalloproteinases (MMPs). MMPs are a family of zinc-dependent
endopeptidases that under normal conditions possess a variety of physiological
functions ranging from tissue remodeling to organ development [18]. MMPs are
secreted first in an enzymatically inactive “proform” state that becomes proteolytically
active once it is cleaved by other MMPs or serine proteinases [18,19]. In addition, and
more importantly, the proteolytic activities of MMPs in tissues are also regulated by
11
balance between tissue levels of MMPs and TIMPs thus maintains the degree of
proteolysis within physiologically acceptable ranges.
The first reports that described the presence of MMPs such as MMP-1, MMP-2,
MMP-3, and MMP-9 in human AAA samples emerged in the 1990s, when it became
clear that these enzymes were clearly associated with AAA development [20-23]. At
around the same time, it was also demonstrated that a variety of immune cells
accumulate in AAAs [24]. Together, these results began to paint a picture where AAA
formation in fact involves the orchestrated interactions between inflammatory immune
cells and proteolytic factors, thereby resulting in aortic connective tissue destruction and
eventual rupture. Numerous studies since then have revealed that inflammatory cells
and processes play a key role in the development of AAAs. Beginning with the
demonstration by Newman et al that MMP-9 co-localized to macrophages, the
professional phagocytic cells of the innate immune system, within human AAA samples
[22], Pyo et al and Longo et al went on to show that development of AAAs is
ameliorated in mice genetically deficient in MMP-2 or MMP-9 in their respective
landmark reports [16,25]. This and other subsequent studies provided the first and direct
causal evidence of the critical role of macrophage-derived MMP-9 and vascular smooth
12
Macrophages are major phagocytic cells that play critical and central roles in
the innate immune system. Their importance in many aspects of disease biology,
ranging from tumor angiogenesis [27] through to obesity and metabolic syndrome [28],
has been revealed over the last two decades. As a result, our understanding of these cells
and their numerous subtypes has also increased in an exponential fashion. The
developmental cascade of macrophages has been well defined. Tissue-resident
macrophages that contribute to the maintenance of tissue homeostasis are known to be
derived from circulating monocytes [29,30]. These monocytes originate from defined
myeloid progenitor cells in the bone marrow, and after undergoing a series of
lineage-committed steps of cellular differentiation, are subsequently released into the
circulation as monocytes. From there, these monocytes enter peripheral tissues to
maintain constant numbers of tissue-resident macrophages. Monocytes express the
myeloid cell surface markers CD11b and Ly-6C [29]. In particular, monocytes are
known to express Ly-6C in high levels (Ly-6Chi), but upon entering tissues to become
tissue-resident macrophages their Ly-6C expression markedly decreases to a low level
(Ly-6Clow) [29]. In addition, they also begin to express the macrophage marker F4/80
during the process of monocyte-macrophage differentiation in tissue, thereby making
13
Besides replenishing tissue-resident macrophages during homeostasis,
monocytes can also be actively recruited during the tissue inflammatory response. In
response to chemoattractant cytokines such as CC-chemokine ligand 2 (CCL2)
produced by the inflamed tissue, Ly-6Chi monocytes in the circulation are actively
recruited to and enter the tissue to clear pathogens and necrotic tissue as well as
orchestrate wound healing by becoming macrophages. In recent years it has become
evident that these inflammatory responses are not mediated by a single, homogeneous
pool of macrophages, but rather by distinct macrophage subtypes that perform particular
roles in a specific, temporally and spatially regulated manner. There are two, broad
subtypes: classically activated, inflammatory “M1” macrophages and alternatively
activated, wound-healing “M2” macrophages. This classification is by no means
exhaustive, and numerous studies have shown that other minor macrophage subtypes
with distinctively different functions exist as well [31]. Nevertheless, the M1/M2
paradigm is a useful platform for understanding macrophage function in tissue
inflammation and its resolution. Monocytes recruited in the initial stages of
inflammation become inflammatory M1 macrophages which, as their name suggests,
produce major pro-inflammatory cytokines such as tumor necrosis factor (TNF)-α,
14
activities so that they may carry out their role in host defences and mediate the events
that occur during the acute phase of tissue inflammation [31]. As this acute phase
subsides, the proportion of wound-healing M2 macrophages increases relative to M1
macrophages [32]. These M2 macrophages are characterized by the up-regulation of
markers such as arginase 1 (ARG1) and mannose receptor C type 1 (MRC1, also known
commonly as CD206), and they play an important role in the orchestration of the
resolution of tissue inflammation as well as tissue fibrosis that occurs due to an effort by
the body to heal the wound left over after the inflammatory reaction.
Besides macrophages, various other reports have also provided evidence of the
involvement of many other immune cells in the development of AAAs by using the
aforementioned animal models of the disease. These immune cells include T cells
[33,34], neutrophils [35], and mast cells [36]. In particular, Shimizu et al [37]
demonstrated that a specific subset of CD4+ T cells, otherwise known as T helper (Th)
cells, are particularly important for AAA formation. Th cells can differentiate into two
major subtypes of effector cells known as Th1 or Th2 cells. Th1 cells produce Th1
cytokines such as interferon (IFN)-γ that promote cellular inflammatory responses,
whereas Th2 cells produce Th2 cytokines such as IL4 that are important for driving
15
results of the report from Shimizu et al [37] suggest that a Th2 environment may
promote the formation of AAAs. This is an interesting factor to consider from the
experimental point of view, given that different strains of mice have been reported to
harbor different Th phenotypes. For example, the most commonly used mouse strain
C57BL/6 is known to be skewed towards a predominantly Th1 phenotype, whereas
BALB/c mice are reported to be skewed towards a Th2 phenotype. Indeed, AAAs
spontaneously formed when Shimizu et al [37] transplanted aortic segments from Th1
polarized mice into BALB/c mice, thereby demonstrating the importance of Th2
signaling pathways in the pathogenesis of AAAs. This suggests that the choice of mouse
strain when performing studies in experimental murine AAAs can also be a major factor
in affecting the outcome of the study.
Calcification is commonly found in various diseases such as chronic kidney
disease, atherosclerosis, and diabetes mellitus [38]. Indeed, AAAs are also often
observed to be associated with calcification [1], although the significance of
calcification in relation to AAA formation has not been reported. Our understanding of
the mechanisms underlying vascular calcification in general has markedly improved
over recent years. It is now well established that certain members of the TNF family of
16
Receptor activator of nuclear factor kappa-B ligand (RANKL), otherwise also known as
TNFSF11, encodes a protein that is involved in the maintenance of bone homeostasis
and metabolism. RANKL functions in the differentiation and activation of osteoclasts
(bone-resorbing cells), as well as T cell and B cell maturation, and is typically only
expressed weakly throughout the vascular system under physiological conditions [39].
However, its expression can be greatly up-regulated in calcified or atherosclerotic
vascular lesions especially when in the presence of calcium or cytokines such as IL6 or
IL17 [39]. RANKL binds to its receptor, the receptor activator of nuclear factor kappa-B
(RANK), which is normally found on monocyte/macrophage lineage cells; however,
RANK expression can also be up-regulated in endothelial cells and vascular smooth
muscle cells (VSMC) in a similar manner to RANKL [39]. In the setting of vascular
calcification, RANKL has been reported to activate RANK on VSMCs to lead to the
nuclear translocation of nuclear factor κB (NFκB), the well-known master regulator of
cellular responses to infection and inflammation, via an alternative activation pathway
involving BMP4 and cause calcification to occur [38]. Meanwhile, osteoprotegin (OPG)
is an endogenous decoy receptor that inhibits all functions of RANKL. Unlike RANKL
and RANK, OPG is constitutively expressed throughout the cardiovascular system. The
17
is exemplified by studies that showed the development of severe vascular calcification
in mice with a genetic deficiency in OPG, where RANKL levels increased with
unopposed function in the vascular system. In addition to the RANKL-OPG axis, recent
studies have also revealed that Runx2, a master osteogenic transcription factor,
up-regulates the expression of RANKL in VSMC by directly binding to its promoter
region and thereby lead to vascular calcification [40]. Indeed, this is further supported
by in vivo studies that showed that mice with a smooth muscle cell (SMC)-specific
genetic deficiency in Runx2 had markedly suppressed vascular calcification associated
with atherosclerosis [41]. These studies provide strong evidence for the involvement of
RANKL, OPG, and Runx2 in vascular calcification, although their involvement in
AAAs has not been reported yet.
Omega-3 (ω-3) polyunsaturated fatty acids (PUFAs) are a class of essential
fatty acids required for normal biological activity and function in living organisms.
These fatty acids are named “polyunsaturated” due to the presence of two or more
double bonds in their carbon chain chemical structure. Moreover, the designation “ω-3”
denotes the fact that the first double bond is found at the third carbon atom from the
omega end of the carbon chain, distinguishing these fatty acids from ω-6 and ω-9
18
marine fish-derived [eicosapentaenoic acid (EPA) and docosahexaenoic acid (DHA)]
[42]. From numerous clinical, epidemiological, and animal studies, ω-3 PUFAs have
been demonstrated to possess anti-inflammatory [43,44], anti-fibrotic [45], and
cardioprotective properties [46,47], and they are already being used widely as
pharmacological agents and nutritional supplements in humans. They have been
suggested to have various mechanisms of action, including the ability to reduce the
production of inflammatory eicosanoids by competing with arachidonic acid [42],
exertion of anti-inflammatory effects via ligand-receptor interactions with the G
protein-coupled receptor 120 [44], and activation of the active resolution of inflammation by ω-3 PUFA metabolites such as resolvin E1 and protectin D1 [48]. However, despite advances in our understanding of effects of ω-3 PUFAs, the precise
molecular mechanisms as to how they exhibit beneficial effects in each pathological
process still remain to be elucidated.
The role of ω-3 PUFAs in the management of AAAs has not been established. Given the pleotropic properties of ω-3 PUFAs, I hypothesized that ω-3 PUFA might also
suppress the formation of AAAs by attenuating tissue remodeling processes. By using
CaCl2 to induce the development of AAAs in mice, I show that EPA can attenuate the
19
processes. In addition, I also show that EPA suppressed vascular calcification in the
20
4. MATERIALS AND METHODS
Mice
Male 7 to 9 week-old BALB/cA mice were purchased from CLEA Japan
(Tokyo) and kept in a temperature and humidity controlled room with a 12-hour light
and 12-hour dark cycle. Mice were allowed unrestricted access to either a Control diet
(fish meal-free F1 chow, 362 kcal/100 g with 4.4% energy as fat; Funabashi Farm,
Chiba) or an EPA-supplemented diet (Control diet supplemented with 10% wt/wt EPA),
and preparation of the diets has been described elsewhere [49]. Briefly, ultrapure EPA
(>98.0% EPA) capsules were opened and the liquid EPA emptied into the fish meal-free
F1 chow in a Ziploc® freezer bag. The amount of EPA and F1 chow added was
calculated to produce an EPA-supplemented diet with a final concentration of 10%
wt/wt of EPA. The freezer bag was closed and the contents inside well mixed by hand
for five to ten minutes. The contents were then served in glass feeders to reduce the rate
of oxidation of EPA. Control diet was also served in the same type of glass feeder. All
experimental diets were freshly made once every two to three days. Ultrapure EPA was
21
The CaCl2-induced AAA model was performed as previously described [19,25].
Briefly, 4 days after the experimental diets were commenced, periaortic application of
500 mmol/L CaCl2 (Sigma-Aldrich) for 15 minutes was performed in mice
anaesthetized with intraperitoneal (IP) pentobarbital injection to induce AAA formation.
For mice that received sham surgery, NaCl instead of CaCl2 was applied periaortically
for the same period of time. Mice continued their experimental diets until sacrifice for
analysis. At the 6-week time point, infra-renal aortas were photographed under
microscopy prior to harvesting and the external aortic diameter was determined by a
blinded observer according to a previously described method [14]. All experiments were
approved by the University of Tokyo Ethics Committee for Animal Experiments and
strictly adhered to the guidelines for animal experiments of the University of Tokyo.
Histological analysis
Mice were first anaesthetized with IP pentobarbital injection and then perfused
with 10 mL ice cold PBS per mouse via cardiac puncture. Following this, mice were
perfusion-fixed with 20% Tissue-Tek UFIX (Sakura Finetek Japan), again via cardiac
22
UFIX, dehydrated, embedded in paraffin, and sectioned. Histological analysis was
performed by Elastica van Gieson staining according to standard procedures.
In vivo micro-CT imaging
Six weeks after induction of AAA formation by CaCl2, mice were
anaesthetized with IP pentobarbital injections and IV contrast (ExiTron nano 6000,
Miltenyi Biotec) was administered via the tail vein. While anaesthetized, the mice were
subjected to micro-CT imaging with the LaTheta LCT-200 CT scanner (Hitachi Aloka
Medical, Ltd.). After the procedure, mice were sacrificed to harvest infra-renal aortas
for further analysis. Quantification of aortic calcification was performed by taking 30
slices of the same anatomical section of infra-renal aorta in each animal and calculating the volume of calcification using the scanner’s standard image analysis software.
Quantitative real-time PCR analysis
Mice were first anaesthetized with IP pentobarbital injection and then perfused
with 10 mL ice cold PBS per mouse via cardiac puncture. Infra-renal aortas from
control- or EPA-diet-fed mice were harvested and placed immediately into RNAlater
23
using the RNeasy Fibrous Tissue Mini kit (Qiagen), and using the RNeasy Plus Micro Kit (Qiagen) for cells sorted by flow cytometry, according to the manufacturer’s instructions. For the purification of RNA from cultured cells, RLT buffer with β-ME
(Qiagen) was added to the cells directly, harvested, and subjected to homogenization
with the QIAShredder (Qiagen). Subsequent RNA purification was performed using the
RNeasy Mini kit (Qiagen) according to the manufacturer’s instructions. RNA
concentrations were measured using the NanoDrop 1000 spectrophotometer (Thermo
Scientific). Complementary DNA was synthesized using 200 ng to 1000 ng of RNA in
10 μl per sample with the SuperScript III First-Strand Synthesis System (Invitrogen).
Quantitative real-time PCR analyses were conducted using the QuantiTECT SYBR
Green PCR kit (Qiagen) with the LightCycler system (Roche). 18s rRNA served as the
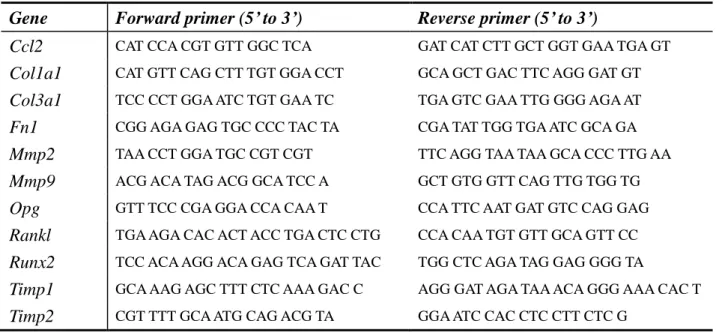
internal control in all experiments. Primer sequences of the analyzed genes are listed in
Table 1, and were designed using the Roche Universal Probe Library Assay Design
24
Table 1. Primer sequences of the genes analyzed by quantitative real-time PCR.
Gene Forward primer (5’ to 3’) Reverse primer (5’ to 3’)
Ccl2 CAT CCA CGT GTT GGC TCA GAT CAT CTT GCT GGT GAA TGA GT
Col1a1 CAT GTT CAG CTT TGT GGA CCT GCA GCT GAC TTC AGG GAT GT
Col3a1 TCC CCT GGA ATC TGT GAA TC TGA GTC GAA TTG GGG AGA AT
Fn1 CGG AGA GAG TGC CCC TAC TA CGA TAT TGG TGA ATC GCA GA
Mmp2 TAA CCT GGA TGC CGT CGT TTC AGG TAA TAA GCA CCC TTG AA
Mmp9 ACG ACA TAG ACG GCA TCC A GCT GTG GTT CAG TTG TGG TG
Opg GTT TCC CGA GGA CCA CAA T CCA TTC AAT GAT GTC CAG GAG
Rankl TGA AGA CAC ACT ACC TGA CTC CTG CCA CAA TGT GTT GCA GTT CC
Runx2 TCC ACA AGG ACA GAG TCA GAT TAC TGG CTC AGA TAG GAG GGG TA
Timp1 GCA AAG AGC TTT CTC AAA GAC C AGG GAT AGA TAA ACA GGG AAA CAC T
25
Zymography
Zymography is a simple technique that can be used to detect the functional
activity of MMPs present in tissue or cellular samples. For the assessment of MMP
activity in AAAs, mice were first anaesthetized with IP pentobarbital injection and then
perfused with 10 mL ice cold PBS per mouse via cardiac puncture. Infra-renal aortas
from mice in the Control diet or EPA diet groups were harvested and placed
immediately into liquid nitrogen. The frozen samples were homogenized in 2X lysis
buffer (containing 50 mmol/L Tris/HCl [pH7.5], 150 mmol/L NaCl, 1.0% IGEPAL
CA-630, 2 mmol/L EDTA) combined in a 1:1 ratio with 25X cOmplete EDTA-free
protease inhibitor cocktail (Roche Diagnostics). Protein concentration of each aortic
extract was determined with the DC Protein Assay (Bio-Rad). Zymography was
performed as previously described [50]. Briefly, 20 μg of total protein was equally
loaded onto each well of a Novex 10% Zymogram (gelatin) gel (Invitrogen) and
separated under non-reducing conditions at 125 V constant until the indicator dye
reached the bottom of the gel. The gels were then removed from the cassette, renatured
in renaturing buffer (2.5% vol/vol Triton®X-100 solution), developed with Novex
Zymogram Developing Buffer (Invitrogen), and stained with SimplyBlue SafeStain
26
at 300 dpi and the intensity of bands corresponding to MMPs were analyzed using
Image J (U. S. National Institutes of Health) image analysis software.
Flow cytometric analysis and cell sorting
For flow cytometric analysis of AAAs, mice were first anaesthetized with IP
pentobarbital injection and then perfused with 10 mL ice cold PBS per mouse via
cardiac puncture. Infra-renal aortas from control- or EPA-diet-fed mice were harvested
and placed immediately into PBS on ice. Three fresh, isolated infra-renal aortas from
the same experimental group were pooled into one sample for flow cytometric analysis.
Pooled samples were finely cut and placed in Hank’s balanced salt solution (with Ca2+
and Mg2+) containing 400 U/mL collagenase type II (Worthington Labs), 0.75 U/mL
elastase (Worthington Labs), and 60 U/mL DNase I (Sigma-Aldrich) at 37°C for one
hour with shaking to dissociate the aortic tissue into single cells. Cell pellets were
washed twice with ice cold FACS buffer (PBS containing 5% fetal bovine serum [FBS])
and suspended in 100 μL FACS buffer per 1 x 10⁵ cells followed by flow cytometric
analysis according to standard procedures.
For flow cytometric analysis of peripheral blood, mice were first anaesthetized
27
of peripheral blood was obtained via the inferior vena cava using a 30-G insulin syringe
that contained 10 μL of 1 U/mL heparin/PBS mixture (heparin from Ajinomoto
Pharmaceuticals). The blood was then added to a 1.5 mL Eppendorf tube containing 1
mL of 1 U/mL heparin/PBS mixture and placed at room temperature while the
procedure was repeated for all other samples. The samples were then centrifuged at
2000 rpm for 2 minutes at room temperature. The supernatant was discarded and 1 mL
of 1.2% wt/vol dextran/PBS mixture (dextran sulphate sodium salt from Amersham)
was added and the mixture placed at room temperature for 45 minutes. The supernatant
was then transferred to a new 5 mL polystyrene Falcon round-bottom tube (BD Falcon)
and centrifuged at 2000 rpm for 2 minutes at 4°C. The supernatant was discarded and 1
mL hemolytic buffer (to remove erythrocytes; composed of 100 mM NH4Cl and 17 mM
Tris-HCl, pH 8.0, in distilled H2O) was added to the cell pellet and left on ice for 3
minutes. Approximately 3 mL FACS buffer was then added to the mixture and
centrifuged at 2000 rpm for 5 minutes at 4°C. After discarding the supernatant, 3 mL of
FACS buffer was again added to the cell pellet and centrifuged at 2000 rpm for 2
minutes at 4°C. The supernatant was discarded and the cell pellet suspended in
approximately 300 μL FACS buffer followed by flow cytometric analysis according to
28
For both protocols, after suspension of the cell pellet in FACS buffer, 10 μL of
the cell suspension was removed for cell counting using the Countess® Automated Cell
Counter (Invitrogen) prior to performing Fc blocking. One microliter Fc block
(BioLegend) per 100 μL of cell suspension was added and incubated on ice for at least
15 minutes. The primary antibodies were then added at 1 μL per 100 μL cell suspension
and incubated on ice for 30 minutes. The cell suspension and antibody mixture was then
washed twice with ice-cold FACS buffer and filtered into a 5 mL polystyrene Falcon
round-bottom tube with cell-strainer cap (BD Falcon). The final cell pellet was
suspended in 1 mL FACS buffer and analyzed using the FACSAria II (BD). The
antibodies used for the analyses were anti-CD11b (clone M1/70) from eBioscience;
anti-F4/80 (BM8), anti-Ly-6C (HK1.4), and anti-Ly-6G (1A8) from BioLegend, as well
as the corresponding isotype controls for each antibody.
Giemsa staining of flow cytometry sorted cells
Cells sorted by flow cytometry were placed onto microscope slides by centrifuging the
cells at 1000 rpm for 3 minutes in the Cytospin 4 (Thermo Scientific). The cells were
then fixed with ice cold 100% methanol and air-dried. Giemsa staining was then
29
diluted in 1X pH6.4 PBS solution. Thirty minutes after staining, the cells were observed
under the microscope.
Peritoneal macrophages
Peritoneal macrophages were obtained as previously reported [51] with some
modifications. Male BALB/cA mice aged 8-10 weeks were IP injected with 2.5 mL of
3% thioglycollate medium (BD Difco). Four days later, the elicited peritoneal
macrophages were harvested by first sacrificing the mice and thoroughly sterilizing
their abdominal surface with 70% alcohol. A skin incision over the abdomen was made,
being careful not to puncture the underlying peritoneal lining, and 6 mL of ice cold PBS
was injected into the abdominal cavity and aspirated. This procedure was repeated twice
to obtain approximately 10 mL of PBS containing peritoneal cells. After the cells were
centrifuged at 1000 rpm at 4ºC, the supernatant was aspirated and the cell pellet was
resuspended in culture medium. Cells were plated at 3 x 10⁵ cells / cm2 in 6-well plates
so as to give a final cell confluency of 70 to 80%. Two to three hours after plating, the
30
Cell culture
Murine RAW264.7 macrophages were obtained from American Type Culture Collection and cultured in Dulbecco’s modified Eagle’s medium (DMEM; Gibco) supplemented with 10% FBS (Hyclone). Thioglycollate-elicited peritoneal macrophages
were cultured in DMEM/F12 medium supplemented with 10% FBS (Hyclone). All cells
were cultured at 37ºC with 5% CO2.
For the in vitro treatment of RAW264.7 macrophages with EPA, RAW264.7
macrophages were plated at 4 x 10⁴ cells / cm2 in 12-well plates and used immediately
after plating. Stock solutions of 150 mmol/L EPA (Cayman Chemical) were prepared and stored according to the manufacturer’s instructions until use. Culture medium containing EPA was prepared according to previously described methods for fatty acid
preparation, with some minor modifications [52]. Briefly, aliquots of the stock solution
of EPA were complexed with fatty-acid-free, low-endotoxin bovine serum albumin
(BSA; 10% wt/vol solution in H2O, Sigma-Aldrich) to give a 7.5 mmol/L working
solution, which was incubated at 37°C for 30 minutes. After incubation, the working
solution was added to warmed DMEM (supplemented with 10% FBS) to give a final
concentration of 10, 25, or 50 μmol/L. The vehicle solution was prepared similarly
31
control. After 48 hours of treatment with vehicle- or EPA-containing medium, 20 ng/mL
of recombinant mouse TNF-α protein (R&D Systems) was added and cells were
harvested for analysis.
For stimulation of peritoneal macrophages with mouse recombinant RANKL
protein (Miltenyi Biotec), the required amount of RANKL was dissolved in warmed
medium according to the manufacturer’s instructions, mixed well, and then added to the
cells that had their old medium aspirated. For vehicle control, the same volume of
sterile distilled water was used instead.
Statistical analysis
All data are shown as means alone or means ± SEM. Differences between two groups were analyzed using Student’s t-test, while differences between three or more groups were analyzed using one-way ANOVA followed by Tukey’s post-hoc test. P
values of less than 0.05 were considered to be statistically significant. Differences are
not statistically significant unless otherwise indicated. All statistical analyses were
32
5. RESULTS
5.1. Effects of EPA on aneurysmal tissue remodeling
Baseline mice characteristics were mostly not significantly different amongst the
experimental groups
In order to investigate the effects of EPA on murine CaCl2-induced AAAs, I
designed the study with three experimental groups: (1) Sham group that received
periaortic NaCl application (instead of CaCl2) and were fed the control diet, (2) Control
diet group that received periaortic CaCl2 application and were fed the control diet, and
(3) EPA diet group that received periaortic CaCl2 application and were fed the
EPA-supplemented diet. The preparation of the diets has been described in detail in the
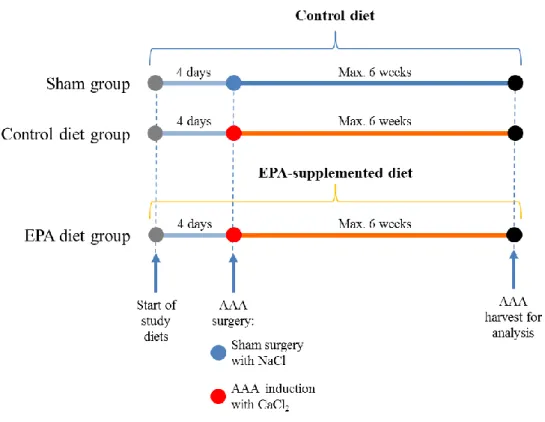
Materials and Methods section. The experimental protocol is outlined in Figure 1.
Prior to performing study analyses, I first had to (1) confirm the baseline
characteristics of mice after they have received control or EPA-supplemented diets and
(2) confirm the surgical procedure for inducing AAA formation in mice with periaortic
CaCl2 application.
As EPA is a fatty acid, there was a possibility that the EPA-supplemented diet
33
EPA diet groups after AAA surgery, which may affect the interpretation of results. In
addition, whether there were any differences in the amount of chow consumed between
the two groups also needed to be confirmed. To this end, I assessed these baseline
characteristics in the mice by recording their body weights on a weekly basis for 6
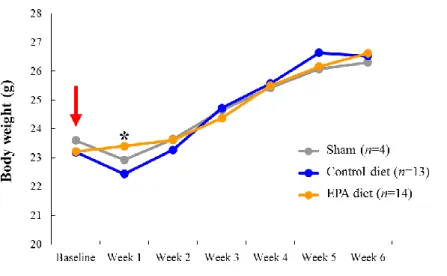
weeks as well as the amount of chow consumed daily. Interestingly, the results showed
that mice fed with an EPA diet had gradual increases in body weight over 6 weeks
despite having received AAA surgery, whereas the Sham and Control diet groups had an
acute decrease in body weight at 1 week after AAA surgery but then recovered from
Week 2 onwards to a level that was not significantly different to the EPA diet group
(Figure 2A).
Consistent with the body weight data, there was also no significant difference
in the mean daily amount of chow consumed between the two experimental groups
34
Figure 1. Study protocol. Mice in the Sham, Control diet, and EPA diet groups began
receiving the indicated study diets 4 days prior to AAA surgery. Sham group received sham surgery with NaCl periaortic application, and served as a baseline group for future comparisons and analyses. Control diet and EPA diet groups received CaCl2 periaortic
application to induce AAA formation. The respective study diets were continued for the duration of the study. Mice were kept for a maximum of 6 weeks after surgery until sacrifice for analysis.
35
Figure 2. Baseline effects of EPA on mice in the CaCl2-induced AAA model.
A. Body weights of mice in the Sham, Control diet, and EPA diet groups were recorded
weekly after AAA surgery (NaCl or CaCl2 application) was performed, as indicated by
the red arrow. Sham and Control diet groups received control-diet while EPA diet group received an EPA-supplemented diet. *P < 0.05, EPA diet group versus the Control diet group. B. Mean daily amounts of chow consumed by mice at baseline (prior to AAA surgery) in the Control diet and EPA diet groups. No significant differences were detected.
A
36
EPA treatment attenuates CaCl2-induced AAA formation and elastic lamina
destruction
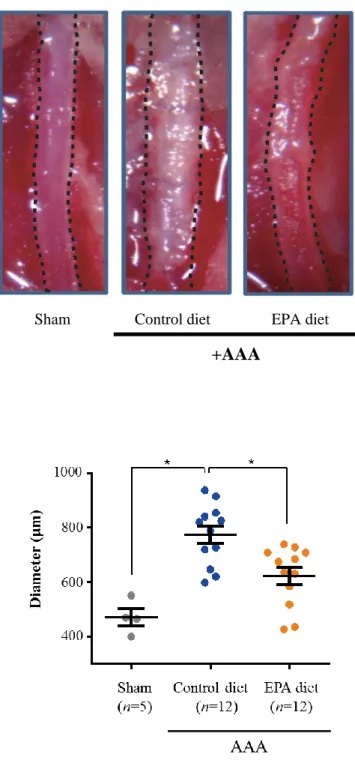
Next, I investigated the effects of EPA on AAA formation. Marked dilatation
and calcification of the aorta in the Control diet group was clearly visible
macroscopically 6-weeks after CaCl2 was applied to the infra-renal abdominal aorta; in
contrast, the aortas of the mice on the EPA-supplemented diet were dilated significantly
less than those of mice in the Control diet group (Figure 3A). The aortic diameters in
the Control diet group were shown to have increased to approximately 1.6 times that of
the aortic diameter of Sham group mice, therefore meeting the definition for aneurysm
formation (≥1.5 time increase in aortic diameter [34]). In contrast, the diameter of aortas
in the EPA group was only increased by approximately 1.3 times, and furthermore this
increase was not statistically significant. This therefore indicates that EPA treatment
attenuated the formation of CaCl2-induced AAA (Figure 3B).
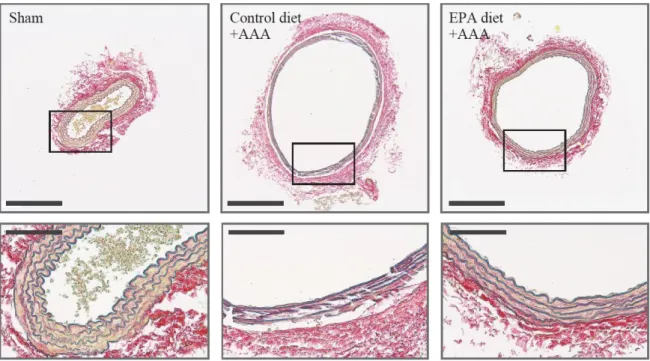
In order to assess the condition of the elastic fibers in the aortic wall, I
performed histological staining using the Elastic van Gieson (EVG) stain. EVG staining
is a well-established method for the visualization of arterial wall elastic lamina, and is
one of the most commonly used stains in the assessment of AAA histology. Histological
37
lamina destruction seen in Control diet group AAAs was greatly suppressed in aortas
from the EPA diet group (Figure 4). Higher magnification views showed that elastic
lamina strand breaks, a hall-mark feature of AAAs, are clearly seen in AAAs of the
Control diet group but were relatively absent in the EPA diet group. Taken together,
these results support the notion that EPA attenuates aortic dilatation via the suppression
of elastic lamina degradation, leading to the attenuation of vascular wall tissue
38
Figure 3. EPA attenuated aortic dilatation after CaCl2-induced AAA surgery.
A. Macroscopic appearances of in situ infra-renal aortas (demarcated by the black
broken lines) at 6-weeks after AAA surgery, showing a much less dilated infra-renal aorta in mice that received an EPA-supplemented diet compared to the Control diet
Sham Control diet EPA diet
+AAA A
39
group. Mice in the Sham group received sham AAA surgery (periaortic application of NaCl) and served as a baseline for calculations of fold-change in aortic diameter for the other two groups. Representative images of at least three independent experiments are shown. B. Quantitative analysis of the maximal external aortic diameters of aortas at 6-weeks after AAA surgery. *P < 0.05, NS, non-significant.
40
Figure 4. Administration of EPA preserves vascular wall structure in AAAs.
Histological analysis by Elastica van Gieson staining, showing preserved aortic wall structure and less elastic lamina strand breaks in the aorta of mice from the EPA diet group compared to the Control diet group. Scale bars: 200 μm (upper panels) and 50 μm (lower panels). Representative images of at least three independent experiments are shown.
41
EPA attenuated the CaCl2-induced up-regulation of MMPs but did not affect the
expression levels of TIMPs or other extracellular matrix components
Given this phenotype, I subsequently began to elucidate the molecular
mechanism underlying how EPA suppressed AAA formation. I first focused on
examining the mRNA expression of a set of genes related to tissue remodeling such as
MMPs and TIMPs. Among the genes analyzed by real-time PCR, the expression levels
of Mmp2 and Mmp9 were significantly increased in the aortas of mice in the Control
diet group at 1- and 3-weeks after CaCl2 application, consistent with previous reports
[19,21,25]. In contrast, mice in the EPA diet group had significantly lower levels of
Mmp2 and Mmp9 expression (Table 2). This suggests that because of the lower
expression levels of the MMPs critical to AAA formation, Mmp2 and Mmp9, the tissue
milieu in AAAs of mice in the EPA diet group may have been less proteolytic compared
to that of the Control diet group, thereby leading to less tissue destruction.
However, considering that the balance between proteolysis and anti-proteolysis
is determined by the levels of MMPs versus TIMPs, the levels of TIMPs also needed to
be evaluated so as to conclude that EPA does indeed reduce the proteolytic environment
of AAAs via the suppression of MMP up-regulation. To this end, the expression levels
42
showed that while the levels of TIMPs were also upregulated by the CaCl2 treatment,
EPA did not affect their expressions (Table 2).
Major changes in the components of the aortic wall extracellular matrix (ECM)
occur as a result of the significant tissue remodeling that is invariably associated with
AAA development. Therefore, I investigated whether or not EPA also had some effects
on these ECM components. Since collagen I, III, and fibronectin are known to be major
constituents of the aortic wall ECM [3,53], the expression levels of these factors in
CaCl2-induced AAAs at 1- and 3-weeks after surgery were assessed by real-time PCR.
The results showed that while the expression of all three ECM components did indeed
increase during AAA development compared to the Sham group, there was no
significant difference between the Control diet and EPA diet groups (Table 2). These
results indicate that in terms of tissue remodeling, the effects of EPA in attenuating AAA
formation is most likely exerted through its suppression of MMP up-regulation rather
than modulation of ECM components, resulting in a less proteolytic AAA tissue
43
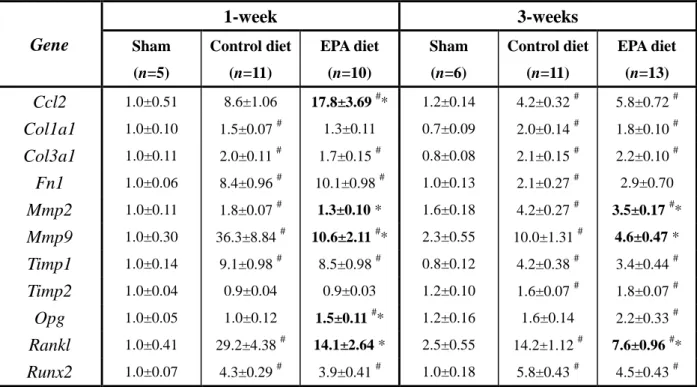
Table 2. Gene expression profile in 1-week AAAs analyzed by
quantitative real-time PCR. Gene 1-week 3-weeks Sham (n=5) Control diet (n=11) EPA diet (n=10) Sham (n=6) Control diet (n=11) EPA diet (n=13) Ccl2 1.0±0.51 8.6±1.06 17.8±3.69 #* 1.2±0.14 4.2±0.32 # 5.8±0.72 # Col1a1 1.0±0.10 1.5±0.07 # 1.3±0.11 0.7±0.09 2.0±0.14 # 1.8±0.10 # Col3a1 1.0±0.11 2.0±0.11 # 1.7±0.15 # 0.8±0.08 2.1±0.15 # 2.2±0.10 # Fn1 1.0±0.06 8.4±0.96 # 10.1±0.98 # 1.0±0.13 2.1±0.27 # 2.9±0.70 Mmp2 1.0±0.11 1.8±0.07 # 1.3±0.10 * 1.6±0.18 4.2±0.27 # 3.5±0.17 #* Mmp9 1.0±0.30 36.3±8.84 # 10.6±2.11 #* 2.3±0.55 10.0±1.31 # 4.6±0.47 * Timp1 1.0±0.14 9.1±0.98 # 8.5±0.98 # 0.8±0.12 4.2±0.38 # 3.4±0.44 # Timp2 1.0±0.04 0.9±0.04 0.9±0.03 1.2±0.10 1.6±0.07 # 1.8±0.07 # Opg 1.0±0.05 1.0±0.12 1.5±0.11 #* 1.2±0.16 1.6±0.14 2.2±0.33 # Rankl 1.0±0.41 29.2±4.38 # 14.1±2.64 * 2.5±0.55 14.2±1.12 # 7.6±0.96 #* Runx2 1.0±0.07 4.3±0.29 # 3.9±0.41 # 1.0±0.18 5.8±0.43 # 4.5±0.43 #
Messenger RNA levels of major MMPs associated with AAA formation, ECM components, and vascular calcification factors in infra-renal aortas at 1- and 3-weeks after AAA surgery were analyzed using real-time PCR. All expression levels were first normalized to 18s rRNA levels (house-keeping gene) and then presented as fold change over the Sham group value at 1-week. Results are mean ± SEM. #P < 0.05 vs. Sham
group of the same time-point; *P < 0.05 vs. Control diet group of the same time-point (further indicated in bold-type), one-way ANOVA with Tukey’s post-hoc test.
44
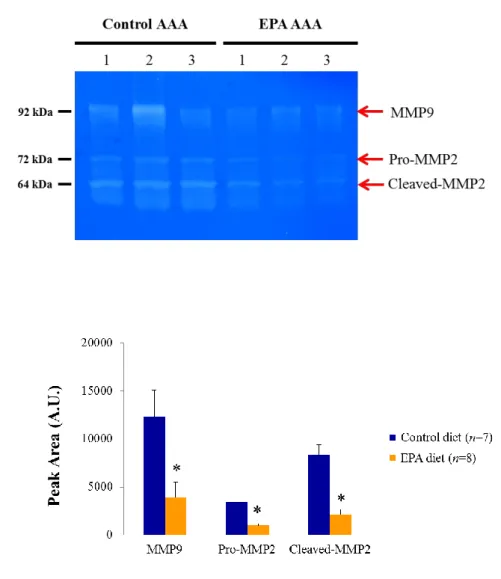
In order to confirm the decrease in MMP levels in AAAs by another method, I
performed zymography using 1-week AAA samples. Gelatin zymography is a
well-established technique to detect the functional activity of MMPs present in tissues
or cells [50]. To detect the activities of MMP-2 and MMP-9, the two MMPs that
appeared to be affected by EPA based on the real-time PCR results (Table 2), a gelatin
gel was chosen because gelatin is a substrate that can be degraded by these two MMPs.
Consistent with the results of real-time PCR, zymography showed that the functional
activities of pro-MMP-2, cleaved MMP-2, and MMP-9 were indeed all markedly
decreased in the EPA diet group compared to the Control diet group, suggesting that the
reduced mRNA levels of Mmp2 and Mmp9 translated to a significant difference in their
45
Figure 5. Reduced functional activities of MMP-2 and MMP-9 in AAAs after EPA treatment. A. Representative gelatin zymography gel showing reduced activities of the
proform of MMP-2 (pro-MMP2), cleaved form of MMP-2 (cleaved-MMP2), and MMP-9 in 1-week AAA samples after EPA-feeding compared to the AAAs of the Control diet group. Each lane represents a separate AAA sample within the same treatment group. Equal amount of protein (20 μg) was loaded per AAA sample. kDa, kilodalton. B. Quantitative analysis of zymographic MMP activities. Data are mean ± SEM of three independent experiments. *P < 0.05 versus Control diet group.
A
46
EPA suppresses Mmp9 expression in AAA macrophages
Previous reports have demonstrated that Mmp9-deficient mice are resistant to
experimental AAA formation [16,25]. Given that EPA seemed to impart a greater effect
on Mmp9 expression than on Mmp2, I decided to analyze specifically how EPA
suppresses MMP-9 activity in AAAs. Macrophages have been reported to be the major
producer of MMP-9 in AAA tissues [22,25,54]. Therefore, there were at least two
possible mechanisms by which EPA could have suppressed MMP-9 levels in the AAA:
(1) reducing the number of macrophages recruited to the AAAs, and (2) suppressing the
ability of macrophages to produce MMP-9.
Flow cytometry was used to test these two hypotheses. Since the number of
macrophages recruited to the AAA could be affected by the number of available
circulating monocytes as well as the level of chemoattractant cytokine, i.e. CCL2,
expressed by the AAA to recruit monocytes, I proceeded to investigate the number of
circulating monocytes, the number of macrophages in the AAAs, and the expression
level of Ccl2 in the AAAs of the Control diet and EPA diet groups. However, before
performing these analyses, the gating strategy for isolating macrophages needed to be
confirmed from a technical perspective. The cell surface markers of circulating
47
(to exclude granulocytes such as neutrophils) that are CD11b+ and Ly-6Chi in the
peripheral blood (Figure 6) [29,55]. Meanwhile in the AAA tissue, by first gating for
Ly-6G- cells from the dissociated AAA cells, macrophages could subsequently be
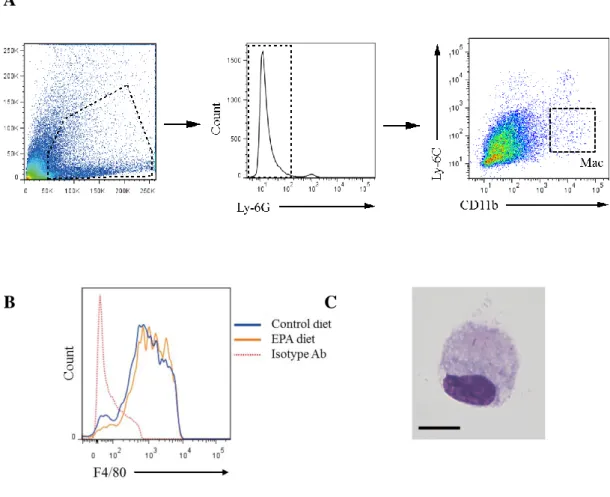
identified as Ly-6ClowCD11b+F4/80+ cells (Figure 7A, B) [32]. These macrophages were
isolated by fluorescence-activated cell sorting (FACS), and their cellular appearance
48
Figure 6. Gating strategy for the flow cytometric analysis of peripheral circulating monocytes. Representative flow cytometric plots of peripheral blood analysis are
shown. Living cells isolated from the peripheral blood of mice at 1-week after AAA surgery were first gated on Ly-6G (granulocyte marker), and Ly-6G- cells were further analyzed for expression of the myeloid markers Ly-6C and CD11b. Ly-6ChiCD11b+ cells were taken to be monocytes according to previous reports [29,55].
49
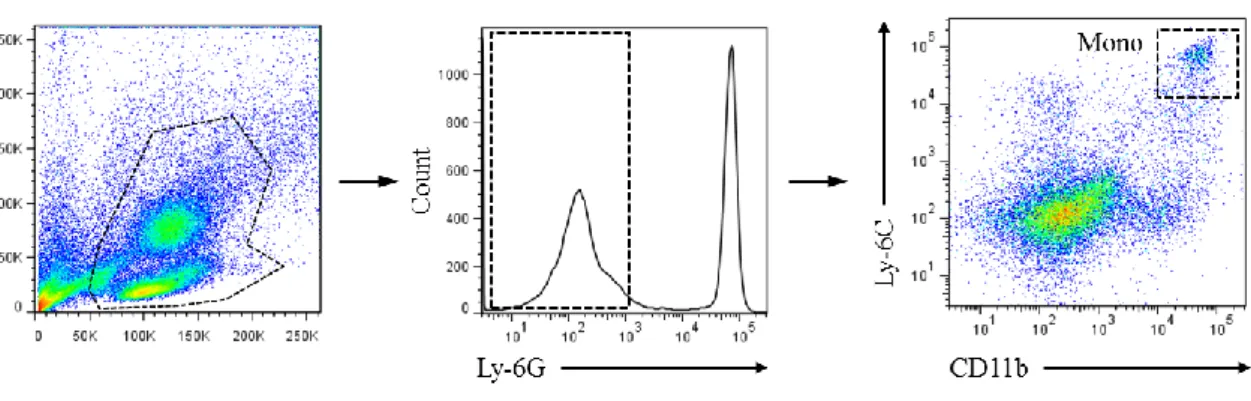
Figure 7. Gating strategy for the flow cytometric analysis of AAA macrophages.
Representative flow cytometric plots of AAA analysis are shown. Similar to the gating strategy for the peripheral blood analysis, living cells isolated from AAA tissues 1-week after the AAA surgery were first gated on Ly-6G, and Ly-6G- cells were further analyzed for expression of Ly-6C and CD11b (A); Ly-6ClowCD11b+ cells were shown to be positive for F4/80, a macrophage marker (B), and together Ly-6ClowCD11b+F4/80+ cells
were taken to be aneurysmal macrophages and used in all subsequent analyses.
C. Giemsa staining of sorted Ly-6ClowCD11b+F4/80+ cells from the aorta shows cells with the characteristic macrophage appearance. Scale bar, 10 μm.
A
50
Using these gating strategies to test my first hypothesis, I proceeded to assess
the number of monocytes in peripheral blood and the number of macrophages in AAAs
at 1-week after the surgery in the Control diet and EPA diet groups. Surprisingly, while
the difference in the number of circulating Ly-6ChiCD11b+ monocytes was not
statistically significant, mice treated with EPA tended to have higher numbers of
circulating monocytes (Figure 8). In addition, when I examined the tissue mRNA
expression levels of Ccl2 in the AAAs at the same time-point of 1-week after AAA
surgery, aortas of mice in the EPA diet group had significantly higher Ccl2 expression
than the aortas of mice in the Control diet group (Table 2). These two results together
should have suggested more potent recruitment of circulating monocytes to AAAs by
CCL2 in the EPA diet group, leading to the presence of more macrophages in the AAA
and which would be completely contrary to the initial hypothesis. However, upon
examining the actual number of macrophages in the AAA amongst the Control diet and
EPA diet groups, there was interestingly no statistically significant difference in the
number of aneurysmal Ly-6ClowCD11b+F4/80+ macrophages between the Control diet
and EPA diet groups (Figure 9). This indicates that despite the higher potential for
monocyte recruitment to AAAs in the EPA diet group, EPA suppressed the actual
51
To test the second hypothesis, I sorted the AAA macrophages from both groups
at 1-week after AAA surgery and examined their Mmp9 mRNA expression by real-time
PCR. The results showed that there was significantly less Mmp9 expressed by
macrophages sorted from the AAAs of mice in the EPA diet group (Figure 10),
suggesting that EPA directly affected macrophage function, such as MMP production,
within the AAA tissue while AAA macrophage numbers were unaffected. The
combination of no difference in macrophage numbers and an absolute decrease in
macrophage-derived MMP-9 levels in the AAAs of the EPA diet group resulted in a net
fall in total MMP-9 levels and activity, thereby helping to explain the reduced MMP-9
activity and gene expression in whole AAA samples as well as the attenuation of AAA
52
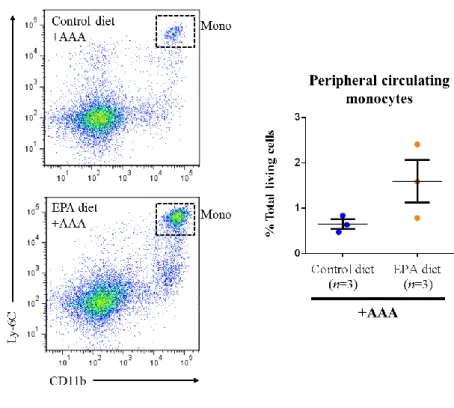
Figure 8. EPA tends to increase circulating monocyte numbers at 1-week after AAA surgery. Representative flow cytometric plots of circulating monocytes in peripheral
blood of mice in the Control diet and EPA diet groups at 1-week after the AAA surgery, gated by the myeloid cell markers Ly-6C and CD11b. After the blood was sampled via cardiac puncture, the mice were sacrificed and aortas were harvested for subsequent flow cytometric and mRNA expression analyses. While the difference in the number of CD11b+Ly-6Chi circulating monocytes was not statistically significant between the two groups (P = 0.1213 by unpaired Student’s t-test), EPA tended to increase the number of monocytes.
53
Figure 9. AAA macrophage numbers are not significantly different between the Control diet and EPA diet groups. Representative flow cytometric plots of AAA
macrophages from mice in the Control diet and EPA diet groups at 1-week after the AAA surgery, gated by the myeloid cell markers Ly-6C and CD11b. Three AAAs from each group were pooled into one sample in each experiment. Quantifying the mean number of Ly-6ClowCD11b+F4/80+ aneurysmal macrophages per AAA sample showed that there was no statistically significant difference between the two groups. Data are mean ± SEM of six independent experiments.
54
Figure 10. mRNA levels of Mmp9 in sorted AAA macrophages. Macrophages from
AAAs in the Control diet and EPA diet groups at 1-week after AAA surgery were sorted and their Mmp9 expression levels were analyzed by real-time PCR. Expression levels were first normalized to 18s rRNA levels and then expressed as the relative expression to the level of Control diet group. Three AAAs from each group were pooled into one sample in each experiment. Data are mean ± SEM of five independent experiments. *P < 0.05 compared to the Control diet group.
55
Macrophage expression of Mmp9 is directly suppressed by EPA
Given the in vivo results, the next question was whether EPA would have the
same effect in vitro and suppress Mmp9 expression in cultured macrophages. To address
this possibility, I used the well-established RAW264.7 macrophage cell line and treated
these cells with EPA in vitro with or without TNF-α stimulation to induce Mmp9
expression.
Firstly, the results showed that TNF-α effectively induced Mmp9 expression in
RAW264.7 macrophages, as can be seen by the more than two-fold increase in Mmp9
expression in the vehicle control group after TNF-α stimulation (Figure 11). When
RAW264.7 macrophages were treated with increasing concentrations of EPA, there was
a dose-dependent reduction in the expression of Mmp9 at both baseline and after TNF-α
stimulation, although the effects at baseline were small and non-significant (Figure 11).
This lends strong support to the direct effects of EPA on macrophage Mmp9 expression.
Taken together with the previous in vivo results, it appears that EPA directly affects
56
Figure 11. EPA dose-dependently suppresses macrophage Mmp9 expression in vitro.
RAW264.7 macrophages were cultured with either vehicle (10% BSA) or EPA (10, 25, or 50 μmol/L) for 48 hours. The cells were then stimulated with TNF-α (20 ng/mL) for a further 6 hours and harvested for analysis by real-time PCR. Expression levels were normalized to 18s rRNA levels. n=3 per condition. Results are mean ± SEM. *P < 0.05 compared to the vehicle control after TNF-α stimulation.
57
5.2. Effects of EPA on vascular calcification in the aneurysm
Aortic calcification was suppressed by EPA
In a separate, interesting finding, I found that the aortic walls of CaCl2-induced
AAAs in BALB/cA mice from the Control diet group had clear, macroscopically visible
calcification (Figure 3A). This calcification was not as evident when another strain of
mouse (C57BL/6j) was used (data not shown), suggesting the existence of
strain-specific differences in vascular calcification in response to CaCl2 treatment that
have not yet been reported. In BALB/cA mice, I found that an EPA-supplemented diet
markedly attenuated this vascular calcification compared to AAAs in the Control diet
group, which was visible macroscopically (Figure 3A). To investigate this further, I
imaged mice in the Sham, Control diet and EPA diet groups at 6-weeks after AAA
surgery with micro-computed tomography (CT) and confirmed that the volume of
calcification along the area of the aorta to which CaCl2 had been applied was
significantly reduced in the EPA diet group compared to the Control diet group (Figure
12).
Given the reduction in vascular calcification by the EPA-supplemented diet, I
next examined the expression levels of factors known to be implicated in this process.
58
to be a major effector molecule mediating vascular calcification downstream of
RUNX2), and Opg (encoded by Tnfrsf11b, a factor that binds to RANKL to block its
actions by acting as a decoy receptor and inhibit vascular calcification) are three major
factors known to be critically involved in vascular calcification [39-41]. A marked
up-regulation of Runx2 and Rankl was observed in AAAs of the Control diet group at 1-
and 3-weeks after CaCl2-induction (Table 2), suggesting the close involvement of these
factors in the calcification seen in CaCl2-induced AAAs and consistent with previous
reports of their roles in vascular calcification. Interestingly, an EPA-supplemented diet
significantly attenuated Rankl up-regulation while it significantly increased the
expression of its inhibitor Opg at 1-week after AAA surgery. Meanwhile, there were no
differences in the expression of Runx2 between the Control diet and EPA diet groups,
indicating that EPA may be suppressing Rankl expression somewhere downstream of
RUNX2-mediated pathway in addition to other pathways. Taken together, these results
suggest that the combination of (1) the reduction in levels of calcification-promoting
Rankl and (2) increased levels of the calcification-inhibiting Opg may explain why
vascular calcification was suppressed in the AAAs of mice fed an EPA-supplemented
59
Figure 12. CaCl2-induced AAAs form clear vascular calcification, and this is
ameliorated by EPA. Aortic calcification was assessed by micro-CT imaging of in situ
aortas 6-weeks after perivascular CaCl2 application. Both sagittal and transverse slices
show reduced overall calcification in the AAAs from the EPA diet group compared to the Control diet group, and this was consistent with the results of quantitative analysis of the total calcification volume in each aorta. Red arrowheads indicate the infra-renal aorta. Representative images of two independent experiments are shown. *P < 0.05 compared to Control diet group.