本稿では,ヒトの運動についての事前知識に基づいて慣性センサによって姿 勢を復元するうえで必要とされるそのドリフト軽減方法を議論する。データの 処理過程においてセンサデータにはノイズが必ず伴うが,角度推定の精度は運 動固有のパターンに強く依存している。そこで我々は,角度推定の精度を上げ るために,角速度の大きさと運動の複雑さを考慮した柔軟なドリフト補償方法 を推定フィルタに付加した。運動に関する事前知識を用いることで、ドリフト 補償のためのアノテーションが容易に自動化される。我々のドリフトの補償方 法は十分な精度をもたないセンサシステムにおいて高精度でヒトの運動を分 析するための一手法として将来貢献できると考えられる。
Intelligent Drift Reduction in Inertial
Sensor Orientation Estimates Using
Elementary Motion Knowledge
基本モーション知識を用いた慣性センサの姿勢
推定におけるインテリジェントなドリフト低減
Heike Katrein Brock
Doctoral Program, Graduate School of Media and Governance, Keio University ブロック・ハイケカトライン
慶應義塾大学大学院政策・メディア研究科後期博士課程
Yuji Ohgi
Professor, Graduate School of Media and Governance, Keio University 仰木 裕嗣
慶應義塾大学大学院政策・メディア研究科教授
In this paper, we discuss a strategy for motion dependent drift reduction in orientation estimates from inertial measurement units. Measurements showed that drift evoked from sensor noise could be very present in the orientation estimates when the raw sensor data was processed uniformly over diverse motion patterns. Independent of the employed processing filter, angular accuracy especially varied with the amount of angular velocities and the number of motion dimensions involved. We therefore categorized those dominant motion properties and used the resulting annotations to add a flexible drift compensation to the underlying estimators. Results showed that data accuracy increased by taking such elementary motion characteristics into account. Using a-priori motion knowledge, the presented intelligent drift compensation can contribute to higher data quality in automated kinematic analyzes of sport motions in future.
[研究論文]
Keywords:
1 Introduction
Wearable sensor technology became an important tool for human
performance monitoring and is nowadays also arousing more and more interest in elite sports training and competition: for every professional athlete, success in competitions is economically important and a driving factor for individual development, so that much effort is put on the creation of an ideal training environment. This often goes along with the use of computer-assisted training technologies. Inertial measurement units (IMUs) built from accelerometers, gyroscopes and magnetic field sensors can be an ideal device as they are cheap, light and capture human motion in an easy, flexible and direct way. However, their data output is sparse and they do not directly provide motion information necessary for conventional motion analysis. For this, it is essential to process the inertial data into more intuitive and meaningful motion information of reliable accuracy and precision.
With the increasing popularity of inertial sensors as motion capture
tools, many methods have been introduced that estimate meaningful motion information like segment orientations or body angles from the inertial sensor input data. The most famous methods are based on sensor data fusion of integrated angular velocities and accelerometer and magnetometer measurements like the Complementary and the Kalman Filter. All those methods originally got developed for non-dynamic situations like inertial navigation, and later got optimized for a use in human motion capturing. They can enable fundamental kinematic analysis in medical applications such as gait analysis or stroke rehabilitation [19, 7, 2]: with the absence of quick
motions, it is easy to estimate the orientations from the sensors’ accelerations and angular velocities. Natural constraints of the restricted motion
Inertial sensors, motion measurement, sensor drift, kinematics, motion analysis 慣性センサ、運動計測、センサドリフト、運動学、運動分析
environment like ground contact phases can furthermore help to reduce drift and increase accuracy in such a scenario [23]. Most sports, however, consist of
more complex motions with high accelerations and angular velocities. Filter properties developed in the rehabilitation context might therefore not be applicable to sports in the same way [12].
Technology for full body motion capturing of sport performances has
been introduced commercially already several years ago using a general Kalman filter and additional biomechanical constraints that increase the system’s robustness [18]. It serves as a quasi-standard since it offers high
accuracy and usability [21]. However, the relatively high initial cost, as
well as disturbing sensor sizes and vulnerability to water can detain sport research and training facilities from the acquisition of commercial systems. Instead, alternative hardware solutions that offer a smaller and waterproof combination of inertial sensor modules are developed and employed: unlike commercial systems, independent sensor systems are not bound to certain determined data processing methods. Consequently, they can be used in a more flexible way in subsequent applications. On the other hand, it is first necessary to implement methods that determine full-body kinematics necessary for a meaningful biomechanical performance analysis. Especially the derivation of highly accurate orientation estimates from the sensor data can be a challenge. To date, many sport motion analyses therefore either retrieved direct knowledge from the measured accelerations and angular velocities [17, 4], or from special aspects of a motion and specific body parts
that play an important role for the performance [8, 20].
In recent years, several independent sensor modules for human motion
capturing and the estimation of body segment orientations have been introduced in literature [2, 9, 3, 1]. One interesting example is the wireless micro
IMU introduced in [10], that is of particularly small size and high accuracy
suitable for motion tracking. The authors advise that in order to obtain best accurate orientation estimates, initial calibrations shall be performed on
all sensor types first. With incomplete or imperfect calibration processes, sensor data can otherwise be subject to remaining inaccuracies based on temperature-induced noise variations, angle misalignment and magnetic field bias that increase the error in resulting angular data estimates. In case that a powerful and reliable hardware calibration is not possible - due to missing calibration equipment, calibration mishandling or any other reason - it is very important to find alternative methods that enhance accuracy. Therefore, we wanted to gain deeper insights into the processes that influence the accuracy of conventional sensor processing methods. In particular, it might be beneficial to process the multidimensional sensor data in a more specific way under consideration of the characteristics in sport motions. By identifying the underlying mechanisms, eventual constraints and conditions that arise in the context of dynamic motion could then be discovered and an appropriate use in varying sport disciplines be enabled.
2 Data Collection
Our idea was to estimate the body segment orientations of sample
inertial motion data of different dynamics by determining their accuracy in relation to ground truth orientation data from an optical motion capturing system. The sample motion database was captured with a total of nine waterproof inertial measurement units (Logical Product. SS-WS1215/ SSWS1216, Fukuoka, Japan) [13] with 16 bit quantization rate. Every
measurement unit was of 67x26x8 mm size and 20 g weight and contained triads of gyroscopes, accelerometer and magnetometer for the respective x, y and z axes. The sensor modules were sampled at sfs= 500 Hz and were specified with a full-scale range of ±1500 dps with 0.67 mV/dps sensitivity for the gyroscopes, a minimum full-scale range of ±pm5 G with 191.7 mV/g sensitivity for the accelerometers and ±pm1.2 Ga full-scale range for the magnetic field sensors. They were attached to pelvis (P), and both left and right thigh (rT, lT), shank (rS, lS), foot (rF, lF) and arm (rA, lA) of the
athlete. The reference ground truth orientation data for every sensor was derived from positional data of four optical markers placed in a rectangular shape around each sensor (Figure 1). Those marker positions were captured by an optical Vicon motion capture system (VICON Nexus version 1.7.1. Vicon Motion Systems Ltd, Oxford UK) of 11 cameras sampled at sfV= 500 Hz and a calibration accuracy of less than 0.8 mm. All sensors were started simultaneously by a start command sent from a sensor control program via bluetooth and were set to capture data for ts= 30 seconds. The measurements were saved within a memory hardware of the sensor and the raw accelerations, angular velocities and magnetic field measures were read
Figure 1 Upper: sensor placement at the athlete’s body with the corresponding
sensor axes. Lower: sensors attached to the athlete’s body and their four corresponding optical markers for the determination of ground truth orientation data for accuracy evaluation.
out for further use later. The sensor start signal was received by an external antenna and sent to the Vicon software as analog data input, so that sensor and ground truth data could be easily synchronized in the post processing step. Motions were performed by two different actors and included walking, jogging, jumping, turns around the longitudinal axis, jumping jacks, kicking and throwing, leading to a total of N=28 data takes with nine sensor files each.
3 Methodology
To draw valid conclusions on a general system behavior under varying
motion types (independently of specific system designs), we investigated the performance of different orientation estimation filters. Before, every sensor was calibrated only in a simple, fundamental way, as it is possible in any capture environment and for any sensor-system user. For the accelerometers and gyroscopes, the sensor offset was determined in rest along all sensor axes under working temperature (meaning with the sensor running for a certain time in the capture environment) to avoid temperature drift. For the magnetometers, we determined the scale and offset factors by rotating the sensors around the main motion axes. Further advanced calibration was not performed, so that the captured data simulated application data as it could be acquired and processed in motion analysis scenarios.
3.1 Filter Methods
We implemented three different attitude estimation methods for the
processing of inertial sensor data that estimate orientations in quaternion representation and therefore do not suffer from gimbal lock caused by singularities in the motion data [5]. All filters are fusion filters and have
been widely used over the last years, especially in low-dynamic motion scenarios like gait analysis. In concrete, they are: a first Complementary Filter CF1 based on a gradient descent optimization algorithm [14], a second
Complementary Filter CF2 based on discrete cosine matrices initially developed for attitude reconstruction in robotics and control applications [6, 15]
and a quaternion-based pseudo-linear Kalman Filter KF designed for real-time estimation of the orientation of human limb segments [16, 22]. For all
three methods, the orientation q・w obtained from integration of the angular
velocities served as fundamental orientation estimate, which was then refined by adding information from the accelerometers’ and magnetometers’ measurement vectors to the f inal output estimate qest. In quaternion representation, the integration of the angular velocities can be performed by the quaternion derivative q・w,t determined in a simple multiplication at every
time step t:
s
w
t here is the extended four-dimensional angular rate vector with the first(scalar quaternion) element set to 0. The concrete refining fusion algorithm varies with every method and shall be further explained in the following.
The idea of CF1 is to merge the data of the integrated orientation q・w
with a second orientation estimate q obtained in a minimization problem from the sensor’s observation measurements vectors to the final estimate
qest. This optimization problem is described by the difference between the actual orientation and the orientation derived from the accelerometer and magnetometer data. In concrete, a unique orientation should be found for the spatial rotation aligning a predefined reference direction of the field in the earth frame with the measured direction of the field in the sensor frame. Using constraints on the direction of gravity and global magnetic field, the sensor measurement inputs can be assumed as s
a ^ = [0 ax ay az] for q・w,t = 1 2qw,t-1× s wt (1) ・ q・w,t = qw,t-1+ q ・ w,tΔt. (2) ・ ・
the accelerometer and s
m^ = [0 m
x my mz] for the magnetometer. They are then employed in the objective function of the optimization algorithm that generates the observation vector based orientation q . For every time step t,
qw,t and q ,t are then fused with a pre-defined filter gain β as
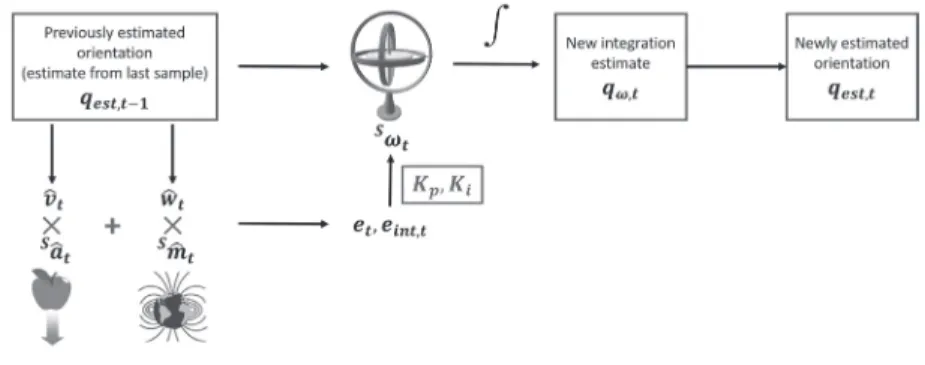
The convergence parameter β represents the gyroscope measurement error that is removed in the direction of the error estimated with q , t and is the only input variable that has to be specified for CF1 (Figure 2).
To determine the final orientation estimate qest from the gyro rate estimate
q
w by CF2, it is not necessary to define a correcting vector estimateq
.Based on the idea that angular changes can be represented in a rotation matrix, the divergence of integration and sensor measurement is instead achieved by using two correcting terms for the error induced by sensor bias and the numerical integration error. Proportional (sensor induced) error feedback e = s
a
^× v^ + s
m^× w^ is obtained by the cross product between
estimated direction vectors for gravity v^ and magnetic field w^ obtained from
qest,t-1 and the sensor field measurementsa^ andm^. The error accumulating with integration over all previous time steps per time step t constitutes the
q・est,t = qw,t−βq ・
,t (3)
integration error correction term eint,t = eint,t-1+e*Δt. Weighing e and eint by two filter gains Kp for the proportional error and Ki, the angular velocity data is refined to
and then integrated to the final output estimate as in Equation (1) and (2) (Figure 3).
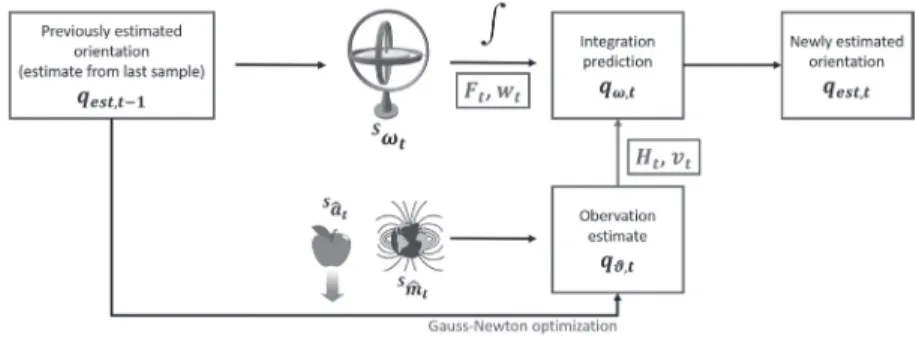
Used for orientation estimation from inertial sensor data, the general
principal of a Kalman Filter is as follows: from a previous or initial guess, a new value is predicted on the base of the angular velocity data of the next time step. This prediction is then compared to the observations of the correcting sensor measurement data and the credibility of the prediction and observations dynamically rated using information about measurement noise and inaccuracies. For the implementation of the third fusion filter
KF, we chose a variation of this general scheme: a quaternion orientation q is computed from the measurement vectors before the main algorithmic cycle of the Kalman Filter with a Gauss-Newton optimization, reducing the Kalman Filter’s input observation measurement vector z (the raw 9-axial sensor data) to the three angular velocities and q ,t at every time step t.
s wt =
s
wt+ Kp*et +Ki*eint,t (4)
This input data conforms to the output signal of the Kalman Filter, which constitutes the three angular velocities and the final orientation estimate qest,t. With the same number and types of input and output values, the filter can consequently be treated as linear and the main computation cycle simplified and accelerated.
The description of the process model of the filter is the same as for the
basic approach (e.g. used in [11]):
with the signal value x being a 7-dimensional vector containing the process model state values from the angular rates and the components of the integrated orientation qw,t . In compliance with the general definitions, Ft is the state-transition model defined by the quaternion integration from Equation (1) and (2) and Ht the observation model, whose values are either set to 1 for the angular velocities or 0 for the remaining quaternion elements of z. The process and measurement noise that influence the update of qw in x by q in z are represented by wt and vt (Figure 4). Their values have been
xt = Ft xt-1+ wt (5)
zt = Ht xt+ vt , (6)
determined in a long term observation of the sensors in rest.
3.2 Accuracy Determination
The accuracy of the estimated sensor orientation S
Eqest,t in the global earth frame E at every time frame t was determined as numerical deviation to a ground truth reference - the camera system orientation C
Eqgt,t captured with an optical motion capture system. C
Eqgt,t was computed from two positional vectors p→1 and p→2 defined by three of the four captured marker positions
around each sensor and a third orthogonal vector p→3 built from the cross
product of p→1 and p→2 . They were then combined in a rotation matrix and
transformed into quaternion representation.
We computed the difference between S
Eqest,t and CEqgt,t as the distance between two quaternions EIP defined by the inner product <SEqest,t, CEqgt,t> in quaternion representations, which gives a measure on the distance and similarity of two orientations. Then, we determined the overall accuracy per take as the root mean square error ERMS (RMSE) over EIP by:
whereas i stands for the current examined sample within the data capture of length n. Using the quaternion representation as a combination of the three Euler components pitch, roll, and heading, this error measure is not prone to errors caused by singularities in the Euler angles. However, it also does not give a concrete information about angular deviations per sensor rotation axis. We therefore def ined an additional RMSE measure ERMS∊with ∊ representing the decoupled Euler valuesФ, θand ψin radians computed
from the quaternion representations as
EIP = 1−<ESqest,t, CEqgt,t > 2 and (7)
ERMS =
√
1nΣn
To compare S
Eqest,t to CEqgt,t , it was necessary to bring both into the same reference frame. Since the origin of the optical motion capture system was set parallel to the ground surface, we expected the y and z axis of both coordinate frames to be parallel, with z defining the direction of the gravity vector pointing towards the earth’s center. Hence, it was only necessary to compensate for the heading difference ψ' between the sensor’s x-axis (defined by the direction of the magnetic north) and the x-axis of the Vicon coordinate frame (pointing in arbitrary direction). At the beginning of each data trial, the athlete was asked to stand still for approximately two seconds after the sensor start. The initial orientation of all sensors was then estimated with an additional non-fusion vector-based orientation estimation method VB from the static pose. VB originally got developed in the context of spacecraft attitude determination as a variation to the popular QUEST algorithm that solves Whaba’s problem of determining attitude from magnetometer and accelerometer measurements only [24]. Here, attitude is represented as a
combination of the rotational displacements around the three principal axes that can be determined by trigonometric correlations from field vectors in static environments under no external acceleration. Therefore, the algorithm is very useful to quickly estimate orientations under static positions as given in our initial sensor start condition. The initial estimates ensure the convergence of each algorithm’s states. Moreover, they could be used to determine the initial Euler headings ψs and ψc of both sensor and control system that were then computed out from the orientation estimates over all samples: in case that the pitch and roll values are identical, the quaternion product S
Eqest,t⊗q *
ψs with qψs built from ψs should be equal to the quaternion product C
Eqgt,t ⊗ q *
ψc with qψc built from ψc .
ERMS∊ =
√
1nΣ n4 Accuracies and Influences on the Estimates
For our evaluation, we had a look on the general angular accuracies of
all estimation filters to identify eventual factors influencing the output filter performance.
4.1 Filter Settings
To get a good orientation estimation result, it was essential to choose
appropriate settings for the noise values β in CF1, Kp and Ki in CF2 and
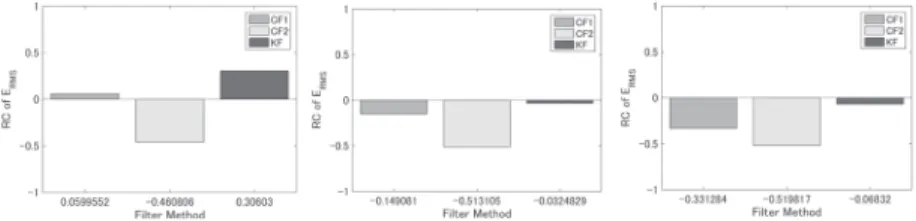
wk in KF. In general, the accuracies of the fusion filters vary with the selected noise values and filter models, depending on how much influence on the overall estimate is granted to every sensor data type (respectively the correcting sensor observation data from accelerometer and magnetometer). To find reasonable filter settings, we first estimated the orientations of randomly selected data captures with all filters under various linearly increasing filter values. From their determined accuracies, we then identified three probable filter settings that were used to compute the accuracies over all motion takes: strong filter values β= 0.4, Kp= 1.0 with Ki = 0.01 and wk= 0.07, medium filter values β = 0.15, Kp= 0.6 with Ki= 0.01 and wk= 0.04 and weak filter values β= 0.05, Kp= 0.2 with Ki= 0.01 and wk= 0.01. Next, we determined changes in the error values for all respective fusion filter estimates in relation to the error value of the simple integrated orientation estimate qw obtained with Equation (1) and (2) designated as GI in the following. The idea for this comparison is that GI indirectly represents the quality of the gyro rate sensors: the better the sensors, the more accurate the integration and hence the better the accuracy values for the estimates from both GI and the fusion filters. The difference between the accuracy of GI and the accuracy of a more sophisticated fusion filter furthermore gives an idea about the effect and impact of the fusion filter with the chosen settings. This difference was described as relative change RC between the error values
RCTV =
ERMS,T − ERMS,GI (10)
ERMS,GI .
values from GI as
At every frame i in a motion take, the RC for KF is for example defined as
Based on the mean over the RC values for all
database motion takes and sensors, we finally chose those filter values that generated the smallest and hence best relative changes on average for the following investigations. These were β= 0.05, Kp= 0.2 and wk= 0.01 (Figure 5). It is important to note that this choice made on average results did
not constitute an absolute selection of the best possible filter values for all individual data takes. Better filter values might have been found under extensive experimentation and computation, as well as by using the specific sensor noise values for every individual sensor in the filter methods: huge differences already existed in the accuracies of the pure GI estimates among different sensors and rotation axes. The estimates for the sensor attached to rT for example suffered from little drift only and always yielded higher accuracies than estimates from other sensors (e.g. attached to rS and rF). Swapping sensors, the accuracy of the sensor estimate previously attached to rT remained better, so that the differences were likely to stem from technical differences in the sensor or insufficient sensor calibration. The chosen filter
RCKF =
(ERMS,K,F,i − ERMS,GI,i) . ERMS,GI,i
Figure 5 Changes in the error values ERMS for the fusion filters in relation to the
error values ERMS for the simple GI estimates (here depicted as base value
0). Left: strong filter values. Middle: medium filter values. Right: weak filter valuesβ= 0.05 for CF1, Kp= 0.2, Ki= 0.01 for CF2 and wk= 0.01 for
values might then not be equally suitable for all sensor estimates in such a case: in concrete, the KF filter value wk= 0.07 achieved more accurate estimates for the higher noise sensors than wk= 0.01, but on the other hand significantly reduced accuracy of the lower noise sensor estimates. In this respect, positive (denoting a change for worse) or small RC values did not necessarily proof a malfunction of the implemented methods but only represented the average value over all takes.
4.2 Gyroscope Drift
Estimation accuracies improved by use of the fusion f ilters in
comparison to GI. However, the obtained estimates were still subject to errors induced by sensor noise and could not be considered absolutely correct: as explained at the end of Chapter 1, the sensor data should be calibrated well to reduce possible sources of error on the data and to obtain a high accuracy in the orientation estimates. One of the main problems one otherwise encounters in the orientation estimation is drift that evolves from white noise in the gyro rate sensor readings and that cannot be controlled as a constant offset - even tiny deviations from the underlying raw sensor data like very small oscillations around a sensor’s reading in rest are significantly enhanced in the integration process. Considering the extensive calibration processes carried out for the removal of all hardware-specific sensor errors made in [10],
one could expect the drift to be variate under the respective unrefined base accuracy of every sensor module in case of an insufficient calibration.
Indeed, we found big differences in the mean error values in quaternion
difference and angle for the selected filter values for two different sensors and sensor locations (Table 1). For example, one could see that CF2 offered the best estimates for jumping at both P and rS as well as jumping jacks at rS, but not at P where both CF1 and KF performed much better under the same filter settings. Especially the mean angular error values ERMS∊describing the amount of the error per motion axis appeared variate over its elements.
Table 1 Mean error values of CF1, CF2 and KF for the orientation estimates at the
pelvis P and an extremity E (right shank or arm) with kicking, jumping and right-handed throwing.
Filter Motion ERMS P ERMS∊P ERMS E ERMS∊ E
CF1 Kicking 0.0286 [0.098,0.073,0.263] 0.1195 [0.457,0.207,0.337] CF1 Jump 0.0108 [0.170,0.083,0.049] 0.0452 [0.129,0.175,0.247] CF1 Jump & Turn 0.0404 [0.071,0.128,0.255] 0.0163 [0.041,0.062,0.181] CF1 Jumping Jacks 0.0163 [0.229,0.031,0.030] 0.1152 [0.198,0.257,0.398] CF1 Throwing 0.0036 [0.053,0.059,0.056] 0.1588 [0.554,0.250,0.490] CF2 Kicking 0.0275 [0.097,0.072,0.259] 0.1192 [0.452,0.200,0.336] CF2 Jump 0.0231 [0.255,0.046,0.089] 0.0288 [0.115,0.167,0.216] CF2 Jump & Turn 0.0404 [0.072,0.13,0.230] 0.0184 [0.093,0.063,0.196] CF2 Jumping Jacks 0.0896 [0.479,0.038,0.235] 0.099 [0.087,0.281,0.351] CF2 Throwing 0.0039 [0.054,0.063,0.062] 0.1481 [0.529,0.242,0.441] KF Kicking 0.2022 [0.088,0.072,0.695] 0.1315 [0.477,0.224,0.403] KF Jump 0.0423 [0.234,0.040,0.234] 0.1183 [0.168,0.322,0.285] KF Jump & Turn 0.1716 [0.144,0.205,0.612] 0.0441 [0.170,0.199,0.201] KF Jumping Jacks 0.0318 [0.176,0.040,0.244] 0.1366 [0.164,0.267,0.453] KF Throwing 0.0412 [0.088,0.075,0.324] 0.4901 [0.668,0.371,0.969]
To the human eye, drift is especially obvious when creating a linear
error accumulation in the orientation estimates. From Equation (4) and Equation (5), we have seen that CF2 and KF already include an error measure for the sensor noise induced drift. However, the obtained accuracy values showed that this internal drift compensation was not sufficient to equally remove the drift from the sensor signal of all data captures respectively of all motion types. For the present data, drift was especially large at the lower extremity, which suffered from quickly increasing deviations between the estimated and the ground truth angular changes over time. Examples of a high error measure ERMS∊along a rotational axis are the pitchθestimates during jumping (rope skipping) and jumping jacks at P (Figure 6 bottom row). For the same sensor (meaning the same basic hardware noise), the estimates remained within 5 degree accuracy over the complete length of the data capture during other motion types like for
example throwing and kicking (Figure 6 top row) on the other hand. Here, the error measure ERMS∊ along the y-axis representing the pitchθwas small. Those characteristics were independent of the implemented filter types, and should therefore be further investigated in the next step.
4.2.1 Angular Velocities
Considering the differences and commonalities within the variate
motion types for different sensors and sensor placements, we could identify the maximal amount of angular velocity within a motion as one characteristic difference that could impact the estimation accuracy. For every motion pattern, different body segments underwent different angular velocities (Table 2). Angular velocities during a kicking motion for example were much higher at the outer lower extremities than around the body center. In the same way, high rotational movement occurred at the right arm in a right-handed throwing motion, whereas less rotational movement occurred at the
Figure 6 Estimates for angular changes along one motion axis during a sequence
of continuous motions with CF1, CF2 and KF to the ground truth orientation determined from optical camera data. Upper row: estimates for pitchθin throwing and kicking at P with small ERMSθ. Bottom row:
estimates for pitchθ in jumping (rope skipping) and jumping jacks at P with high ERMSθ.
left arm and the relatively static legs. For all database captures and estimation methods, we could observe that the estimates for a body segment that was not exposed to high angular velocities were of better general accuracy than the estimates for a body part that underwent higher angular velocities. For example, the estimates for P of low speed were of general smaller error value than the estimates for sensors at extremities undergoing higher speed motions (shown for P and rS or rA in Table 1 and Table 2). It was therefore reasonable to conclude that varying angular velocities between different motions influenced the filter performance. Considering that orientation estimation filters are generally designed for slow motions like walking and gait analysis where all sensors are exposed to low angular velocities only, such finding would not be particularly surprising.
To test for such speed dependencies in the following, we built three
semantic groups low speed, medium speed and high speed rotational movement under consideration of the general sensor specifications by the threshold ranges thlm= ±400 dps and thmh= ±800 dps. Every sensor data was then assigned to one of the respective groups with respect to the rounded measured maximal angular velocity averaged over all three motion axes. Body parts that were exposed to rotational movement of equal or less than ±400 dps in average were classified as low speed, body parts exposed to rotational movement between ±400 dps and ±800 dps in average as medium
Table 2 Rounded mean maximal x, y, z angular velocities (AV) in dps at the pelvis
P and an extremity E (right shank or arm) with kicking, jumping and right-handed throwing and the rounded mean AV in dps leading to their classification.
Motion AV P max/mean Classif. AV E max/mean Classif.
Kicking [209,367,212]/263 low [338,716,501]/518 medium
Jump [250,565,133]/316 low [529,925,480]/645 medium
Jump & Turn [519,803,326]/549 medium [1011,1750,1101]/1287 high
Jumping Jacks [179,290,110]/193 low [458,762,494]/571 medium
speed and any other as high speed motion (Figure 7). For the sensor attached to rA, jogging with a maximal angular velocity of less than thlm was for example classified as low speed motion. Jumping jacks with a maximal angular velocity of less than thmh were classified as medium speed motion and the throwing motion with angular velocities of more than thmh as high speed motion. Other body parts were not necessarily classified under the same motion speed. During throwing for example, P with a maximal angular velocity of wmax= 295 dps was annotated as low speed, while the legs with rS, and rT and lS and lT underwent medium angular velocities.
4.2.2 Motion Structure
Data visualizations for one single sensor furthermore brought us to the
assumption that drift varied with respect to the structure of different motion patterns. Especially the principal motion axis, the amount of changes along a motion axis and the number of motion planes involved in a motion seemed to influence the progression of drift in the data. Data takes that for example contained motions in primarily one motion plane like the jumping motions seemed to suffer more from drift than data takes that contained motions with rotations around more than one motion axis like throwing or kicking (Figure 6). Under the same filter values, accuracy of the estimates confirmed this
Figure 7 Angular velocities at x (dotted), y (solid) and z (line) for three sample
motion types jogging (left), jumping jacks (middle) and throwing (right) at rA in relation to the thresholds thlm at ±400dps and thmh at ±800 dps.
According to the mean angular velocities, the sensor data was classified as low speed motion during jogging, as medium speed motion during jumping jacks and as high speed motion during throwing.
observation. Particularly large drift occurred in those motion performances that were of continuous high frequency and positional changes, while not undergoing large angular velocities and angular changes over a longer time span. Besides, the larger the angular changes along a motion axis in a data take were, the better the accuracy estimate. One explanation for this behavior could be that white sensor noise remaining after an imperfect sensor calibration and leading to drift during the integration is automatically reduced with changing and varying motion directions by canceling out some of the accumulated noise.
5 Compensating Error Sources
We have seen that many variables influenced the resulting orientation
estimates. Taking them into account during data processing, the estimates are more likely to be meaningful for a subsequent full-body kinematic motion analysis. Consequently, we next wanted to identify a way of error compensation.
Since the integration of the gyro rate measurements is the base for
all orientation estimators, reducing the integration drift should also help to improve the overall accuracy of an orientation estimator. In a first step, we aimed to reduce as much drift as possible by adding a drift compensation to the angular velocity integration step. Various drift compensation approaches exist, we used a very simple one here: we assumed the sensor offset value to be varying around the zero value and respond to the resulting drift by subtracting an additional, small offset from the gyro rate sensor reading. First, we computed the drift di per frame i as multiplication between its angular velocities wi and a defined gyro rate bias (e.g. b = 0.05) with the respective sampling rate fs, whereas the gyro bias rate was a constant that included all possible sources of error like sensor noise, signal aliasing, quantization errors or variations caused by temperature differences. We then added the current drift di to the previous drift di-1. In the next computation
step, the new summed drift was subtracted from the consecutive angular velocities, and the influence of the sensor noise reduced. In this way, an accumulated drift (compensation) value was created over time, functioning as low pass filter and hence accounting to the temporal progression of drift. This simple compensation already reduced the linear accumulating drift errors in the orientation estimate visibly, even without using any sophisticated filter but only the simple integration of GI (Figure 8).
To evaluate the positive effects that can be achieved with the proposed
drift compensation, we added it to the orientation estimates of the sample motions from Figure 6. The resulting accuracies from Figure 9 indicated that by using such simple and computationally cheap drift compensation on estimates considerably superimposed by drift (meaning estimates with a high ERMS∊), the orientation estimates could already be drastically improved. In those motions, the estimated orientations approached much closer to the ground truth data. However, it should however be emphasized that the drift compensation was not successful for the takes with little drift (meaning estimates with a small ERMS∊). In concrete, the effect of the drift compensation varied with the pre dominant amount of drift: while the mostly drift-free data captures (top row) could not even get improved by small b values, large b values were used for the drift exposed data captures (bottom row). This meant that for an efficient drift compensation, it was necessary
Figure 8 Left: global ground truth pitch θ (solid), roll Ф (dotted) and yaw ψ (line)
in degree for a continuous sequence of jumping jacks at P undergoing low angular velocities. Middle: GI sensor estimates for the same motion building a linear accumulating drift error. Right: GI sensor estimates for the same motion with reduced drift using the proposed drift compensation.
Figure 9 Orientation estimates for the same sample motion takes from Figure 6 with the
additional drift compensation. Accuracy was tweaked efficiently for all filter methods in the takes with high ERMSθsuffering from large drift of the pitch θ,
but drastically deteriorated for the takes with little drift and small ERMSθ.
to take into account the characteristics of the captured performances. It also meant that to be able to apply the drift compensation generically in real applications, it was necessary to find rules for the selection of applicable b values, ideally irrespective of the underlying filter type.
5.1 Correlation with Motion Speeds
Drift was prevalent in low speed motions of little or medium angular
velocities and could be reduced with a large gyro rate bias b. In this context, it is important to note that the same b value could reverse the positive effect of drift compensation in cases with already low drift rates. In particular, one has to take into account the fact that even within one motion, occurring angular velocities vary with every motion axis, depending on the motion type: the main motion direction in jumping jacks for example was up- and downwards, with high angular displacements around the global inclination axis and hence high angular velocities at the sensor axis aligned to the global coordinate system. Rotations around the extremities’ longitudinal axis on
the other hand were much smaller, resulting in less angular velocities at the respective sensor axis. Since b gets multiplied with the current angular velocities wi, a same value for b would have a much bigger effect on the compensation with the significantly higher angular velocity. This can even lead to negative compensation. Given a sample motion in which the pitch θ around the sensor’s y-axis is especially affected by angular changes, its drift along the y-axis could be overcompensated and therefore reversed with a chosen bias rate value (Figure 10). In such cases, a better adaptation to the present motion data could be obtained with a different, smaller b value (e.g.
b=0.02) as in Figure 10 right, where drift around y (and slightly around z)
was reduced, while a stable estimate around x was maintained.
Because even within one motion, occurring angular velocities varied
with every motion axis in dependence on the motion type, the bias rate should be defined as three-dimensional vectors with entries of different
b-value that responded to the respective occurring motion characteristics.
Assumptions on the prevalent angular velocities per sensor axis can generally be made from the biomechanical specifications of a motion. Here, however, it is necessary to know the approximate alignment between sensor axis and body segment bone growth directions. To design an universal drift reduction strategy from the previous observations, we built three different motion type categories dependent on the occurring angular velocities:
Figure 10 Left: global pitchθ(solid), rollФ(dotted) and yawψ(line) GI estimates
from the sensor data in degree for a continuous sequence of jumping jacks at rS undergoing high angular velocities with obvious drift. Middle: GI sensor estimates for the same motion with drift compensation under a high b-value. Right: GI sensor estimates for the same motion with drift compensation under a different, smaller b-value.
Type L, Type M and Type H, whereas L stood for low speed motions, M for medium speed motions and H for high speed motions according to the definition of thim and thmh.
5.2 Correlation with Motion Structure
As second conclusion, we identified the drift to be stronger in motions
with less rotation axes involved and less variations along all rotation axes. This observation meant that the effectivity of drift compensation values did not only depend on the angular velocities, but also on the general drift potential of every motion pattern. Sensor data from motions that were of generally fewer drift consequently did not require a high compensation value, even if only small angular velocities were measured by the gyro rate sensors. Therefore, we built two further categorization criteria referring to the discussed variations in the number of rotation axes involved within a motion. Motions around one principal rotation axes were classified as Type 1 (designating high drift potential) and motions around more than one rotation axis as Type 2 (designating low drift potential).
5.3 Compensation Values
The previous categorizations finally led to the six different bias
compensation categories L1, M1 and H1 and L2, M2 and H2, whose values have been determined experimentally for the subsequent comparison. First, the sensor data of all data captures was annotated and assigned to one of the six respective categories. Every category was then tested under several probable bias rate values of linearly increasing distance, and the value of best average accuracy over all estimation filters per sensor category chosen. This brought us to the error values bl1= 0.05, bm1= 0.026 and bh1= 0.002 as well as
6 Results
To verify the proposed strategy and to point out its changes on the
overall accuracy values, we compared accuracies in relation with each other in the next step. In all computations, the initial difference between estimate and ground truth remained the same, so that just the drift and accumulating errors over time were evaluated.
6.1 Accuracy Measurements
First, we wanted to look at the general effects of the additional drift
compensation in relation to the introduced motion categories. For this, we compared the ERMS for the orientation estimates of pure GI estimates with the ERMS for the orientation estimates with the proposed varying drift compensation rates under the previously defined six motion types L1, L2, M1, M2, H1 and H2.
Figure 11 visualizes the accuracy changes of the additional drift
compensation relative to the uncompensated GI estimates averaged over all body segments and data takes. We could see that the drift compensation worked well when appropriately put into context to the motion type and bias rate values. It was obvious that accuracy was especially increased for Type 1 motions that were suffering from larger drift (meaning motions categorized as L1 and M1), and that additional drift compensation was not recommendable for Type 2 motions of high angular velocities (meaning motions categorized as M2 and H2) under the generalized gyro bias rate values: for low speed motions of type 1, as for example P in jumping or the thighs in throwing, the average relative change was very good with the bl1 bias rate filter value. In those cases, drift was dominant along certain motion axes (as in the example shown in Figure 6), but could be efficiently reduced to a large extend with the compensation. Similar relative changes RCm1 were obtained for medium speed motions, as for example the extremities in jumping. We concluded that the drift that arouse as a result of missing
variation in the rotational axes had a much bigger effect on the estimates as the motion speed. The amount of angular velocities mainly had an influencing effect on type 2 motions, where drift was generally smaller. It furthermore became obvious that accuracy values did not notably improve with drift compensation for high speed motions and even deteriorated for most motions of Type 2 when the chosen bias compensation value was not ideal. For those annotations, it was more difficult to find effective bias values than for Type 1 low and medium speed motions, since the effect of the bias rate on the overall estimates was higher: already small changes in the b value could turn an appropriate drift compensation into an overcompensating value
Figure 11 Top: graph visualization of the change in ERMS for the drift compensated GI
estimates relative to the uncompensated GI estimates with the presented different rate bias values under a logarithmic scale. Color saturation within every motion category represents the different bias rate values (from little saturation for bl1 to
high saturation for bh2). Bottom: matrix visualization of the relative change in ERMS
for the drift compensated GI estimates to the uncompensated GI estimates with the presented different rate bias values under a logarithmic scale.
or vice versa. Especially H2 motions were difficult to drift compensate. This however conformed to our previous results and we could note that the chosen bias rate values matched with our assumptions, so that improvements were achieved in most cases.
6.2 Adaptive Two-Step Filter
Since we only verified the GI method, the error values from the
previous evaluation were relatively high with an average non drift-compensated GI error value of 0.1472. Next, our strategy should therefore be examined for the implemented fusion f ilters. Under the previous observations, we added the same adaptive drift compensation strategy as extra filter step to the orientation estimation of all three fusion filter types. The idea was that drift should get compensated better when respecting the prevalent motion characteristics, so that the fundamental filter settings would not need to be adjusted by the user in future applications. In the case of a mobile training application this could for example mean that a target motion is simply annotated before the motion performance with respect to its angular velocities and motion dimensions. The program’s filter values and drift compensation could then be automatically adapted according to the annotations and pre-defined motion specifications, and the estimation filter be universally used for all motion patterns. In a more ubiquitous scenario, the filter values could furthermore change dynamically under the currently measured angular velocities, taking into account also sudden phases of high impact or angular changes of body parts. As a result, the accuracy values of orientation estimates are improved on an individual basis for every specific sport motion performance, while it is not required to individually change the fundamental setting.
To evaluate the flexible two-step drift compensation, we lastly examined
the effects that were achieved by using the flexible filter in relation to no drift compensation with ERMS for GI and CF1, CF2 and KF. Our accuracy metrics
showed that especially in motions where high drift was likely to occur, such as type L1 or M1 motions, the additional flexible drift compensation could significantly enhance the fusion filter results: using no additional drift compensation, the average relative changes for the ERMS error measure of the fusion filters to the error measure with GI of an error of 0.6975 were RCCF1= -0.6508 for CF1, RCCF2= -0.5981 for CF2 and RCKF= -0.0326 for KF. Using the additional two step drift compensation improved the relative changes to
RCCF1= -0.6687, RCCF2= -0.6975 and RCKF= -0.6358. Especially for KF we could achieve much better accuracies, which was due to the chosen general filter values that were not ideal for all of the processed sensor data. Under H2 motion types, where it was difficult to predict and compensate drift, we abstained from additional drift-compensation and used only the fundamental fusion filter algorithm. This enhanced the estimates by an average relative change to GI of RCCF1= -0.4668, RCCF2= -0.4933 and RCKF= -0.1473.
Furthermore, we compared the identical adaptive drift compensation
with a simple, fixed bias rate value (Figure 12), whereas b was chosen as the mean between all six values of the flexible strategy here and set to
b=0.0135. As it is clearly visible, the additional drift compensation increased
accuracy and performance of the filter design among all of the investigated estimation filters in comparison to the averaged ERMS error values without drift compensation. Furthermore, it became clear that the flexible filter
Figure 12 ERMS error values averaged over all motion takes and sensor locations
for GI, CF1, CF2 and KF without drift compensation (left), with drift compensation of a simple fixed value (middle) and with the proposed flexible drift compensation (right).
values addressed and reduced the drift effects much better than the fixed bias rate value. One could even see that the estimators with additional fixed value compensation did not perform better than the conventional filter design without any additional drift compensation. This degradation in accuracy is caused because no ideal b value was set respecting all different motion types. As a result, we could state that it is reasonable to extend the filter design by the proposed drift compensator, when the flexible strategy that respects a motion’s innate drift potential is employed. Then, the general applicability of orientation estimation methods can be improved, independently of the chosen fusion filter algorithm.
Besides, the computed accuracies show that the proposed filter adaptations
generated orientation estimates of sufficiently high quality under the chosen filter values. Highest accuracies that could for example be obtained with the chosen filter values for L1 type motions were 0.0107, or [0.1303,0.0362,0.0234] rad with ERMS∊for CF1, 0.0046 or [0.0403,0.0370,0.0484] rad for CF2 and 0.0115 or [0.0309,0.0525,0.0684] rad for KF.
6.3 Filter Dependence
From Table 1, we have seen that the performance of the different fusion
filters varied with the motion data type. Given the previous results, it was also reasonable to expect every filter design to perform differently well with specific motion types. Based on the computed changes RCKF and RCCF2 in ERMS relative to GI, we came to the results that under the chosen filter settings, KF was especially useful for body segments of mainly small motion speed with an average relative change of RCKF= -0.7843 (independently of quick phases of high impact that can be compensated by the filter design).
CF2 on the other hand offered particularly high accuracy for motions
and body segments that constantly reached high angular velocities with an average relative change of RCCF2= -0.7725. CF1 offered performance improvements in all cases, but always yields accuracies below CF2.
Consequently, we recommend to use CF2 in the respective cases, which constitutes the simpler method from an algorithmic perspective.
7 Conclusion and Future Work
This study gave an overlook on the use of different popular orientation
estimation methods for sport applications under the focus of non-commercial and individually build motion measurement devices. Different processes and factors that influence the accuracy of attitude estimators in the presence of varying dynamic target motions were identified and analyzed. The most prevalent factor here was drift that generally occurs as a result of accumulated variate sensor noise. We have shown that drift varied in dependence on the performed motions, their occurring angular velocities, the number of rotation axes involved and the amount of external acceleration acting on the measurement sensors. General strategies to enhance the performance and accuracy of different orientation estimation methods compensate the drift by a pre-defined fixed value. This is also the case for the implemented fusion filters with their internal drift compensation. We showed that it is recommendable to employ an extra computation step that enhances the estimates with respect to their motion characteristics: considering simple elementary motion knowledge like the amount of angular velocities and motion dimensionality, the common drift compensation can be adapted well to the expected amount of drift per motion, and the accuracy be enhanced considerably.
In general, it appeared sensible to use a flexible system that adapts to the
specific motions of an intended kinematic motion analysis without imposing the need to change the fundamental system parameters. By changing the drift compensation values under consideration of the approximate average angular velocities and motion structure, a better, more accurate and significant motion feedback can be provided. The following conclusions shall be particularly emphasized in this respect from the measurements and observations of the present work:
(1) Motions that undergo high angular velocities over several dimensions suffer from significantly less drift than monotonous motion patterns of low angular velocities.
(2) Additional drift compensation in form of an adaptive two-step filter can significantly improve the accuracies of the estimates independently of the chosen filter design. Here, it is useful to introduce various fixed drift compensation values that can be used in a flexible way under consideration of previously annotated motion types.
(3) Analyzed motion types should be annotated with respect to the amount of rotational axes involved and the expected maximal angular velocities, ideally before the main motion analysis task: both factors considerably influence and change the general accuracy values, whereas the amount of rotational axes involved had a bigger impact on the data here. Biomechanical knowledge of the performed motion and its principal axes is useful to further advance and automatize the data processing from inertial measurement units, whereas it is also possible to retrieve the fundamental information from the user by a user interface or text input.
(4) Differences in the individual sensor specifications lead to variations in the amount of drift per sensor: to handle those fundamental differences, we recommend to investigate each sensor’s behavior in a pre-study and then use different filter values under consideration of a sensor’s internal drift. Ideally, hardware specific differences should then also be included in the measures, or either taken into account in the experimental setup.
(5) Different estimators are better suited for different motion types: the Kalman Filter is especially useful for motions of small angular velocities and few variations on the angular rotations, while the Complementary Filter works especially well with motions of constant high angular velocities.
We believe that the proposed additional filter with speed and motion
axis dependent filter values is a reasonable tool to enforce the further enhancement of orientation estimates in sport motions. The successful implementation of a generic and universally applicable estimation filter is a key factor for the future use of inertial sensors in motion performance scenarios. Providing a simple use for any kind of system users, the designed drift compensation strategy consequently presents valuable information for the derivation of kinematic motion data from inertial sensors: by refining the estimates while maintaining simplicity and ubiquity of the processing filters at the same time, it should be possible to ensure more sophisticated data analysis applications and software tools in future. Especially for training applications in mobile devices, where conventional commercial systems cannot be used, and under imperfect or incomplete sensor calibration, the method appears to be useful.
The next step would be to flexibly use filter values within one single
motion performance. This means that for every frame the angular velocity is exceeding a certain defined threshold value (and hence entering a different class of motion speed), other filter values would be used for the orientation computation step. By that, the filter can adapt itself to the characteristics of a specific motion type, so that the most accurate motion information is displayed in dependence of the respective sport and motion type. Then, it might furthermore become possible to better react and adapt to short phases of high impact that cannot yet be depicted well by the fusion filters.
The proposed flexible drift compensation method is used in several
sports and for varying movement tasks in the following, such as intelligent and automated motion processing for ubiquitous and mobile training applications, making inertial sensors step by step a fundamental tool in sports training and motion analysis.
References
[1] Brigante C, Abbate N, Basile A, Faulisi A, Sessa S., “Towards miniaturization of a mems-based wearable motion capture system,” IEEE Transactions on Industrial Electronics, 58(8), 2011, pp. 3234-3241.
[2] Bruckner HP, Kruger B, Blume H., “Reliable orientation estimation for mobile motion capturing in medical rehabilitation sessions based on inertial measurement units,”
Microelectronics Journal, 45(12), 2014, pp. 1603-1611.
[3] Buonocunto P, Marinoni M., “Tracking limbs motion using a wireless network of inertial measurement units,” 9th IEEE International Symposium on Industrial Embedded Systems
(SIES), 2014, pp. 66-76.
[4] Dadashi F, Millet G, Aminian K., “Estimation of front-crawl energy expenditure using wearable inertial measurement units,” IEEE Sensors Journal, 14(4), 2014, pp. 1020-1027. [5] Diebel J., Representing attitude: Euler angles, unit quaternions, and rotation vectors, 2006. [6] Euston M, Coote P, Mahony R, Kim J, Hamel T., “A complementary filter for attitude
estimation of a fixed-wing uav,” IEEE/RSJ International Conference on Intelligent Robots
and Systems, 2008, pp. 340-345.
[7] Gago MF, Fernandes V, Ferreira J, Silva H, Rocha L, Bicho E, Sousa N., “Postural stability analysis with inertial measurement units in alzheimer’s disease,” Dementia and geriatric
cognitive disorders extra, 4(1), 2014, pp. 22-30.
[8] Ghasemzadeh H, Jafari R., “Coordination analysis of human movements with body sensor networks: A signal processing model to evaluate baseball swings,” IEEE Sensors Journal, 11(3), 2011, pp. 603-610.
[9] Harms H, Amft O, Winkler R, Schumm J, Kusserow M, Troester G., “Ethos: Miniature orientation sensor for wearable human motion analysis,” IEEE Sensors, 2010, pp.1037-1042.
[10] Hoflinger F, Muller J, Zhang R, Reindl LM, Burgard W., “A wireless micro inertial measurement unit (imu),” IEEE Transactions on Instrumentation and Measurement, 62(9), 2013, pp. 2583-2595.
[11] Lee HJ, Jung S., “Gyro sensor drift compensation by Kalman filter to control a mobile inverted pendulum robot system,” IEEE International Conference on Industrial
Technology, 2009, Gippsland, VIC, 2009, pp. 1-6.
[12] Lee JK, Park E, Robinovitch S., “Estimation of attitude and external acceleration using inertial sensor measurement during various dynamic conditions,” IEEE Transactions on
Instrumentation and Measurement, 61(8), 2012, pp. 2262-2273.
[13] Logical Product Sports Sensing. 9-axial waterproof inertial sensor. <http://www.sports-sensing.com/products/motion/motionwp01.html> accessed 2015-10-17.
[14] Madgwick S, Harrison A, Vaidyanathan R., “Estimation of imu and marg orientation using a gradient descent algorithm,” IEEE International Conference on Rehabilitation Robotics
(ICORR), 2011, pp. 1-7.
[15] Mahony R, Hamel T, Pflimlin JM., “Nonlinear complementary filters on the special orthogonal group,” IEEE Transactions on Automatic Control, 53(5), 2008, pp. 1203-1218. [16] Marins J, Yun X, Bachmann E, McGhee R, Zyda M., “An extended kalman filter for
quaternion-based orientation estimation using marg sensors,” Proceedings of the IEEE/
RSJ International Conference on Intelligent Robots and Systems 4, 2001, pp. 2003-2011.
[17] Milosevic B, Farella E., “Wearable inertial sensor for jump performance analysis,”
York, USA, 2015, pp. 15-20.
[18] Roetenberg D, Luinge H, Slycke P., Xsens MVN: Full 6DOF Human Motion Tracking
Using Miniature Inertial Sensors, Tech. rep., XSens, 2009.
[19] Tadano S, Takeda R, Miyagawa H., “Three dimensional gait analysis using wearable acceleration and gyro sensors based on quaternion calculations,” Sensors, 13(7), 2013, pp. 9321-9343.
[20] Tessendorf B, Gravenhorst F, Arnrich B, Troster G., “An imu-based sensor network to continuously monitor rowing technique on the water,” Seventh International Conference
on Intelligent Sensors, Sensor Networks and Information Processing (ISSNIP), 2011,
pp. 253-258.
[21] XSens. MTW motion tracker. <https://www.xsens.com/products/mtwdevelopment-kit/> accessed 2015-10-17.
[22] Yun X, Bachmann E., “Design, implementation, and experimental results of a quaternion-based kalman filter for human body motion tracking,” IEEE Transactions on Robotics, 22(6), 2006, pp. 1216-1227.
[23] Yun X, Bachmann E, Moore H, Calusdian J., “Self-contained position tracking of human movement using small inertial/magnetic sensor modules,” IEEE International Conference
on Robotics and Automation, 2007, pp. 2526-2533.
[24] Yun X, Bachmann E, McGhee R., “A simplified quaternion-based algorithm for orientation estimation from earth gravity and magnetic field measurements,” IEEE Transactions on
Instrumentation and Measurement, 57(3), 2008, pp. 638-650.
〔受付日 2016. 2. 15〕 〔採録日 2016. 5. 24〕