Theoretical Investigation on the Electronic
Structures of Novel Red Phosphor Materials
Based on Mn?? Ion and Its Isoelectronic Ions
著者(英)
Novita Mega
学位名
博士(理学)
学位授与機関
関西学院大学
学位授与番号
34504甲第559号
Dissertation
Theoretical Investigation on the Electronic Structures
of Novel Red Phosphor Materials Based on Mn
4+Ion
and Its Isoelectronic Ions
Mega Novita
67012601
Department of Chemistry
Graduate School of Science and Technology
Kwansei Gakuin University
i
ABSTRACT
In recent years, many researchers have much attention in Mn4+ due to its potential applications as red phosphors for the current white light emitting diode (LED) devices. Specifically, Mn4+ doped in K2SiF6 or in K2TiF6 has recently been used as a red
phosphor in LED lamps which exhibits white light source with correlated color temperature (CCT) ~3000 K and color rendering index (CRI) ~90. It is therefore known to be suitable to improve the white LED quality. However, due to instability problem, it is quite difficult to use this compound for industrial scale. A more stable red phosphor material is desired.
Since there are infinite numbers of possible red phosphor materials, trial and error experiments are rather inefficient. In this dissertation, the guidelines to develop novel red phosphor materials based on the non-empirical first-principles discrete-variational multi-electron (DVME) method have been explored. The structure and electronic properties of Mn4+ doped in variety of host crystals with fluorine or oxygen anions have been studied thoroughly. Considering that the spectroscopic properties of the red phosphor materials are characterized primarily by the absorption and emission spectra, the transition energies such as 4A2 → 4T2 (U-band), 4A2 → 4T1a (Y-band) and 2E → 4A2
(R-line) were investigated in detail. The effect of lattice relaxation on the multiplet energies was also examined. Some energy corrections such as configuration dependent correction (CDC) and correlation correction (CC) were considered to improve the accuracy of the calculations.
In this work, the investigation of novel red phosphor materials was started with the study of Mn4+ activated in fluoride host crystals. The optical properties of Mn4+ doped in A2BF6 host crystals with (1) cubic structure such as Cs2MnF6, Cs2GeF6, Rb2GeF6,
Rb2SiF6, Cs2SiF6, K2SiF6, and Rb2MnF6 and (2) rhombohedral structure such as
Na2GeF6, Na2SiF, Na2TiF, Rb2GeF6, K2GeF6, K2TiF6, and Li2MnF6 have been studied
in detail. The lattice relaxation rate was estimated by performing the Mn K-edge Extended X-ray Absorption Fine Structure (EXAFS) measurement of K2MF6 (M = Si,
ii
Ge, or Ti): Mn4+. The observed Mn-F bond lengths were then used to estimate the lattice relaxation rate of the other compounds. The multiplet energies of the Mn4+ doped in A2BF6 crystals were qualitatively reproduced by considering lattice relaxation,
CDC, and CC. When the Mn-F bond length decreased, the U- and Y-band energies increased whereas the R-line energy decreased. The low symmetry effect was also investigated by comparing the polytypes of fluoride crystals with different symmetry.
In order to get deeper understanding on Mn4+ ion, a comparative study on the multiplet energies of MgO: V2+, Cr3+, and Mn4+ has been performed. The lattice relaxation effect was estimated by geometry optimization using the CAmbridge Serial Total Energy Package (CASTEP) code. The effect of spin polarization was considered and the calculations based on the Local Density Approximation and Hubbard U (LDA+U) approach were also performed for comparison. The results show that the multiplet energies increase as the charge of the transition metal (TM) ion increases. The detailed comparison between the experimental and the theoretical values shows that the multiplet energies are well reproduced by the first-principle calculations with considering CDC-CC correction based on the optimized clusters including the spin-polarization effect. This fact indicates that the consideration of lattice relaxation is very important to reproduce the tendency of the multiplet energies. However, a simple calculation using the geometry optimization without consideration of LDA+U approximation would be effective for the prediction of the multiplet energies.
In addition, we also investigated the effect of pressure on the multiplet energy levels of d3 ions. Two types of model clusters; non-optimized and optimized clusters generated from α-Al2O3: Cr3+ or Mn4+ were used for the calculations. The
non-optimized cluster was constructed based on the experimental crystal structure of α-Al2O3 having the applied pressures from 0 to 113 GPa. On the other hand, the
optimized cluster including the lattice relaxation effect was constructed using CASTEP geometry optimization with considering the effect of spin polarization. The pressure from 0 to 120 GPa was applied. The results show that the calculated multiplet energies with considering lattice relaxation, CDC, and CC agree with the experimental data excellently and are consistent with our calculation of Mn4+ doped in fluoride crystals.
iii
The results also show that when the applied pressure increases, the U-and Y-band energies increase whereas the R-line energy decreases. Furthermore, an interesting result has also been found in this study. The detailed analysis show that the electron-electron repulsion decreased due to the significant increase of the electron correlation effect in spite of the contraction of the molecular orbitals which indicates that the decrease of the Coulomb repulsion is not necessarily due to the expansion of molecular orbitals as explained by the ordinary Nephelauxetic effect.
iv TABLE OF CONTENT ABSTRACT i TABLE OF CONTENT iv 1. Introduction 1 1.1. Background 1
1.2. Purpose of This Study 5
1.3. Outline of This Dissertation 5
References 6
2. Computational Method 12
2.1. DV-Xα Method 12
2.2. DVME Method 14
2.3. Lattice Relaxation Estimation 17
2.3.1. Shannon’s crystal radii 17
2.3.2. K-edge EXAFS spectra 17
2.3.3. CASTEP code 18
2.4. Energy Corrections 18
2.4.1. Configuration dependent correction 18
2.4.2. Correlation correction 20
2.5. Coulomb Integrals 20
References 22
3. Red Phosphor Materials: Investigation of Optical Properties of Mn4+-Doped
Fluorides 25
3.1. Experimental Mn K-edge EXAFS Spectra 25
3.2. Model Description 28
3.3. Theoretical Multiplet Energies 29
v
3.3.2. U-band and Y-band energies 30
3.4. Effects of Covalency and Electron Correlation 37
3.5. Low Symmetry Effect 41
References 46
4. Prospective Red Phosphors Based on d3 Ion-Doped Oxides 48
4.1. Comparative Study of the Isoelectronic d3 Ions in MgO 48
4.1.1. Model description 48
4.1.2. Theoretical multiplet energies 53
4.1.3. Effects of covalency and electron correlation 59
4.2. Effect of External Pressure on the Multiplet Energies of d3 Ions in α-Al2O3 63
4.2.1. Geometry optimization 63
4.2.2. MO energy levels 66
4.2.3. Optical transition of α-Al2O3: Cr3+ under pressure 70
4.2.4. Predicted multiplet energies of α-Al2O3: Mn4+ under pressure 74
4.2.5. Inverse Nephelauxetic effect 74
References 75
5. Conclusion 77
ACKNOWLEDGMENT 80
1
CHAPTER 1
Introduction
1.1. Background
Last year, the Nobel Prize in Physics was awarded to Isamu Akasaki, Hiroshi Amano and Shuji Nakamura for "the invention of efficient blue light emitting diodes (LED) which has enabled bright and energy-saving white light sources". Using the blue LED, white light can be created in a new way. This development on the solid state lightings has begun to replace the conventional incandescent and fluorescent lamps. By interposing phosphor, the blue light emitted from LED can be converted into light of different wavelength (in the visible spectrum) that is useful for illumination purposes. The total of the emitted light from the phosphor and the LED chip provides a color point with corresponding color coordinates (x and y) and correlated color temperature (CCT). On the other hand, its spectral distribution provides a color rendering capability which can be measured by the color rendering index (CRI).
In this 21st century, the white LEDs are in high demand as general lighting source used in residential houses, offices, stores, etc. The most popular white LED [1-3] was constructed by combination of a blue InGaN LED chip [4-8] and a yellow Y3Al5O12
(YAG): Ce3+ phosphor [9-12] and has been widely commercialized since 1996. The emitted blue light from the LED chip is converted into white light by the phosphor. Due to the characteristics of low energy cost, long lifetime, free of mercury, compact, and lightweight [13-22], these LEDs have been used for various applications such as liquid crystal display (LCD) backlighting, traffic signal, and the replacement of conventional light bulbs or fluorescent lamps [23].
2
However, with the current two-color white LED it is impossible to obtain white LEDs with high CRI. The combination of yellow YAG: Ce3+ emission and blue LED radiation gives ‘cool-white’ light with CCT greater than 4000 K and CRI values of 70-80 [24, 25]. This type of white LED produces a pseudo white light due to a deficiency of red emission [26, 27]. Many efforts have been made both experimentally and theoretically to overcome the above problem. The combination of primary colored LEDs seems to be ideal, however this type is expensive. Therefore, a modification on the current white LED such as adding a red phosphor into the system is preferable.
Search of novel red phosphor materials or those containing red emission components is a useful approach for the realization of white LED applications [28-30]. Based on the practical point of view, an ideal red phosphor for white LED should have good luminescence properties such as broad maximum excitation band in blue, high chemical and thermal stability, and high luminescence efficiency. Most importantly, they need to have an emission peak in the red region. Among the various red phosphor materials, those including rare earth (RE) ions such as Eu2+ have been regarded as a good class of phosphor and popularly used [31-34]. Although they have high luminescence efficiency, stability, and low thermal quenching, however, RE elements are known to be expensive. On the other hand, transition metal (TM) ions as luminescent centers in various crystals have been studied in a great number of experiments and calculations [35, 36]. For example Mn4+ activated in various oxide [37-47], nitride [48, 49], and fluoride host crystals [50-59] have recently drawn increasing attention as display materials to established electronic technologies.
Since the optical properties of red phosphor materials are strongly related to the electronic structures, it is necessary to understand the mechanism of interaction between light and electrons from a view of quantum chemistry. The quantum states of an impurity ion in crystals are generally called as “multiplets”. Those multiplets are basically dominated by correlations among the electrons occupying the open-shell orbitals. Ligand field theory (LFT) has been widely used and quite successfully applied to the interpretation of the multiplet energy levels and optical spectra of TM ions in crystals. In the original formulation of LFT [60, 61], only the octahedral (Oh) crystal
3
field was considered. The fivefold degenerate 3d level splits into a doubly degenerate eg
level with additional energy +6Dq and a triply degenerate t2g level with additional
energy –4Dq. Thus the crystal field splitting is 10Dq where Dq is the so called crystal field strength which varies depending on the combination of ions and crystals. In this case, the effect of covalency is also taken into account through an electron-electron repulsion parameter, A, B, and C, which are known as the Racah parameters. Accordingly, the multiplet energy levels Ei can be expressed in terms of the crystal field
strength Dq and Racah parameters B and C. The energy levels of all dN systems under an octahedral crystal field have been calculated as a function of Dq and summarized as the well-known Tanabe Sugano diagrams [62], Ei/B are depicted as functions of Dq/B
for a fixed value of C/B.
Moreover, the spectroscopic properties of the red phosphor materials are characterized primarily by the absorption and emission spectra. In the case of Mn4+-doped compounds, since it has three electrons occupying ten degenerate 3d orbitals (3d3 configuration), there are some doublet states i.e., 2E, 2T1, 2T1, etc., and
some quartet states i.e., 4A2, 4T2, 4T1a, 4T1b, etc. The 4A2 state is the ground state and has
the lowest energy. On the employment as red phosphor materials, the transitions from
4
A2 to 4T2 (U-band) and 4T1a (Y-band) are utilized for the absorption process, while the
transition from 2E to 4A2 (R-line) is utilized for the emission process.
However, LFT is an empirical method where the parameters such as Racah parameters or the crystal field splitting are determined by the observed spectrum. Therefore, it cannot predict the optical properties of unknown or hypothetical materials. Since the TM-doped crystals have quite important applications as optical materials such as solid state lasers or display materials, non-empirical (first-principle or ab-initio) prediction of multiplet structures of TM ions in crystals is quite important for theoretical design of new materials with improved properties.
As for the multiplet energy calculations, the first non-empirical prediction based on a combination of the local density approximation (LDA) calculation and LFT was performed by Watanabe and Kamimura in late 1980’s [63-65]. On the other hand, the first-principle calculations based on the density functional theory (DFT) have also been
4
carried out by several groups such as Daul et al. [66] and Wissing et al. [67]. They used a symmetry reduction approach to obtain multiplet energy levels. Those approaches could not be applied to the direct calculations of the optical spectra. This is because the many-electron wave functions were not obtained. Further, a more accurate approach to estimate the absolute multiplet energies has been applied to TM ions in crystals by Seijo
et al. [68, 69] and Barandiarán et al. [70]. They combined a Hartree-Fock-type
calculation and configuration interaction (CI). However, due to the high computational cost, it is hard to apply this approach to complicated phosphor materials. For the analysis of X-ray absorption near-edge structure (XANES) spectra of TM ions, the theoretical analysis based on the crystal-field multiplet calculation was developed by de Groot et al., [71, 72] where crystal-field effects are incorporated into an atomic multiplet program using group theoretical formalism. Although this approach has been successfully reproduced the multiplet structures and has greatly contributed to interpret the observed spectra of many TM compounds, it employs adjustable parameters.
For the past several years, our laboratory has developed a non-empirical first-principle many-electron calculation method called the discrete-variational multi-electron (DVME) method [73-75] for the direct calculation of multiplet structures. For example several studies on the optical absorption spectra of 3d ions [76-81], the calculations of the XANES or ELNES spectra of TM ions [82-85] and the systematic analysis of the energy levels and absorption spectra of trivalent lanthanides [86-91]. Further, DVME method has been proved to be powerful since it has several advantages such as: (1) wide applicability: it can be used for any atom or ion in the periodic table, any symmetry from C1 to spherical, any energy region of transition (IR, VIS, UV, core
excitation, etc.), and any type of transition (electric dipole, magnetic dipole, etc.); (2) easy user interface: model clusters and point charges can be created from Crystallographic Information File (CIF) data, effective for calculations of complicated phosphor materials; (3) intuitive analysis: population analysis of molecular orbitals (MOs) and configuration analysis of many-electron wave functions based on minimal basis calculations.
5
1.2. Purpose of This Study
The purpose of this study is to: (1) investigate the electronic structure and optical properties of Mn4+ and its isoelectronic ions doped in variety of host crystals with fluorine or oxygen anions and (2) clarify the factors which determine the tendency of multiplet energies using the non-empirical first-principles DVME method. These researches are important for establishing guidelines to develop novel red phosphor materials.
1.3. Outline of This Dissertation
The studies in this dissertation are outlined below:
Details on the computational procedure of DVME method including some energy corrections are described in Chapter 2. Here, several approaches to estimate the lattice relaxation effect based on Shannon’s ionic (or crystal) radii, Extended X-ray Absorption Fine Structure (EXAFS), and geometry optimization using the CAmbridge Serial Total Energy Package (CASTEP) code are also explained.
Chapter 3 presents the results for the calculated electronic structures and optical properties of Mn4+ doped in various A2BF6 crystals which have (1) cubic structures such
as Cs2MnF6, Cs2GeF6, Rb2GeF6, Rb2SiF6, Cs2SiF6, K2SiF6, and Rb2MnF6 or (2)
rhombohedral structure such as Na2GeF6, Na2SiF, Na2TiF, Rb2GeF6, K2GeF6, K2TiF6,
and Li2MnF6. The estimation of the lattice relaxation effect by performing the Mn
K-edge EXAFS measurement of K2MF6 (M = Si, Ge, or Ti): Mn4+ is explained.
An investigation on the prospective red phosphor materials based on oxide crystals is described in Chapter 4. First, a comparative study of the multiplet energies of the isoelectronic 3d3 ions such as V2+, Cr3+, and Mn4+ in MgO host crystal using the first-principle calculations is described. The effect of lattice relaxation considered based on geometry optimization using first-principle band-structure calculations is discussed. The spin-polarization effect and the effect of Hubbard U in the optimization process are
6
also discussed. Next, the investigation on the pressure dependence of the multiplet energies of α-Al2O3: Cr3+ and Mn4+ are described in detail. The results of the
first-principle calculations using the optimized cluster including the effect of spin polarization and with including CDC-CC correction are compared with the experimental data under pressure. The effect of covalency and the effect of the electron correlation on the tendency of the multiplet energies are thoroughly discussed.
Finally, Chapter 5 will serve to describe the main findings of the work in this dissertation.
References
[1]. Y. Shimizu, K. Sakano, Y. Noguchi, and T. Moriguchi: U.S. Patent 6614179 (2003).
[2]. R. Mueller-Mach, G. O. Mueller, M. R. Krames, and T. Trottier: IEEE J. Sel. Top. Quantum Electron., 8 (2002) 339.
[3]. R. Mueller-Mach, G. O. Mueller, M. R. Krames, H. A. Hoppe, F. Stadler, W. Schnick, T. Juestel, and P. Schmidt: Phys. Status Solidi A 202 (2005) 1727. [4]. S. Nakamura, T. Mukai, and M. Senoh: Appl. Phys. Lett., 64 (1994) 1687. [5]. S. Nakamura, T. Mukai, and M. Senoh: J. Appl. Phys., 76 (1994) 8189.
[6]. K. Tadatomo, H. Okagawa, Y. Ohuchi, T. Tsunekawa, Y. Imada, M. Kato, and T. Taguchi: Jpn. J. Appl. Phys., 40 (2001) L583.
[7]. L. Narayan, H. Wang, J. Ye, S. J. Hon, K. Fox, J. C. Chen, H. K. Choi, and J. C. Fan: J. Appl. Phys., 81 (2002) 841.
[8]. D. F. Feezell, J. S. Speck, S. P. Denbaars, and S. Nakamura: J. Disp. Technol., 9 (2013) 190.
[9]. R. Mueller-Mach and G. O. Mueller: White Light Emitting Diodes for
Illumination, in Proc. SPIE, Light Emitting Diode: Research, Manufacturing, and Application IV, Vol. 3938, H. W. Yao, I. T. Ferguson, and E. F. Schubert, Eds.
(Bellingham, WA, 2000) p. 30.
7
LED, in Proc. SPIE, Light-Emitting Diodes: Research, Manufacturing, and Application III, vol. 3621, E. Schubert, I. T. Ferguson, and H. W. Yao, Eds.
(Bellingham, WA, 1999) p. 143.
[11]. D. Doxsee, A. Srivastava, H. Comanzo, T. McNulty, and W. Beers: Garnet
phosphors for white LEDs, in 198th ECS (Phoenix, AZ, 2000) p. 921.
[12]. R. Mueller-Mach, G. O. Mueller, T. Trottier, G. Sorce, and D. Prendill: New
Phosphors for Phosphor converted Light Emitting Diodes, in 198th ECS (Phoenix,
AZ, 2000) p. 920.
[13]. G. Blasse and A. Bril: Appl. Phys. Lett., 11 (1967) 53.
[14]. X. Q. Piao, T. Horikawa, H. Hanazawa, and K. Machida: Appl. Phys. Lett., 88 (2006) 161908.
[15]. D. Y. Wang, C. H. Huang, Y. C. Wu, and T. M. Chen: J. Mater. Chem., 21 (2011) 10818.
[16]. D. Geng, G. Li, M. Shang, D. Yang, Z. Zhang, Z. Cheng, and J. Lin: J. Mater. Chem., 22 (2012) 14262.
[17]. H. S. Jang and D. Y. Jeon: Opt. Lett., 32 (2007) 3444.
[18]. S. Ye, F. Xiao, Y. X. Pan, Y. Y. Ma, and Q. Y. Zhang: Mater. Sci. Eng. R 71 (2010) 1.
[19]. Y. C. Chiu, C. H. Huang. T. J. Lee, W. R. Liu, Y. T. Yeh, S. M. Jang, and R. S. Liu: Opt. Exp., 19 (2011) 331.
[20]. S. Nakamura and G. Fasol: The Blue Laser Diode: GaN Based Light Emitters and
Laser (Springer-Verlag, Berlin, 1997) pp. 216–219.
[21]. J. J. Wierer, J. Y. Tsao, and D. S. Sizov: Laser Photon Rev., 7 (2013) 963. [22]. C.-C. Yang, H.-Y. Tsai, and K.-C. Huang: Opt. Rev., 20 (2013) 232. [23]. E. F. Schubert and J. K. Kim: Science 308 (2005) 1274.
[24]. R. Zhang, H. Lin, Y. L. Yu, D. Q. Chen, J. Xu, and Y. S. Wang: Laser Photonics Rev., 8 (2014) 158.
[25]. K. A. Denault, N. C. George, S. R. Paden, S. Brinkley, A. A. Mikhailovsky, J. Neuefeind, S. P. DenBaars, and R. Seshadri: J. Mater. Chem., 22 (2012) 18204. [26]. M. Yamada, T. Naitou, K. Izuno, H. Tamaki, Y. Murazaki, M. Kameshima, and T.
8
[27]. R. J. Xie, N. Hirosaki, M. Mitomo, K. Takahashi, and K. Sakuma: Appl. Phys. Lett., 88 (2006) 101104.
[28]. R. J. Xie and N. Hirosaki: Sci. Tech. Adv. Mater., 8 (2007) 588.
[29]. Y. Narukawa, J. Narita, T. Sakamoto, K. Deguchi, T. Yamada, and T. Mukai: Jpn. J. Appl. Phys., 45 (2006) L1084.
[30]. M. R. Krames, O. B. Shchekin, R. Mueller-Mach, G. O. Mueller, Z. Ling, G. Harbers, and M. G. Craford: J. Disp. Technol., 3 (2007) 160.
[31]. S. E. Brinkley, N. Pfaff, K. A. Denault, Z. Zhang, H. T. (Bert) Hintzen, R. Seshadri, S. Nakamura, and S. P. Denbaars: Appl. Phys. Lett., 99 (2011) 241106. [32]. H. Nersisyan, H. I. Won, and C. Won: Chem. Commun., 47 (2011) 11897. [33]. S. Sakata, T. Yamao, and T. Yamada: U.S. Patent 8148886 (2012).
[34]. D. Tao and Y. Li: U.S. Patent 0234589 A1 (2013).
[35]. R. C. Powell: Physics of Solid State Laser Materials (Springer-Verlag, Berlin, 1998).
[36]. S. Kück: Appl. Phys. B 72 (2001) 515.
[37]. M. Srivastava and W. W. Beers: J. Electrochem. Soc., 143 (1996) L203. [38]. Z. Bryknar: Ferroelectrics 298 (2004) 43.
[39]. D. Galanciak, M. Grinberg, W. Gryk, S. Kobyakov, A. Suchocki, G. Boulon, and A. Brenier: J. Phys. Condens. Matter 17 (2005) 7185.
[40]. V. Singh, V. Natarajan, and J. –J. Zhu: Opt. Mater., 30 (2007) 468.
[41]. A. S. Alexandrovsky, I. A. Gudim, A. S. Krylov, and V. L. Temerov: Phys. Solid State 49 (2007) 1695.
[42]. Y. Zhydachevksii, A. Durygin, V. A. Drozd, A. Suchocki, D. Y. Sugak, and J. Wróbel: J. Phys. Condens. Matter 20 (2008) 095204.
[43]. L. A. Riseberg and M. J. Weber: Solid State Commun., 9 (1971) 791.
[44]. Y. Zhydachevskii, D. Galanciak, S. Kobyakov, M. Berkowski, A. Kamińska, A. Suchocki, Y. Zakharko, and A. Durygin: J. Phys. Condens. Matter 18 (2006) 11385.
[45]. H. G. Kang, J. K. Park, C. H. Kim, and S. C. Choi: J. Ceram. Soc. Jpn., 117 (2009) 647.
9
[47]. J. Stade, D. Hahn, and R. Dittmann: J. Lumin., 8 (1974) 318.
[48]. B. Han, R. Y. Korotkov, B. W. Wessels, and M. P. Ulmer: Appl. Phys. Lett., 84 (2004) 5320.
[49]. F. Karel, J. Pastrňák, and J. Rosa: J. Phys. B 19 (1969) 974. [50]. S. Adachi and T. Takahashi: J. Appl, Phys. 106 (2009) 013516. [51]. Y. K. Xu and S. Adachi: J. Electrochem. Soc., 158 (2011) J58.
[52]. A. A. Setlur, E. V. Radkov, C. S. Handerson, J. –H. Her, A. M. Srivastava, H. Karkada, M. S. Kishore, N. P. Kumar, D. Aesram, A. Deshpande, B. Kolodin, L. S. Grigorov, and U. Happek: Chem. Mater., 22 (2010) 4076.
[53]. S. Adachi and T Takahashi: J. Appl. Phys., 104 (2008) 023512. [54]. T. Takahashi and S. Adachi: J. Electrochem. Soc., 155 (2008) E183. [55]. R. Kasa and S. Adachi: J. Appl. Phys. 112 (2012) 013506.
[56]. M. Novita and K. Ogasawara: Jpn. J. Appl. Phys., 51 (2012) 022604. [57]. Y. K. Xu and S. Adachi: J. Appl. Phys., 105 (2009) 013525.
[58]. T. Takahashi and S. Adachi: Electrochem. Solid-State Lett., 128 (2009) J69. [59]. C. Liao, R. Cao, Z. Ma, Y. Li., G. Dong, K. N. Sharafudeen, and J. Qiu: J. Am.
Ceram. Soc., 96 (2013) 3552.
[60]. Y. Tanabe and S. Sugano: J. Phys. Soc. Jpn., 9 (1954) 753. [61]. Y. Tanabe and S. Sugano: J. Phys. Soc. Jpn., 9 (1954) 766.
[62]. S. Sugano, Y. Tanabe, and H. Kamimura: Multiplets of Transition-Metal Ions in
Crystals (Academic Press, New York, 1970).
[63]. S. Watanabe and H. Kamimura: J. Phys. Soc. Jpn., 56 (1987) 1078. [64]. S. Watanabe and H. Kamimura: J. Phys. C 20 (1987) 4145.
[65]. S. Watanabe and H. Kamimura: Mater. Sci. Eng. B 3 (1989) 313. [66]. C. Daul: Int. J. Quantum Chem., 52 (1994) 867.
[67]. K. Wissing, J. A. Aramburu, M. T. Barriuso, and M. Moreno: Solid State Commun., 108 (1998) 1001.
[68]. R. Llussar, M. Casarrubios, Z. Barandiarán, and L. Seijo: J. Chem. Phys., 105 (1996) 5321.
[69]. S. L. Moraza and Z. Barandiarán: J. Chem. Phys., 105 (1996) 50.
10
[71]. F. M. F. de Groot: J. Electron Spectrosc. Relat. Phenom., 67 (1994) 529. [72]. F. M. F. de Groot: Chem. Rev., 101 (2001) 1779.
[73]. K. Ogasawara, T. Ishii, Y. Ito, H. Ida, I. Tanaka, and H. Adachi: Jpn. J. Appl. Phys.,
37 (1998) 4590.
[74]. K. Ogasawara, T. Ishii, I. Tanaka, and H. Adachi: Mater. Trans. JIM 40 (1999) 396.
[75]. K. Ogasawara, T. Ishii, I. Tanaka, and H. Adachi: Phys. Rev. B 61 (2000) 143. [76]. M. G. Brik and K. Ogasawara: Phys. Stat. Sol. (b) 243 (2006) 2864.
[77]. M. G. Brik: J. Phys. Chem. Solids 67 (2006) 856. [78]. M. G. Brik: Physica B 387 (2007) 69.
[79]. M. G. Brik: J. Lumin., 124 (2007) 23.
[80]. S. Watanabe, T. Sasaki, R. Tanigushi, T. Ishii, and K. Ogasawara: Phys. Rev. B 79 (2009) 075109.
[81]. M. Novita and K. Ogasawara: J. Phys. Soc. Jpn., 81 (2012) 104709.
[82]. Kazuyoshi Ogasawara, Takahiro Iwata, Yukinori Koyama, Takugo Ishii, Isao Tanaka, and Hirohiko Adachi: Phys. Rev. B 64 (2001) 115413.
[83]. M. G. Brik, K. Ogasawara, T. Ishii, H. Ikeno, and I. Tanaka: Radiat. Phys. Chem.,
75 (2006) 1564.
[84]. M. G. Brik, K. Ogasawara, H. Ikeno, and I. Tanaka: Eur. Phys. J. B 51 (2006) 345. [85]. H. Ikeno, I. Tanaka, Y. Koyama, T. Mizoguchi, and K. Ogasawara: Phys. Rev. B
72 (2005) 075123.
[86]. K. Ogasawara, S. Watanabe, Y. Sakai, H. Toyoshima, T. Ishii, M. G. Brik, and I. Tanaka: Jpn. J. Appl. Phys., 43 (2004) L611.
[87]. K. Ogasawara, S. Watanabe, T. Ishii, and M. G. Brik: Jpn. J. Appl. Phys., 44 (2005) 7488.
[88]. K. Ogasawara, S. Watanabe, H. Toyoshima, T. Ishii, M. G. Brik, H. Ikeno, and I. Tanaka: J. Solid State Chem., 178 (2005) 412.
[89]. K. Ogasawara, S. Watanabe, H. Toyoshima, and M. G. Brik, in: Handbook on the
Physics and Chemistry of the Rare Earths, Vol. 37, edited by K. A. Gschneidner
Jr., J.-C. G. Bünzli, and V. K. Pecharsky (North-Holland Co., Amsterdam, 2007) pp. 1–59.
11
[90]. H. Yoshida, R. Yoshimatsu, and K. Ogasawara: J. Lumin., 122-123 (2007) 488. [91]. S. Watanabe and K. Ogasawara: J. Phys. Soc. Jpn., 77 (2008) 084702.
12
CHAPTER 2
Computational Method
The discrete-variational multi-electron (DVME) [1-3] method is a hybrid method involving density-functional theory (DFT) [4, 5] and a configuration interaction (CI) calculation. It is available in two versions; (1) the non-relativistic version developed in 1998 [6-18] and (2) the relativistic version developed in 2000 [19-24]. Since the relativistic effect of transition metal (TM) doped compounds are quite small, in this work, the non-relativistic DVME version was used and later will be called as DVME method for simplicity.
2.1. DV-Xα Method
Fundamentally, DVME method contains two steps. In the first step, the one-electron molecular orbital (MO) calculations are performed by the DV-Xα method [25-30]. The numerically generated atomic orbitals (AO) are used as basis functions [31-34]. The AOs are optimized to the chemical environment during the self-consistent-field calculation.
In principle, the electronic structures of materials are obtained from the quantum mechanical calculation of systems containing nuclei and electrons. The electronic structure in a molecule is expressed in the Schrödinger equation as follows
ℎ𝜓(𝐫) = ε𝜓(𝐫), (2.1) where 𝐫 is the position of the electron, while 𝜓 and 𝜀 are the MO wave function and its energy. In this case, ℎ represents the one-electron Hamiltonian which is given by
13 ℎ(𝐫) =1
2∇2+ 𝑉(𝐫). (2.2) 𝑉(𝐫) is the effective molecular potential, described as
𝑉(𝐫) = − ∑ 𝑍𝑣 |𝐫 − 𝐑𝑣| 𝑣 + ∫ 𝜌(𝐫′) |𝐫′− 𝐫|𝑑𝐫′− 3𝛼 { 3 8𝜋𝜌(𝐫)} 1 3 ⁄ , (2.3)
where 𝑍𝑣 and 𝐑𝑣 are the atomic number and position of atom 𝑣, respectively. The first and second terms of eq. (2.3) are the attractive potential from the nuclei and the repulsive potential of the electron cloud of the whole system, respectively. The third term is the exchange-correlation potential proposed by Slater [35, 36]. The only parameter used in this method, 𝛼, was fixed to be 0.7 which has been found to be the most appropriate value for many cases [27]. 𝜌 is the electron density given by
𝜌(𝐫) = ∑ 𝜌𝑙(𝐫)
𝑙
= ∑ 𝑓𝑙|𝜙𝑙(𝐫)|2 𝑙
, (2.4)
where 𝑓𝑙 is the occupancy of 𝜙𝑙.
Further, the oscillator strength due to the electric dipole transition can be calculated by 𝐼𝑖𝑓 = 2(𝐸𝑓− 𝐸𝑖)|⟨𝜓𝑓|𝐫 ∙ 𝐞|𝜓𝑖⟩|2 (2.5) or 𝐼𝑖𝑓 =2 3(𝐸𝑓− 𝐸𝑖)|⟨𝜓𝑓|𝐫|𝜓𝑖⟩| 2 , (2.6) for anisotropic or average calculation, respectively. In this case, 𝜓𝑖 and 𝜓𝑓 are the one-electron wave functions of the initial and final states.
14
2.2. DVME Method
In the second step, which is the main part of the DVME method, the many-electron calculations using CI method are performed. In this case, the electron-electron interactions are directly calculated. The many-electron Schrödinger equation is described as
𝐻Ψ = 𝐸Ψ. (2.7)
E and Ψ are the energy and the many-electron wave functions which can be described
as
𝚿𝑙 = ∑ 𝑊𝑗𝑙
𝑛
𝑗=1
𝚽𝑗. (2.8)
𝑊𝑗𝑙 is the coefficient of the jth Slater determinant in the lth many-electron wave function and n is the total number of Slater determinants used for the linear combination, while 𝚽𝑗 is 𝚽𝑗(𝐫1, … , 𝐫𝑛) = 1 √𝑛!|| 𝜙𝑗1(𝐫1) 𝜙𝑗1(𝐫2) 𝜙𝑗2(𝐫1) 𝜙𝑗2(𝐫2) … ϕ𝑗1(𝐫𝑛) … 𝜙𝑗2(𝐫𝑛) ⋮ ⋮ 𝜙𝑗𝑛(𝐫1) 𝜙𝑗𝑛(𝐫2) … 𝜙⋱ 𝑗𝑛⋮(𝐫𝑛) || , (2.9)
where 𝜙𝑗’s are the molecular orbitals mainly consisting of TM 3d orbitals. On the other hand, 𝐻 is the many-electron Hamiltonian and can be expressed as
𝐻 = ∑ ℎ(𝐫𝑖) 𝑀 𝑖=1 + ∑ ∑ 𝑔(𝐫𝑖, 𝐫𝑗) 𝑗>1 𝑖 , (2.10)
where M is the number of the explicitly treated electrons, and h and g are the one-electron and two-electron operators expressed as
15 { ℎ(𝐫𝑖) = −1 2∇𝑖2+ 𝑉nuc(𝐫𝑖) + 𝑉0(𝐫𝑖) 𝑔(𝐫𝑖, 𝐫𝑗) =𝑟1 𝑖𝑗 . (2.11)
Here, 𝐫𝑖 is the position of the ith electron, 𝑟𝑖𝑗 is the distance between the ith electron and the jth electron, 𝑉𝑛𝑢𝑐 is the potential due to the nuclei, and 𝑉0 is the potential due to the other electrons. Therefore, only electrons occupying impurity levels are treated explicitly.
In order to obtain the many-electron wave functions and the multiplet energies, H is diagonalized within the subspace spanned by the Slater determinants Φ𝑖 constructed
from the impurity-state orbitals obtained from the one-electron MO calculation. The matrix element of the effective many-electron Hamiltonian H between two Slater determinants, Φ𝑝 and Φ𝑞, can be generally expressed as
𝐻𝑝𝑞 = ⟨Φ𝑝|𝐻|Φ𝑞⟩ = ∑ ∑ 𝐴𝑖𝑗𝑝𝑞⟨𝑖|h|𝑗⟩ 𝐿 𝑗=1 𝐿 𝑖=1 + ∑ ∑ ∑ ∑ 𝐵𝑖𝑗𝑘𝑙𝑝𝑞 ⟨𝑖𝑗|g|𝑘𝑙⟩ 𝐿 𝑙=1 𝐿 𝑘=1 𝐿 𝑗=1 𝐿 𝑖=1 , (2.12)
where L is the number of impurity-state orbitals and 𝐴𝑖𝑗𝑝𝑞 and 𝐵𝑖𝑗𝑘𝑙𝑝𝑞 are coefficients obtained by the expansion of Slater determinants. Here, ⟨𝑖|h|𝑗⟩ and ⟨𝑖𝑗|g|𝑘𝑙⟩ are defined by ⟨𝑖|h|𝑗⟩ = ∫ 𝜙𝑖∗(𝐫)ℎ(𝐫)𝜙 𝑗(𝐫)𝑑𝐫 (2.13) and ⟨𝑖𝑗|g|𝑘𝑙⟩ = ∫ ∫ 𝜙𝑖∗(𝐫 1)𝜙𝑗∗(𝐫2) 1 𝑟12𝜙𝑘(𝐫1)𝜙𝑙(𝐫2)𝑑𝐫1𝑑𝐫2, (2.14) respectively, where 𝜙 denotes the selected orbitals obtained by the cluster calculation. These matrix elements are calculated numerically using the DV integration scheme [25] as follows:
16 ⟨𝑖|h|𝑗⟩ = ∑ 𝜔(𝐫𝛼)𝜙𝛼∗(𝐫 𝛼)ℎ(𝐫𝛼)𝜙𝑗(𝐫𝛼) 𝛼 (2.15) and ⟨𝑖𝑗|g|𝑘𝑙⟩ = ∑ 𝜔(𝐫𝛼)𝜙𝑖∗(𝐫𝛼) 𝛼 [ ∑ 𝜔(𝐫𝛽)𝜙𝑖∗(𝐫𝛽) 𝛽(≠𝛼) 1 𝐫𝛼𝛽𝜙𝑙(𝐫𝛽)] 𝜙𝑘(𝐫𝛼), (2.16) where 𝐫𝛼 is a sampling point, and 𝜔 is a weight function proportional to the inverse of the sampling point density. The multiplet energy levels can be easily obtained by diagonalization of the Hamiltonian matrix.
Using the eigenvector obtained by the diagonalization of the many-electron Hamiltonian, the many-electron wave functions corresponding to each multiplet state can be obtained explicitly as a linear combination of the Slater determinants. Therefore, the oscillator strength for the electric-dipole transition (transition probability) between multiplets can be calculated directly using
𝐼𝑖𝑓 = 2(𝐸𝑓− 𝐸𝑖) |⟨Ψ𝑓| ∑ 𝐫𝒌 𝒏 𝒌=𝟏 . 𝐞|Ψ𝑖⟩| 2 (2.17) or 𝐼𝑖𝑓 =2 3(𝐸𝑓− 𝐸𝑖) |⟨Ψ𝑓| ∑ 𝐫𝒌 𝒏 𝒌=𝟏 |Ψ𝑖⟩| 2 , (2.18)
for anisotropic and average calculations, respectively, where Ψ𝑖 and Ψ𝑓 are the many-electron wave functions of the initial and final states, while 𝐸𝑖 and 𝐸𝑓 are the energy eigenvalues of these states. 𝐫 denotes the position of the electron, and e denotes the unit vector parallel to the direction of the electric field of the incident light.
17
2.3. Lattice Relaxation Estimation
When a transition metal (TM) ion substitutes for a metal (M) ion, the transition metal-ligand (TM-L) bond lengths become shorter or longer than that of the original metal-ligand (M-L) bond lengths. This is due to the nature of the lattice relaxation. Therefore, in order to estimate the bond lengths change, some approaches are considered.
2.3.1. Shannon’s crystal radii
The simplest approach to estimate the lattice relaxation effect is based on Shannon’s ionic radii and crystal radii [37, 38]. The estimated bond length is calculated by
𝑑(TM-L)relaxed =
𝐶𝑅(TM) + 𝐶𝑅(L)
𝐶𝑅(M) + 𝐶𝑅(L) × 𝑑(M-L)unrelaxed, (2.19) where 𝑑(TM-L) and 𝑑(M-L) represent the bond lengths between transition metal-ligand and metal-ligand bond length, respectively. On the other hand, 𝐶𝑅(TM), 𝐶𝑅(M), and 𝐶𝑅(L) represent the crystal radii of transition metal, metal, and ligand ions, respectively, which can be obtained from Refs. 37 and 38.
2.3.2. K-edge EXAFS spectra
Since the lattice relaxation estimated based on Shannon’s crystal radii are sometimes inaccurate, therefore an improved approach based on experimental TM-L bond lengths is considered. For this purpose, K-edge Extended X-ray Absorption Fine Structure (EXAFS) spectra were measured (Section 3.1). The observed TM-L bond lengths were then used in the calculations.
18 2.3.3. CASTEP code
The CAmbridge Serial Total Energy Package (CASTEP) code [39-41] was used for the structure optimizations. It is a first-principle quantum mechanical code for performing electronic structure calculation which is based on DFT [4, 5] combined with plane-wave basis sets and pseudopotentials [42]. The wave functions of the valence electrons were expanded using a plane-wave basis set within a specified cutoff energy.
In this dissertation, all calculations were performed with the CASTEP module in Materials Studio 6.0. The Vanderbilt [43] ultrasoft pseudopotentials were used and the exchange-correlation potential was considered within the Generalized Gradient Approximation (GGA) proposed by Perdew, Burke, and Ernzerhof (PBE) [44]. The Hellmann-Feynman Theorem was also used for the calculation of the physical forces on the ion and the integrated stress on the unitcell.
2.4. Energy Corrections
Since the multiplet energy levels calculated based on the many-electron calculations are generally overestimated, here some corrections based on the one-electron calculation are introduced.
2.4.1. Configuration dependent correction
The multiplet energies calculated from many-electron CI calculations are generally overestimated due to the overestimation of crystal field splitting by ca. 20% [3]. However, the energy difference between different configurations can be well estimated by one-electron MO calculations using the Slater’s transition-state method [36]. Therefore an introduction of a correction to the barycenter of each configuration based on one-electron MO calculation so called configuration dependent correction (CDC) was used. The barycenters of (t2g)3, (t2g)2(eg)1, (t2g)1(eg)2, and (eg)3 configurations were
19
the one-electron MO calculation. In this approach, the Hamiltonian is expressed as 𝐻𝑝𝑞CDC = 𝐻
𝑝𝑞+ CDC(𝑚, 𝑛)𝛿𝑝𝑞, (2.20)
where CDC(𝑚, 𝑛) is the correction to the terms belonging to the t2gmegn configuration
and 𝛿𝑝𝑞 is defined as
𝛿𝑝𝑞 = {1 𝑓𝑜𝑟 (𝑝 = 𝑞)0 𝑓𝑜𝑟 (𝑝 ≠ 𝑞). (2.21) The value of CDC(𝑚, 𝑛) can be determined as follows.
According to the Slater’s transition state method [36], energy separation between adjacent configuration (t2g)m(eg)n and (t2g)m-1(eg)n+1, can be well approximated by the
one-electron energy difference, (𝑚, 𝑛; 𝑚 − 1, 𝑛 + 1 ) = 𝜀𝑒𝑔− 𝜀𝑡2𝑔, in the Slater’s transition state, (t2g)m-0.5(eg)n+0.5. Then the value of CDC(𝑚, 𝑛) can be determined by
the relation 1 𝑁(𝑚, 𝑛) ∑ 𝐻𝑝𝑝CDC (𝑚𝑝,𝑛𝑝)=(𝑚,𝑛) − 1 𝑁(𝑚 − 1, 𝑛 + 1) ∑ 𝐻𝑝𝑝CDC (𝑚𝑝,𝑛𝑝)=(𝑚−1,𝑛+1) = (𝑚, 𝑛; 𝑚 − 1, 𝑛 + 1 ), (2.22) where 𝑁(𝑚, 𝑛) is the number of Slater determinants belonging to the (t2g)m(eg)n
configuration, and 𝑚𝑝 and 𝑛𝑝 are the numbers of electrons occupying the t2g and eg
states in the pth Salter determinant, respectively.
In the actual calculation, the value of (𝑚, 𝑛, 𝑚 − 1, 𝑛 + 1) does not strongly depend on (𝑚, 𝑛) configuration. Therefore, in the work presented here (𝑚, 𝑛, 𝑚 − 1, 𝑛 + 1) for all configuration is approximated by the value obtained in the ground state,
i.e.,
(𝑚, 𝑛, 𝑚 − 1, 𝑛 + 1) = 𝑒𝑔GS− 𝑡
2𝑔GS = eff, (2.23)
20 1 𝑁(𝑚, 𝑛) ∑ 𝐻𝑝𝑝CDC (𝑚𝑝,𝑛𝑝)=(𝑚,𝑛) = 𝑛 𝑒𝑓𝑓. (2.24) 2.4.2. Correlation correction
Due to the limited number of Slater determinants, the electron correlation effects are underestimated while the electron-electron repulsion integrals are overestimated by ca. 10-50% [45]. We could gradually increase the number of Slater determinants, however this is quite inefficient. Therefore, in order to estimate the absolute multiplet energies quantitatively, a more efficient approach so called the correlation correction (CC) was adopted to take into account the remaining effect of electron correlation. In this approach, all matrix elements of the electron-electron repulsion operator are multiplied by a certain reduction factor c (correlation correction factor). The CC factor c was estimated from first-principle calculations based on the consistency of the transition energy of the spin-flip transition from (t2g↑)3 to (t2g↑)2(t2g↓)1 between the many electron
CI calculations and the spin-polarized one-electron MO calculations.
In the CDC-CC approach where both CDC and CC are taken into account, the final effective Hamiltonian can be expressed as,
𝐻𝑝𝑞CDC-CC = ∑ ∑ 𝐴 𝑖𝑗 𝑝𝑞⟨𝑖|h|𝑗⟩ 𝐿 𝑗=1 𝐿 𝑖=1 + ∑ ∑ ∑ ∑ 𝑐 × 𝐵𝑖𝑗𝑘𝑙𝑝𝑞⟨𝑖𝑗|g|𝑘𝑙⟩ + CDC(𝑚, 𝑛)𝛿𝑝𝑞 𝐿 𝑙=1 𝐿 𝑘=1 𝐿 𝑗=1 𝐿 𝑖=1 . (2.25) 2.5. Coulomb Integrals
The Coulomb integrals for the pure AO’s are expressed in terms of Racah parameters as AO = 𝐴 + 𝐵 + 3𝐶. The Racah parameters can be easily calculated
21
from the radial part of TM-3d AO’s, 𝑅3𝑑(𝑟) using the relation
{ 𝐴 = 𝐹0− 9 1𝐹4 𝐵 = 1 9𝐹2− 5 1𝐹4 𝐶 = 36 1𝐹4 , (2.26)
where 𝐹𝑘 are Slater integrals defined by
𝐹𝑘 = ∫ 𝑟 12𝑑𝑟1 ∞ 0 ∫ 𝑟22𝑑𝑟 2𝑅3𝑑2 (𝑟1)𝑅3𝑑2 (𝑟2) 𝑟<𝑘 𝑟>𝑘+1 ∞ 0 . (2.27) The Coulomb integrals for MO’s are also directly calculated using the MO’s of the impurity states. Here we evaluated these electron-electron repulsion by using the Coulomb integral of both t2g and eg states which are defined in atomic units by
MO(𝑡2𝑔,𝑡2𝑔) = ∫ ∫|𝜙𝑡2𝑔(𝐫1)| 2 1 𝑟12|𝜙𝑡2𝑔(𝐫2)| 2 𝑑𝐫1𝑑𝐫2, (2.28) MO(𝑒𝑔,𝑒𝑔)= ∫ ∫|𝜙𝑒𝑔(𝐫1)| 2 1 𝑟12|𝜙𝑒𝑔(𝐫2)| 2 𝑑𝐫1𝑑𝐫2, (2.29) where 𝜙𝑡2𝑔 and 𝜙𝑒𝑔 are the wave-function of the t2g and eg states, respectively.
For the analysis of the expansion of 3d orbitals due to covalency, the orbital deformation parameters ( = MO⁄ AO) were calculated as the following [46, 47].
{ 𝑡2𝑔 = MO(𝑡2𝑔,𝑡2𝑔)/ AO(𝑡2𝑔,𝑡2𝑔)
𝑒𝑔 = MO(𝑒𝑔,𝑒𝑔)/ AO(𝑒𝑔,𝑒𝑔)
. (2.30) Moreover, since the atomic orbitals are unique for each ion, the effective Coulomb integral should be obtained by multiplying the c factor and the orbital deformation parameter on the Coulomb integral for the AO ( eff = 𝑐 AO). eff for t2g and eg orbitals
are written as follows
{ eff(𝑡2𝑔,𝑡2𝑔)= 𝑐 AO(𝑡2𝑔,𝑡2𝑔)
eff(𝑒𝑔,𝑒𝑔)= 𝑐 AO(𝑒𝑔,𝑒𝑔)
22
References
[1] K. Ogasawara, T. Ishii, Y. Ito, H. Ida, I. Tanaka, and H. Adachi: Jpn. J. Appl. Phys.,
37 (1998) 4590.
[2] K. Ogasawara, T. Ishii, I. Tanaka, and H. Adachi: Mater. Trans. JIM 40 (1999) 396.
[3] K. Ogasawara, T. Ishii, I. Tanaka, and H. Adachi: Phys. Rev. B 61 (2000) 143. [4] P. Hohenberg and W. Kohn: Phys. Rev., 136B (1964) 864.
[5] W. Kohn and L. J. Sham: Phys. Rev., 140A (1965) 1133.
[6] Y. Ito, I. Tanaka, T. Ishii, K. Ogasawara, and H. Adachi: Adv. Quantum Chem., 37 (2001) 97.
[7] K. Ogasawara, M. Yamamoto, T. Ishii, H. Ida, and H. Adachi: Adv. Quantum Chem., 37 (2001) 69.
[8] T. Ishii, K. Ogasawara, Y. Ito, I. Tanaka, and H. Adachi: Adv. Quantum Chem., 37 (2001) 85.
[9] T. Ishii, K. Ogasawara, H. Adachi, and I. Tanaka: Appl. Phys. Lett., 78 (2001) 2154.
[10] T. Ishii, K. Ogasawara, H. Adachi, and I. Tanaka: J. Chem. Phys., 115 (2001) 492. [11] T. Ishii, K. Fujimura, K. Ogasawara, H. Adachi, and I. Tanaka: J. Phys. Condens.
Matter 13 (2001) 5757.
[12] M. G. Brik and K. Ogasawara: Phys. Stat. Sol., (b) 243 (2006) 2864. [13] M. G. Brik: J. Phys. Chem. Solids 67 (2006) 856.
[14] M. G. Brik: Physica B 387 (2007) 69. [15] M. G. Brik: J. Lumin., 124 (2007) 23.
[16] S. Watanabe, T. Sasaki, R. Tanigushi, T. Ishii, and K. Ogasawara: Phys. Rev. B 79 (2009) 075109.
[17] M. Novita and K. Ogasawara: J. Phys. Soc. Jpn., 81 (2012) 104709. [18] M. Novita and K. Ogasawara: Jpn. J. Appl. Phys., 51 (2012) 022604.
[19] K. Ogasawara, S. Watanabe, Y. Sakai, H. Toyoshima, T. Ishii, M. G. Brik, and I. Tanaka: Jpn. J. Appl. Phys., 43 (2004) L611.
[20] K. Ogasawara, S. Watanabe, T. Ishii, and M. G. Brik: Jpn. J. Appl. Phys., 44 (2005) 7488.
23
[21] K. Ogasawara, S. Watanabe, H. Toyoshima, T. Ishii, M. G. Brik, H. Ikeno, and I. Tanaka: J. Solid State Chem., 178 (2005) 412.
[22] K. Ogasawara, S. Watanabe, H. Toyoshima, and M. G. Brik, in: Handbook on the
Physics and Chemistry of the Rare Earths, Vol. 37, edited by K. A. Gschneidner
Jr., J. -C. G. Bünzli, and V. K. Pecharsky (North-Holland Co., Amsterdam, 2007) pp. 1–59.
[23] H. Yoshida, R. Yoshimatsu, and K. Ogasawara: J. Lumin., 122-123 (2007) 488. [24] S. Watanabe and K. Ogasawara: J. Phys. Soc. Jpn., 77 (2008) 084702.
[25] D. E. Ellis and G. S. Painter: Phys. Rev., B2 (1970) 2887.
[26] H. Adachi, M. Tsukada, and C. Satoko: J. Phys. Soc. Jpn., 45 (1978) 875. [27] C. Satoko, M. Tsukada, and H. Adachi: J. Phys. Soc. Jpn., 45 (1978) 1333.
[28] H. Adachi, S. Shiokawa, and M. Tsukada, C. Satoko, and S. Sugano: J. Phys. Soc. Jpn., 47 (1978) 1528.
[29] H. Adachi and K. Taniguchi: J. Phys. Soc. Jpn., 49 (1980) 1944.
[30] H. Adachi: Introduction to Quantum Materials Chemistry (in Japanese) (Sankyo Press, Tokyo, Japan, 1991).
[31] R. S. Mulliken: J. Chem. Phys., 23 (1955) 1833. [32] R. S. Mulliken: J. Chem. Phys., 23 (1955) 1841. [33] R. S. Mulliken: J. Chem. Phys., 23 (1955) 2338. [34] R. S. Mulliken: J. Chem. Phys., 23 (1955) 2343. [35] J. C. Slater: Phys. Rev., 81 (1951) 385.
[36] J. C. Slater: Quantum Theory of Molecules and Solids, Vol. 4 of Quantum Theory of Molecules and Solids (McGraw-Hill, New York, United States, 1974).
[37] R. D. Shannon and C. T. Prewitt: Acta Cryst., B25 (1969) 925. [38] R. D. Shannon: Acta Cryst., A23 (1976) 751.
[39] M. C. Payne, M. P. Teter, D. C. Allan, T. A. Arias, and J. D. Joannopoulos: Rev. Mod. Phys., 64 (1992) 1045.
[40] M. D Segall, P. J. D. Lindan, M. I. J. Probert, C. J. Pickard, P. J. Hasnip, S. J. Clark, and M. C. Payne: J. Phys. Condens. Matter 14 (2002) 2717.
[41] S. J. Clark, M. D Segall, C. J. Pickard, P. J. Hasnip, M. I. J. Probert, K. Refson, and M. C. Payne: Z. Kristallogr., 220 (2005) 567.
24
[42] R. Car and M. Parrinello: Phys. Rev. Lett., 55 (1985) 22. [43] D. Vanderbilt: Phys. Rev. B 41 (1990) 7892.
[44] J. P. Perdew, K. Burke, and M. Ernzerhof: Phys. Rev. Lett., 77 (1996) 3865. [45] R. D. Cowan: The Theory of Atomic Structure and Spectra (University of
California Press, Berkeley, USA, 1981) p. 461.
[46] A. Fazzio, M. Caldas, and A. Zunger: Phys. Rev. B 29 (1984) 5999. [47] A. Fazzio, M. Caldas, and A. Zunger: Phys. Rev. B 30 (1984) 3430.
25
CHAPTER 3
Red Phosphor Materials:
Investigation of Optical Properties of Mn
4+-Doped Fluorides
Mn4+-doped hexafluorometallate family has attracted a great deal of attention owing to the excellent spectral characters, high luminescence efficiency, and simple processing. Adachi’s group has synthesized a series of red phosphor materials A2BF6:
Mn4+ (A=K or Na; B= Si, Ge, Sn) and showed efficient red emission under blue (~460nm) or UV excitation (~360 nm) [6-10]. Moreover, Setlur et al. [11, 12] have showed that light emitting diode (LED) lamps using Mn4+ doped in K2SiF6 or K2TiF6 as
a red phosphor initiated light source with warm-white correlated color temperatures (CCTs ~3000 K) and high color rendering indexes (CRIs ~90).
Since Mn4+ activated in fluoride crystals are the most promising materials as red phosphor, we have also studied the Mn4+ in fluorides such as K2SiF6, K2TiF6, and
K2GeF6 [13]. The results show that the multiplet energies are mainly determined by the
Mn–F bond length. A more detailed investigation however is desired. This chapter investigated the multiplet energies of Mn4+ doped in more variety of A2BF6–type host
crystals which have (1) cubic structures such as Cs2MnF6, Cs2GeF6, Rb2GeF6, Rb2SiF6,
Cs2SiF6, K2SiF6, and Rb2MnF6 and (2) rhombohedral structure such as Na2GeF6, Na2SiF,
Na2TiF, Rb2GeF6, K2GeF6, K2TiF6, and Li2MnF6.
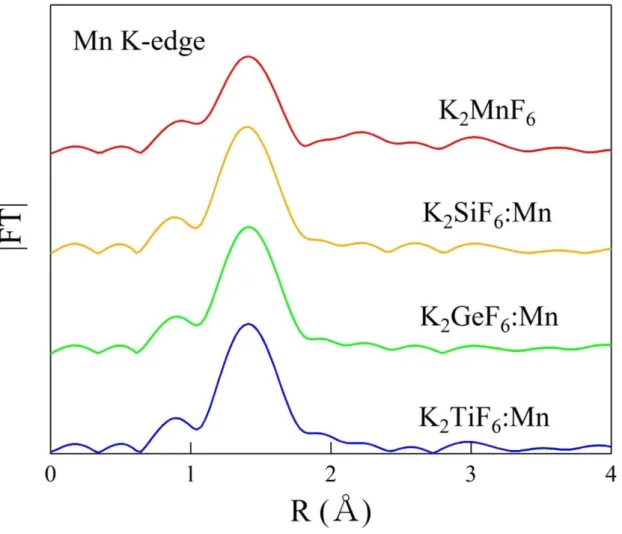
3.1. Experimental Mn K-edge EXAFS Spectra
In order to estimate the lattice relaxation rate of Mn-F bond length, the Mn K-edge Extended X-ray Absorption Fine Structure (EXAFS) measurements of K2SiF6: Mn4+,
26
Japan. For the synthesis of red phosphor material, two solutions were prepared; one was the solution of HF dissolving KHF2 and another was the solution of H2SiF6 or H2GeF6
or H2TiF6 and HF dissolving K2MnF6. The K2MnF6 was made based on the method
described in Ref. 14. Those solutions were thus mixed and K2SiF6: Mn4+ or K2GeF6:
Mn4+ or K2TiF6: Mn4+ powder was obtained as precipitate. The phosphors were filtered
and washed with ethanol and finally dried in the air. The density of light emitting ion (Mn4+) in the all three phosphors is 5 mol%.
Next, the Mn K-edge EXAFS spectrum was obtained with Si (1 1 1) double crystal spectrometer. For the reference sample, pure K2MnF6 was measured in transmission
method at 10 K. Afterwards K2SiF6: Mn4+, K2GeF6: Mn4+, and K2TiF6: Mn4+ phosphors
were measured in fluorescence method using 19 elements Ge solid state detector at 10 K temperature. The EXAFS oscillation was extracted from the spectra and then the Fourier transformation was performed to obtain the radial structure function.
The Mn K-edge radial structure function of pure K2MnF6, K2SiF6: Mn4+, K2GeF6:
Mn4+, and K2TiF6: Mn4+ are shown in Fig. 3.1. However, the peak shown in the K-edge
spectra usually appears smaller by 0.2–0.5 Å due to the phase shift. In order to estimate the Mn-F bond lengths of those compounds, ATHENA and ARTEMIS EXAFS analysis package were used. The Mn-F bond lengths were found to be 1.809, 1.807, 1.810, and 1.801 Å for K2MnF6, K2SiF6: Mn4+, K2GeF6: Mn4+, and K2TiF6: Mn4+, respectively.
Since the B-F bond lengths of the pure K2SiF6, K2GeF6, and K2TiF6 crystals are
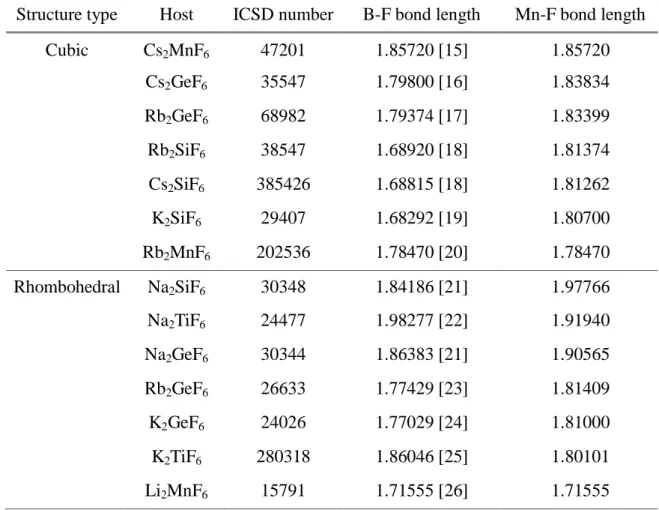
1.683, 1.770, and 1.860 Å, the relaxation rates were estimated to be 102.24, 107.37, and 96.80%, respectively. Moreover, for any crystal having Si, Ge, or Ti at the B cation site, the relaxation rate was fixed to be the above estimated values; 102.24, 107.37 or 96.80%, respectively. Table 3.1 shows the experimental B-F bond lengths of the pure host A2BF6 crystals and the theoretical Mn-F bond lengths of Mn4+ doped in A2BF6
27
28
Table 3.1. The experimental B-F bond lengths of the pure host A2BF6 crystals and the
estimated Mn-F bond lengths of A2BF6: Mn4+.
Structure type Host crystal
ICSD number B-F bond length (Å) Mn-F bond length (Å) Cubic Cs2MnF6 47201 1.85720 [15] 1.85720 Cs2GeF6 35547 1.79800 [16] 1.83834 Rb2GeF6 68982 1.79374 [17] 1.83399 Rb2SiF6 38547 1.68920 [18] 1.81374 Cs2SiF6 385426 1.68815 [18] 1.81262 K2SiF6 29407 1.68292 [19] 1.80700 Rb2MnF6 202536 1.78470 [20] 1.78470 Rhombohedral Na2SiF6 30348 1.84186 [21] 1.97766 Na2TiF6 24477 1.98277 [22] 1.91940 Na2GeF6 30344 1.86383 [21] 1.90565 Rb2GeF6 26633 1.77429 [23] 1.81409 K2GeF6 24026 1.77029 [24] 1.81000 K2TiF6 280318 1.86046 [25] 1.80101 Li2MnF6 15791 1.71555 [26] 1.71555 3.2. Model Description
Seven-atom model clusters were constructed based on host A2BF6 crystals which
has (1) cubic structure such as Cs2MnF6 [15], Cs2GeF6 [16], Rb2GeF6 [17], Rb2SiF6 [18],
Cs2SiF6 [18], K2SiF6 [19], and Rb2MnF6 [20] and (2) rhombohedral structure such as
Na2GeF6 [21], Na2SiF6 [21], Na2TiF6 [22], Rb2GeF6 [23], K2GeF6 [24], K2TiF6 [25], and
Li2MnF6 [26]. Those model clusters constructed from the cubic A2BF6 crystals have Oh
29
crystals. Mn4+ ion was located at the center of the cluster and several thousand point charges were located at the external atomic sites so as to produce the effective Madelung potential.
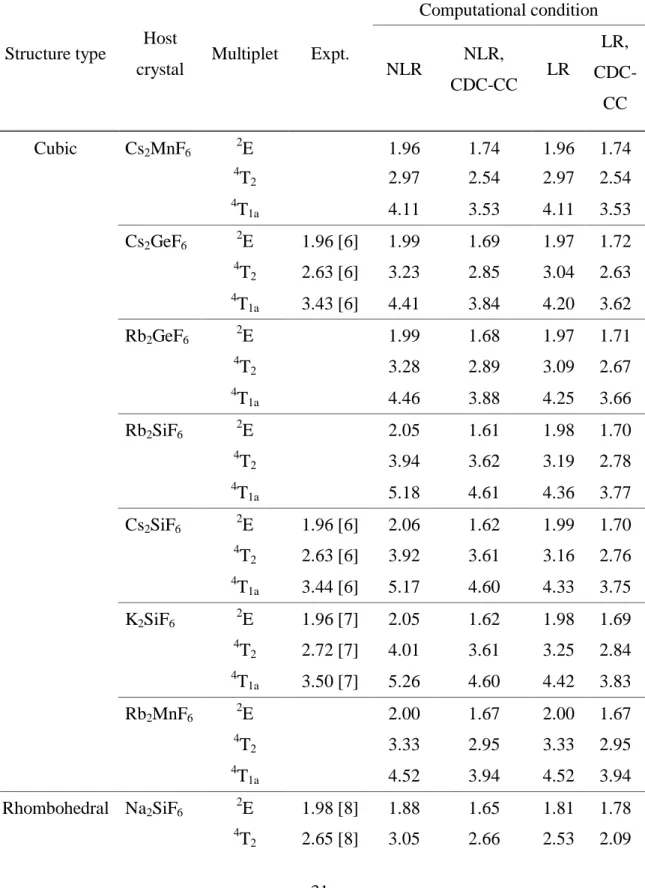
3.3. Theoretical Multiplet Energies
The calculated multiplet energy levels of Mn4+ doped in some A2BF6 crystals are
listed in Table 3.2 as well as the experimental data taken from Refs. 6-10. Since the splittings due to the trigonal field are quite small, only the average energies of each state are shown. Those energies are shown in Fig. 3.2 and Fig. 3.3 for Mn4+ doped in cubic- and rhombohedral-A2BF6 crystals, respectively. The theoretical energies by calculation
without considering CDC-CC correction, with considering CDC-CC correction, and the experimental data are indicated by (♦), (■), and (●), respectively. (a) and (b) compare the transition energy of R-line; (c) and (d) compare the transition energy of U-band; while (e) and (f) compare the transition energy of Y-band. The calculated energies based on the unrelaxed clusters are presented on the left side (a, c, and e), while those based on the relaxed clusters are presented on the right side (b, d, and f). Further, the full profile multiplet energy levels of A2BF6: Mn4+ including the effect of CDC-CC
correction are shown in Fig. 3.4.
3.3.1. R-line energy
Figure 3.2 shows that the calculated R-line energies of Mn4+ doped in cubic-A2BF6 crystals without any correction are in good agreement with the
experimental data, while the R-line energies are underestimated when CDC and CC corrections were considered. However, since the variation of the experimental data is very small, it was literally difficult to choose the best condition of R-line energy. Here I would like to compare with the results of the multiplet energy levels of ruby under pressure (section 4.2.3) [27]. It has been demonstrated that when the pressure increased, the R-line energy decreased. Considering that the effect of applied pressure can be
30
ascribed to the decreasing bond length [28-30], the theoretical results in the present work are therefore consistent. Accordingly, the calculated R-line energies with considering CDC-CC correction suggest being reasonable, although they are underestimated. In the case of Mn4+ doped in rhombohedral-A2BF6 crystals, the
experimental R-line energy clearly decrease as the Mn-F bond length decreases. Similarly, only calculations with considering CDC-CC correction agree with the experiment.
3.3.2. U-band and Y-band energies
In both cases of Mn4+ doped in cubic- and rhombohedral-A2BF6 crystals, U- and
Y-band energies calculated using all computational conditions increase as the Mn-F bond length decreases (Fig. 3.2 and 4.3). Without any correction, both U- and Y-band energies are overestimated. The calculated U- and Y-band energies were further improved after the consideration of lattice relaxation effect or CDC-CC correction. Moreover, when both effects are considered, the calculated U- and Y-band energies of bond length dependence agree with the experimental data quantitatively. Since both of U- and Y-bands correspond to the (t2g)2(eg)1 configuration, their energy depend on the
energy difference between (t2g)3 and (t2g)2(eg)1 configurations which can be ascribed to
the crystal field splitting, 10Dq. Accordingly, the increasing tendencies of those energies are mainly determined by the crystal field splitting originating from the Mn-F bond length. Figure 3.6 describes the relationship between the U- and Y-band energies and the crystal field splitting (10Dq) of cubic- and rhombohedral-A2BF6: Mn4+. By using both
unrelaxed and relaxed clusters and with considering CDC-CC correction, the calculated U- and Y-band energies increase as the crystal field splitting increases.
31
Table 3.2. The calculated multiplet energy levels of A2BF6: Mn4+. The considered
corrections are indicated as without lattice relaxation (NLR), with lattice relaxation (LR), configuration dependent correction (CDC), and correlation correction (CC).
Structure type Host
crystal Multiplet Expt.
Computational condition NLR NLR, CDC-CC LR LR, CDC-CC Cubic Cs2MnF6 2E 1.96 1.74 1.96 1.74 4 T2 2.97 2.54 2.97 2.54 4 T1a 4.11 3.53 4.11 3.53 Cs2GeF6 2E 1.96 [6] 1.99 1.69 1.97 1.72 4 T2 2.63 [6] 3.23 2.85 3.04 2.63 4 T1a 3.43 [6] 4.41 3.84 4.20 3.62 Rb2GeF6 2E 1.99 1.68 1.97 1.71 4 T2 3.28 2.89 3.09 2.67 4 T1a 4.46 3.88 4.25 3.66 Rb2SiF6 2E 2.05 1.61 1.98 1.70 4 T2 3.94 3.62 3.19 2.78 4 T1a 5.18 4.61 4.36 3.77 Cs2SiF6 2E 1.96 [6] 2.06 1.62 1.99 1.70 4 T2 2.63 [6] 3.92 3.61 3.16 2.76 4 T1a 3.44 [6] 5.17 4.60 4.33 3.75 K2SiF6 2E 1.96 [7] 2.05 1.62 1.98 1.69 4 T2 2.72 [7] 4.01 3.61 3.25 2.84 4 T1a 3.50 [7] 5.26 4.60 4.42 3.83 Rb2MnF6 2E 2.00 1.67 2.00 1.67 4 T2 3.33 2.95 3.33 2.95 4 T1a 4.52 3.94 4.52 3.94 Rhombohedral Na2SiF6 2E 1.98 [8] 1.88 1.65 1.81 1.78 4 T2 2.65 [8] 3.05 2.66 2.53 2.09
32 4 T1a 3.33 [8] 4.15 3.63 3.57 3.04 Na2TiF6 2E 1.98 [9] 1.88 1.87 1.91 1.79 4 T2 2.66 [9] 2.52 2.02 2.71 2.25 4 T1a 3.41 [9] 3.59 2.99 3.81 3.23 Na2GeF6 2E 1.98 [8] 1.88 1.68 1.85 1.71 4 T2 2.95 2.55 2.78 2.36 4 T1a 4.04 3.52 3.85 3.33 Rb2GeF6 2E 2.00 1.67 1.98 1.70 4 T2 3.28 2.93 3.07 2.69 4 T1a 4.47 3.93 4.24 3.69 K2GeF6 2E 1.96 [10] 2.00 1.66 1.97 1.69 4 T2 2.68 [10] 3.31 2.96 3.10 2.72 4 T1a 3.42 [10] 4.51 3.95 4.26 3.71 K2TiF6 2E 1.96 [9] 1.95 1.74 1.98 1.69 4 T2 2.67 [9] 2.87 2.47 3.15 2.78 4 T1a 3.41 [9] 4.01 3.46 4.33 3.78 Li2MnF6 2E 2.01 1.61 2.01 1.61 4 T2 3.77 3.40 3.77 3.40 4 T1a 5.00 4.40 5.00 4.40
33
Fig. 3.2. Theoretical and experimental multiplet energy levels of Mn4+ doped in Oh site
of cubic-A2BF6 crystals. The calculations without and with considering
CDC-CC correction are indicated by (♦) and (■), respectively, while (●) represents the experimental data taken from Refs. 6 and 7.
34
Fig. 3.3. Theoretical and experimental multiplet energy levels of Mn4+ doped in D3d site
of rhombohedral-A2BF6 crystals. The calculations without and with
considering CDC-CC correction are indicated by (♦) and (■), respectively, while (●) represents the experimental data taken from Refs. 8-10.
35
Fig. 3.4. Relationship between the calculated 2E → 4A2 or R-line (♦), 4A2 → 4T2 or U-band (●), and 4A2 → 4T1a or Y-band (■) energies
and Mn-F bond length for Mn4+ doped in some cubic- and rhombohedral-A2BF6 crystals calculated using (a) unrelaxed and
(b) relaxed clusters with considering CDC-CC correction. The experimental data obtained from Refs. 6-10 are shown by the smaller symbol.
36
Fig. 3.5. Relationship between the calculated U-band (●) and Y-band (■) energies and the crystal field splitting (10Dq) of Mn4+ doped in A2BF6 crystals having (a) Oh and (b) D3d symmetry. They were calculated using unrelaxed and relaxed (darker symbol)
37
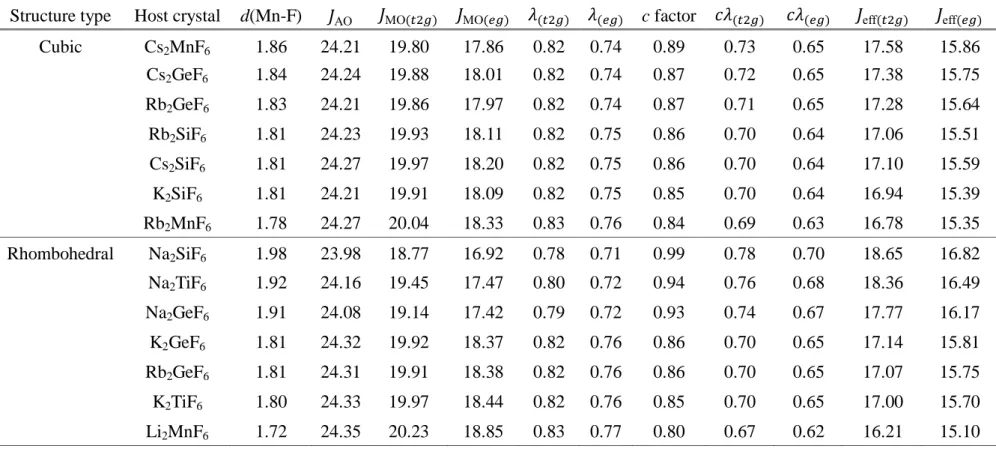
3.4. Effects of Covalency and Electron Correlation
The orbital deformation parameter ( = MO⁄ AO) [31, 32] shown in Table 3.3 and
3.4 describes the effect of covalency while the correlation correction factor (𝑐) describes the effect of electron correlation. They were calculated using unrelaxed and relaxed MnF62- model clusters having Oh symmetry and D3d symmetry, respectively. The
effective Coulomb integrals including the effect of correlation correction eff were
calculated by 𝑐 AO. The results show that for both cases, when the Mn-F bond length
decreased, the orbital deformation parameter increased whereas the c factor decreased and thus result in the decreasing of effective Coulomb integral. This fact indicates that there is a competition between the effect of covalency and the effect of electron correlation. In this case, the effect of correlation correction is stronger and determines the tendency of the effective Coulomb integral significantly.
Fig. 3.6a and Fig. 3.6b show the relationship between the R-line energy and the effective Coulomb integral ( eff) of Mn4+ doped in A2BF6 crystals having Oh symmetry
and D3d symmetry, respectively. They were calculated using both unrelaxed and relaxed
clusters including the effect of CDC-CC correction. The increasing tendency of the effective Coulomb integral is consistent with the increasing tendency of the R-line energy. Hence, the R-line energy is mainly determined by the effective electron-electron repulsion.
38
Table 3.3. The calculated Coulomb integral (eV) for the pure TM-3d atomic orbitals ( AO) and the molecular orbitals ( MO) obtained by using the unrelaxed MnF62- model clusters having Oh symmetry. The effective Coulomb integrals ( eff) were also calculated by
multiplying the orbital deformation parameter ( ) and the correlation correction factor (𝑐) on AO. Structure type Host crystal d(Mn-F)
(Å)
AO MO(𝑡2𝑔) MO(𝑒𝑔) (𝑡2𝑔) (𝑒𝑔) c factor 𝑐 (𝑡2𝑔) 𝑐 (𝑒𝑔) eff(𝑡2𝑔) eff(𝑒𝑔)
Cubic Cs2MnF6 1.86 24.21 19.80 17.86 0.82 0.74 0.89 0.73 0.65 17.58 15.86 Cs2GeF6 1.80 24.29 20.03 18.31 0.82 0.75 0.85 0.70 0.64 16.96 15.51 Rb2GeF6 1.79 24.26 20.01 18.27 0.82 0.75 0.84 0.70 0.63 16.87 15.41 Rb2MnF6 1.78 24.27 20.04 18.33 0.83 0.76 0.84 0.69 0.63 16.78 15.35 Rb2SiF6 1.69 24.38 20.41 19.08 0.84 0.78 0.78 0.65 0.61 15.95 14.91 Cs2SiF6 1.69 24.41 20.45 19.15 0.84 0.78 0.78 0.65 0.61 15.98 14.97 K2SiF6 1.68 24.36 20.40 19.08 0.84 0.78 0.78 0.65 0.61 15.86 14.83 Rhombohedral Na2TiF6 1.98 24.08 19.19 17.04 0.80 0.71 1.00 0.80 0.71 19.26 17.10 Na2GeF6 1.86 24.13 19.33 17.71 0.80 0.73 0.90 0.72 0.66 17.31 15.85 K2TiF6 1.86 24.26 19.74 18.03 0.81 0.74 0.89 0.73 0.66 17.63 16.10 Na2SiF6 1.84 24.14 19.39 17.84 0.80 0.74 0.88 0.71 0.65 17.04 15.68 Rb2GeF6 1.77 24.36 20.08 18.65 0.82 0.77 0.83 0.69 0.64 16.75 15.57 K2GeF6 1.77 24.35 20.07 18.66 0.82 0.77 0.83 0.69 0.64 16.69 15.51 Li2MnF6 1.72 24.35 20.23 18.85 0.83 0.77 0.80 0.67 0.62 16.21 15.10
39
Table 3.4. The calculated Coulomb integral (eV) for the pure TM-3d atomic orbitals ( AO) and the molecular orbitals ( MO) obtained by using the relaxed MnF62- model clusters having Oh symmetry. The effective Coulomb integrals ( eff) were also calculated by
multiplying the orbital deformation parameter ( ) and the correlation correction factor (𝑐) on AO. Structure type Host crystal d(Mn-F)
(Å)
AO MO(𝑡2𝑔) MO(𝑒𝑔) (𝑡2𝑔) (𝑒𝑔) c factor 𝑐 (𝑡2𝑔) 𝑐 (𝑒𝑔) eff(𝑡2𝑔) eff(𝑒𝑔)
Cubic Cs2MnF6 1.86 24.21 19.80 17.86 0.82 0.74 0.89 0.73 0.65 17.58 15.86 Cs2GeF6 1.84 24.24 19.88 18.01 0.82 0.74 0.87 0.72 0.65 17.38 15.75 Rb2GeF6 1.83 24.21 19.86 17.97 0.82 0.74 0.87 0.71 0.65 17.28 15.64 Rb2SiF6 1.81 24.23 19.93 18.11 0.82 0.75 0.86 0.70 0.64 17.06 15.51 Cs2SiF6 1.81 24.27 19.97 18.20 0.82 0.75 0.86 0.70 0.64 17.10 15.59 K2SiF6 1.81 24.21 19.91 18.09 0.82 0.75 0.85 0.70 0.64 16.94 15.39 Rb2MnF6 1.78 24.27 20.04 18.33 0.83 0.76 0.84 0.69 0.63 16.78 15.35 Rhombohedral Na2SiF6 1.98 23.98 18.77 16.92 0.78 0.71 0.99 0.78 0.70 18.65 16.82 Na2TiF6 1.92 24.16 19.45 17.47 0.80 0.72 0.94 0.76 0.68 18.36 16.49 Na2GeF6 1.91 24.08 19.14 17.42 0.79 0.72 0.93 0.74 0.67 17.77 16.17 K2GeF6 1.81 24.32 19.92 18.37 0.82 0.76 0.86 0.70 0.65 17.14 15.81 Rb2GeF6 1.81 24.31 19.91 18.38 0.82 0.76 0.86 0.70 0.65 17.07 15.75 K2TiF6 1.80 24.33 19.97 18.44 0.82 0.76 0.85 0.70 0.65 17.00 15.70 Li2MnF6 1.72 24.35 20.23 18.85 0.83 0.77 0.80 0.67 0.62 16.21 15.10
40
Fig. 3.6. Relationship between the calculated R-line energy and the effective Coulomb integral ( eff) of Mn4+ doped in A2BF6 crystals