特集
Attributing Factors for Students Overall Satisfaction and
Educational Aspiration: Evidence from APU
YOKOYAMA Kenji, Aye Mengistu
Abstract
The level of students understanding in class is evaluated through the results of the examinations and tests, the contents of the reports and students response to questions and discussion topics. In the meantime, students overall satisfaction can be assessed by students class evaluations. However, the utilization of class assessments is individual. Nobody has cleared up the implication of overall satisfaction and correlations between each evaluation element. This paper analyzed relationships between overall satisfaction and the other items through econometrics models. It has turned out, as the result, that the class stimulates interest has a close relationship with general satisfaction. We should clarify what stimulate students interest and are going to publish it before long.
Key Words
Attributing Factors, Students Class Evaluation, Graduate School of Management, Overall Satisfaction, Stimulation, Interest, Econometrics
Ⅰ.Introduction
Teaching and learning at the college level have become the focus of a great deal of attention and more and more researchers are conducting investigations on the quality of instruction in college classrooms. The growing diversity among the students attending college classes, paired with pressure for greater accountability for the outcomes of education, has compelled many college teachers to reconsider not only the importance of what they are teaching, but also the effectiveness of their teaching methods and procedures (Guskey, 1988).
Modern research studies investigating teaching and learning, as they take place under the unique conditions presented in college and university classrooms, have yielded a number of valuable insights (Ellner & Barnes, 1983). The findings mainly reflect two major themes. The first is that despite
the influence of factors that lie beyond the control of professors and instructors, such as students backgrounds and previous learning experiences, the quality of their teaching has a very strong effect on students learning. In other words, college teachers do make a difference. Instructional factors under their direct control have a very important and powerful influence on what students learn, and on the success they achieve in college level courses. The second major theme is that college students who have successful learning experiences persist in their learning and are far more likely to complete the courses and programs in which they enroll. Furthermore, they feel better about themselves, about their ability to learn, and are far more confident in future learning situations (Guskey, 1988:4). Therefore, there is a need to identify and develop the main attributing factors for students overall satisfaction in class that might enable the large majority of students to be satisfied in the learning process. Once identified, this information could be shared with all educators interested in improving teaching and learning.
Ⅱ.Review of Literature Related to Attributing Factors for Student s Satisfaction and
Educational Aspirations
In this section, we focus on theory and previous research on the attribution process that have a direct link to students overall satisfaction . According to Weiner (1992), attribution theory is a cognitive theory of motivation based on the idea that individuals are conscious and rational decision makers. Similarly, attribution theory assumes that individuals use various information sources to make inferences (attributions) about the causal determinants of behavior (Schunk et al., 2008). Meanwhile, it is important to remember that attributions are perceived as the causes of outcomes.
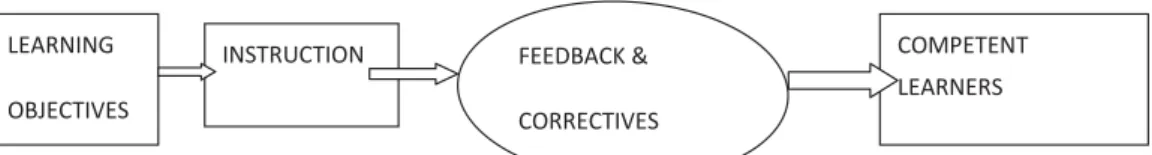
The process of teaching and learning is generally perceived as having three components. At the beginning there is some idea of what we are setting out to teach, or our learning objectives. At the end we hope to have competent learners-students who have learned well the things we taught, and whose competence we can assess through some sort of evaluation procedure. In between is our teaching or instruction. It is also fair to add an additional component of feedback and corrective procedures in order to enhance the efficiency and successes of both the teaching and learning. These elements are illustrated in the following figure.
LEARNING
OBJECTIVES
INSTRUCTION FEEDBACK &
CORRECTIVES
COMPETENT LEARNERS
Source: Guskey (1988)
In the past, there has been a great deal of research and writing on alternative instructional techniques for college classrooms. Researchers have explored the usefulness of group discussions, films, various learning exercises, programmed instruction, and computer assisted learning, to name but a few (Kulik & Jaska, 1977). Yet despite these efforts, the class lecture remains the dominant mode of instruction in nearly all college and university classrooms (Kulik & Jaska, 1977). Most college teachers see lecturing as a fairly effective and highly efficient way of communicating important information to students within the limited instructional time that is available (Cross, 1976). It is obvious that college students vary greatly in their academic background, socio-economic and psychological characteristics that would contribute for differences in students educational performances. But research evidence indicates that a significant portion of that variation can be altered, that teachers can affect student involvement in learning, and, that as a result, significant improvements in student learning can be achieved (Walberg, 1984).
Some may think that the same information that is obtained from professors and instructors in class may be obtained from a computer or from the course text book. However, what a teacher offers and computers or textbooks generally do not is interpretation, meaning, and relevance to that information. Particularly, in college level courses, students need more than just knowledge; they need knowledge that makes sense and inspires. They need knowledge that helps them understand why learning that subject is worthwhile, and many of the benefits it can bring. Such understanding and insight cannot be provided by a computer or textbook that is detached and indifferent (Guskey, 1988:90).
Furthermore, though non-classroom visits to professors are voluntary for college students, there is empirical evidence that shows informal interactions between professors and students outside class can significantly affect a student s overall satisfaction. According to Pascarella (1985), informal interactions between professors and students can have an important influence on college students academic and emotional growth, even though they comprise a very small portion of students learning time outside of class. At the same time, informal non classroom interactions with students provide professors with an opportunity to have a very positive influence on a wide variety of student outcomes.
Ⅲ.Objective of the Study
This study is intended to identify the main attributing factors for student s overall satisfaction and success in class at the College of International Management of Ritsumeikan Asia Pacific University (APU). The new knowledge that we are going to obtain from this study will enable us to identify aspects of the teaching and learning process that can be altered with relative ease and yet can be very powerful in helping students build successful learning experiences. These aspects cost very little to change in terms of a professor s time or effort, but can significantly increase the proportion of students who reach high learning standards, are motivated for further learning, and complete courses and programs in a reasonable time period. In other words, experienced professors and instructors can become much more effective in their teaching and can do so without dramatic revision in their teaching
techniques or instructional repertoire (Guskey, 1986:6).
It has been felt that the findings from this analysis will provide the APM management with the opportunity of examining the overall satisfaction level of students, and identify which factors more closely associated and attributed to students overall satisfaction in class.
Classrooms in the College of International Management (APM)a at Ritsumeikan Asia Pacific
University (APU) today contain a wider variety of students than ever before. This is, in part, because institutions of higher education like APU have given more and more attention to attract a more diverse population across the world. Accordingly, while slightly more than half of its 6,000-plus students are domestic Japanese students, the rest are international students from 97 countries around the world. This approximate 50-50 balance is a feature unique to APU amongst Japanese universities and APU is second only to Waseda University in terms of the number of international students 10
Ⅳ.Methodology
This analysis is based on the average evaluation points gathered through a structured questionnaire from spring 2007 to spring 2009 (five semesters) for 60 courses. It is logical to assume that students overall satisfaction in class depends on a number of factors that ranges from the syllabus to the ability of each instructor in making the teaching-learning process more suitable and productive for students. Accordingly, 21 potential attributing factors have been identified and forwarded to students for their course evaluation at the end of each semester in class. These factors were presented in the form of questions. In response to the questions q1 through q21, students were asked to choose the appropriate number from 1-7 representing the scale from strongly disagree to strongly agree. However, two of the 21 questions, namely You attended this class regularly? and You prepared enough for this lesson? were excluded from the analysis due to technical problems and inconsistency observed in the respective data. Thus, this analysis deals with the relationship between 19 attributing factors and the dependent variable, i.e., students overall satisfaction.
We assumed that differences in institutions, courses, teachers, and students academic background as well as class participation were all likely to affect student learning in college level courses to some degree. The level of the course and whether it was a required course or an elective were also deemed likely to account for some of the differences in student learning outcomes. And finally, we assumed that teacher-specific factors could explain some portion of the differences as well. In order to determine which of these factors was of the greatest importance, and how relative each is to the others, we designed a study to estimate the effects of each on the overall satisfaction of students in class. In a. An interesting feature of APU is its bilingual educational system; it offers dual language education in English and Japanese in its two undergraduate colleges. The graduate programs are conducted exclusively in English. The APM curriculum aims to develop internationally-minded business leaders ready to take action making use of their decision abilities and strategic thinking skills. Four subject clusters have been established which focus on marketing and Corporate Strategy, International Business and Comparative Management, Accounting and Finance, and New Business and Innovation.
total, we examined 6o courses.
An attempt has been made to present this analysis in three sections: (i) the descriptive statistics, (ii) the correlation analysis, and (iii) the regression analysis. These are briefly discussed below.
Ⅴ.Descriptive Statistics
The descriptive statistics in table 1 explain the mean, standard deviation, minimum, and maximum values of each variable. While mean values from 6 to 7 represent a strong agreement in favor of the specific question, values from 5 to 6 represent a humble (fair) agreement. By the same token, values between 4 and 5 represent neutral positions. Based on this fact, we are going investigate the descriptive statistics and its implications for each variable below.
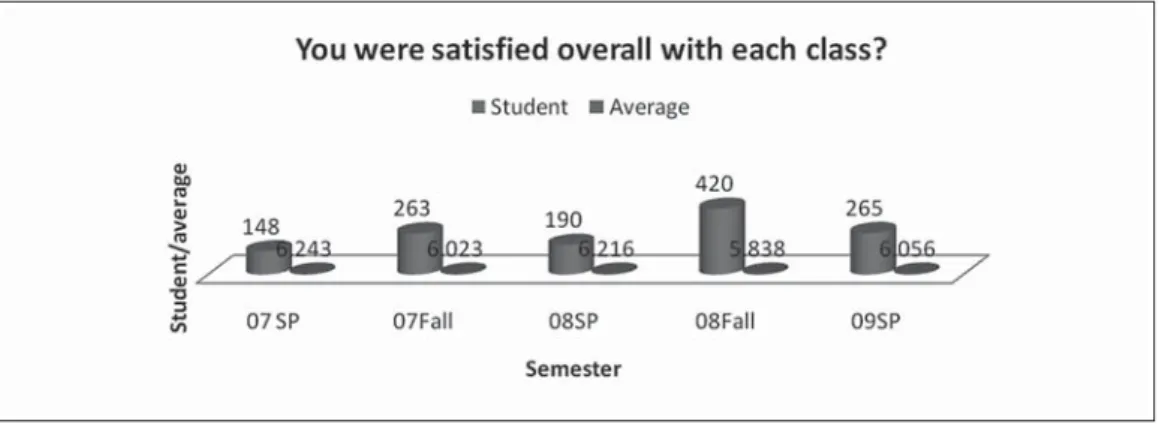
First, the mean value of the variable which refers to overall satisfaction is about 5.7. The detailed overall satisfaction response of students for each semester is also noted in figure 2 below. Accordingly, the average points in figure 2 vary from 5.838 (minimum) in fall semester 08 to 6.243 (maximum) in spring semester 07. This indicates that most of the students in all semesters bar fall semester 08 strongly agreed that they were satisfied overall with the various classes.
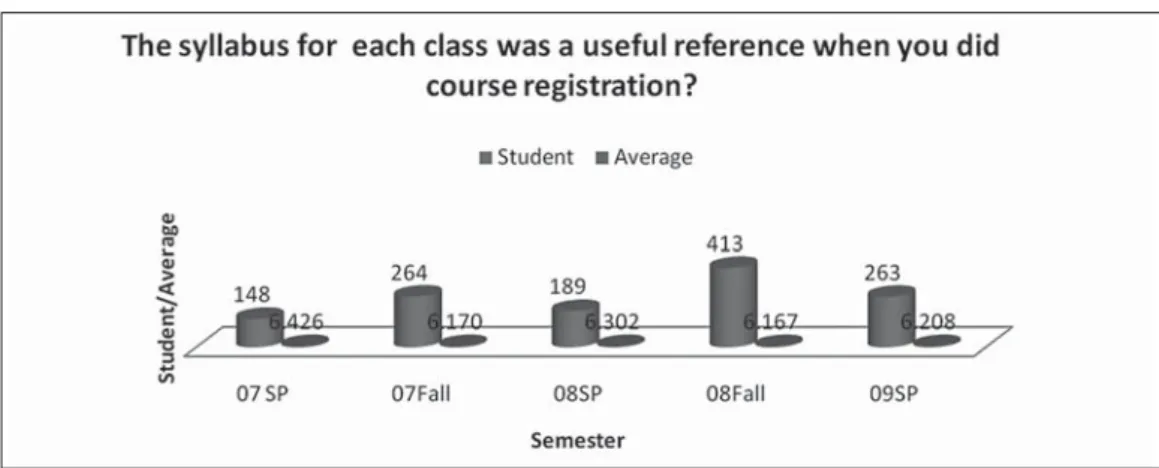
Secondly, the mean value of the variable represented by the statement, syllabus was a useful reference, was estimated at 5.9, implying students approval in favor of it. More descriptive statistics related to syllabus and overall satisfaction on a semester basis are shown in figure 3 below.
Figure 3 explains the average points range from 6.167(minimum) in fall semester 08 to 6.426 (maximum) in spring semester 07 in which most of the students strongly agreed that the syllabus was a useful reference when they did course registration.
Third, the mean value of student s perception regarding topics and issues were clearly indicated by the instructor has been estimated as 5.949284, implying students positive and strong approval in
Figure 3: The syllabus for each class was a useful reference during course registration?
Table 1: Descriptive Statistics
Variable Obs Mean Std. Dev. Minimum Maximum
You were satisfied overall with this class? 60 5.66801 .657439 3.446154 6.888889 Syllabus was a useful reference? 60 5.947955 .465888 4.484848 6.777778 Topics and issues were clearly indicated by the instructor? 60 5.949284 .5643471 3.833333 7 The content of the class was difficult? 60 5.306846 .5150062 4.1875 6.565217 The textbook and/or teaching materials were suitable? 60 5.750198 .5595361 3.560606 6.76 The instructor provided the necessary information for your study? 60 5.831514 .5918379 3.606061 6.777778 The instructor spoke in a clear manner? 60 5.731244 .7791709 3.941176 6.777778 This class allowed students to think creatively? 60 5.734745 .6666767 4.472973 7 You concentrated fully on the lesson? 60 5.773936 .5407486 4.604839 7 The instructor gave guidance for assignments? 60 5.803677 .6091505 3.909091 6.75 The classroom environment was suitable for students? 60 5.811746 .5597583 4.061539 6.777778 The instructor was accessible for assistance outside of class? 60 5.617842 .5599622 4.611111 7 The class proceeded according to the syllabus? 60 5.830138 .5185116 3.984848 6.75 The instructor conducted class as per the level of
understanding of students? 60 5.60524 .6568559 4.015625 7
You were able to understand new ideas? 60 5.650715 .609826 4.19697 6.777778 You were able to grasp the basic ideas of the course? 60 5.669088 .6149091 3.984848 6.75 The instructor treated the students with respect? 60 6.005344 .5144286 4.338461 7 The class stimulated your interest? 60 5.686632 .6417836 3.723077 7
favor of it. This was again confirmed by the detailed descriptive statistics on a semester basis as shown in figure 4.
The above graph shows that the minimum average point recorded was about 6.052 in fall semester 08 while the maximum average point was about 6.399 in spring semester 07. In all cases, therefore, most of the students strongly agreed that the topics and issues of each lesson were clearly indicated by the instructor.
Fourth, the descriptive statistics from table 1 confirm that the mean value of the variable to measure the opinion of whether the students thought the content of the class was difficult was estimated at about 5.3, which may indicate students mild agreement in favor of it. This is elaborated by the detailed descriptive statistics on a semester basis in figure 5.
The evidence from figure 5 shows that the minimum average point given was 4.932 in spring semester 08, and the maximum average point was about 5.405 in spring semester 07. This implies that students especially in spring semester 08 and spring semester 09 took a neutral position to answer whether
Figure 4: Topics and issues of each lesson were clearly indicated by the instructor?
the content of the class was difficult.
Fifth, the estimated mean value for the variable on whether the text book and/or teaching materials were suitable was found to be about 5.8, implying students humble agreement in favor of it. The detailed descriptive statistics obtained across the five semesters also offer similar evidences as shown in figure 6.
The above graph shows that the minimum average point given was 6.008 in fall semester 07 while the maximum average point was about 6.374 in spring semester 07. This implies the majority of students strongly agreed that the text book and/ or teaching materials were suitable.
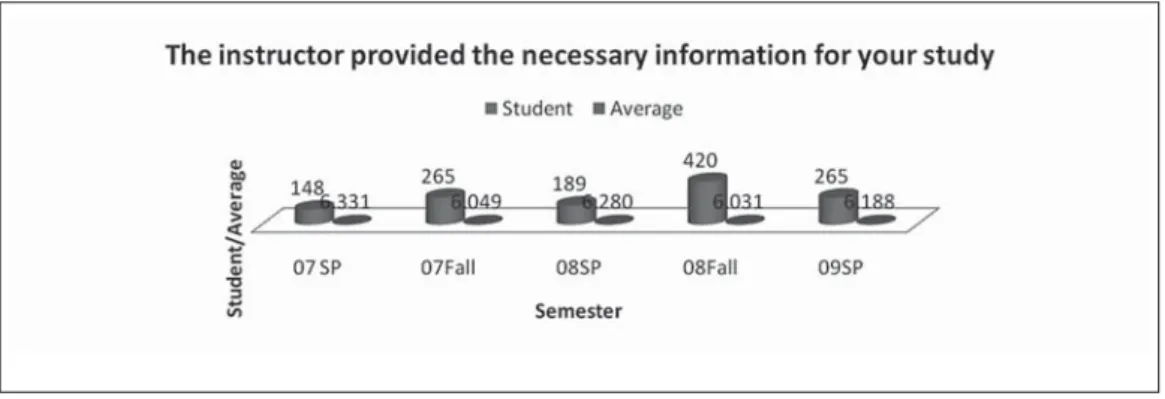
Six, the mean value of the variable on the instructor provided the necessary information in class was found to be about 5.8, indicative of students fair agreement. This can further be confirmed graphically as shown in figure 7 below.
Thus, the average points throughout the five semesters range from 6.031 (minimum) in fall semester 08 to 6.331 (maximum) in spring semester 07. This demonstrates most of the students strongly agreed that the instructor indeed provided the necessary information for their study.
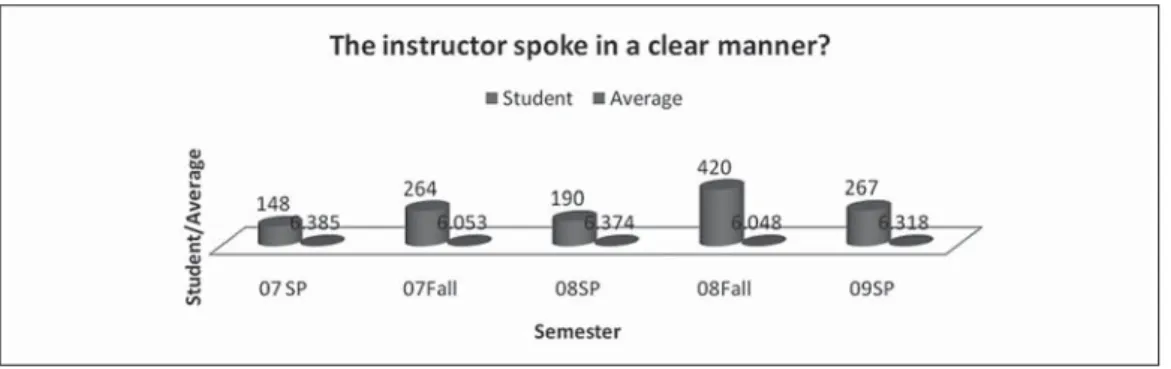
Seven, the descriptive statistics from table 1 shows that the mean value of about 5.7 for the variable that the instructor spoke in a clear manner. This implies that most of the students agree with
Figure 6: The text book and/or teaching materials were suitable?
the opinion that the instructor spoke in a clear manner. The detailed graphical analysis can be shown in figure 8 below.
The average values above range from 6.053 (minimum) in fall semester 07 to 6.385 (maximum) in spring semester 07. This confirms most of the students strongly agreed that the instructor spoke in a clear manner.
Eight, the mean value obtained from the descriptive statistics of table 1 regarding this class allowed students to think creatively was about 5.7, confirming student s positive and fair agreement in favor of the question. The detailed information from figure 9 also provides similar evidence.
The minimum average point recorded in figure 9 was about 5.979 in fall semester 08 while the maximum average value was 6.324 in spring semester 07. Except for fall semester 08, the average point for the remaining four semesters confirms that most of students strongly agreed that the class allowed students to think creatively.
Ninth, in the same descriptive statistics in table 1, the mean value of the variable on the students fully concentrated on the lesson was estimated to be 5.8, a sign of student s positive approval on it. The detailed graphical analysis across the five semesters is shown in figure 10.
Figure 8: The instructor spoke in a clear manner?
The average points range from 6.083 (minimum) in fall semester 08 to 6.453 (maximum) in spring semester 08. This confirms most of the students strongly agreed that they concentrated fully on the lesson.
Tenth, the mean value of the variable on the instructor gave guidance for assignments in table 1 was about 5.8, which again indicates students agreement. A close look at figure 11 also confirms the validity of the descriptive statistics.
The average points in figure 11 range from 6.072 (minimum) in fall semester 08 to 6.418 (maximum) in spring semester 08. This confirms most of the students strongly agreed that the instructor gave guidance for assignments.
Eleventh, the variable on whether the instructor took steps to ensure that the classroom environment was suitable for studying has a mean value of 5.8, implying students agreement as a sign of approval. The detailed graphical analysis based on the five semester data is shown in figure 12.
Figure 10: You fully concentrated on the lesson?
The average points in figure 12 range from 6.057 (minimum) in fall semester 08 to 6.412 (maximum) in spring semester 07. This confirms most of the students strongly agreed that the instructor took steps to ensure that the classroom environment was suitable for studying.
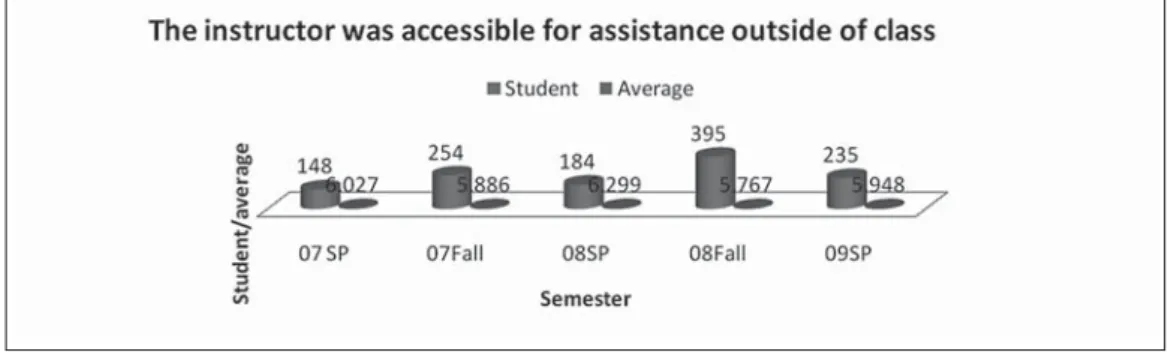
Twelfth, the descriptive statistics in table 1 reveal that the mean value of the variable on whether the instructor was accessible for assistance outside of class was estimated at 5.6. This may imply a mild agreement on the opinion that instructors are less accessible for assistance outside of class. This can be further examined by the detailed analysis as shown in figure 13 below.
The average values in figure 13 range from 5.767 (minimum) in fall semester 08 to 6.299 (maximum) in spring semester 08. Barring spring semester 07 and spring semester 08 in which students perception was very strong, most of the students in the remaining three semesters have less agreed on whether the instructor was accessible for assistance outside of class.
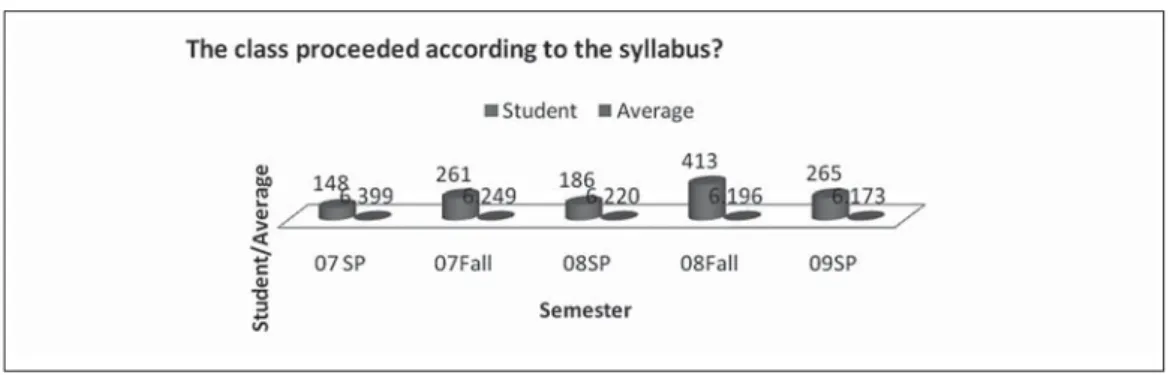
Thirteenth, the average value for the variable on the class proceeded according to the syllabus was about 6 and this confirms students strong agreement in favor of it. The detailed graphical analysis is shown in figure 14.
Figure 12: The instructor took steps to ensure that the classroom environment was suitable for studying?
The values range from 6.173 (minimum) in spring semester 09 to 6.399 (maximum) in spring semester 07. This confirms most of the students strongly agreed that the class proceeded according to the syllabus.
Fourteenth, according to the descriptive statistics of table 1, the mean value of the variable on whether the instructor conducted class while keeping in mind that the level of understanding of the students was estimated at 5.6. The detailed analysis presented graphically across the semesters is also shown in figure 15.
The values in figure 15 vary from 5.899 (minimum) in fall semester 08 to 6.224 (maximum) in spring semester 07. This implies that except for fall semester 08, most of the students strongly agreed that the instructor conducted class while keeping in mind the level of understanding of the students.
Fifteenth, the mean value for the variable that captures whether the students were able to understand new ideas presented in the class was about 5.7, implying students fair agreement that they were able to understand new ideas. The detailed graphical analysis across the semesters is shown in figure 16.
Figure 14: The class proceeded according to the syllabus?
The mean values above range from 5.868 (minimum) in fall semester 08 to 6.267 (maximum) in spring semester 07. This confirms that most of the students agreed in favor of it.
Sixteenth, the mean value obtained from table 1 reveals the variable on students were able to grasp the basic ideas of the course was estimated at about 5.7, implying most of the students agreeing that they were able to grasp the basic ideas of the course. The detailed statistics across semesters are also shown in figure 17.
The values vary from 6.019 (minimum) in fall semester 08 to 6.416 (maximum) in spring semester 08. This confirms most of the students strongly agreed that they were able to grasp the basic ideas of the course.
Seventeenth, the mean value of the variable on whether the instructor treated the students with respect was estimated to be about 6, implying strong agreement from students. The semester-based descriptive statistics are shown in figure 18 below.
Figure 16: You were able to understand new ideas presented in this class?
The average points in figure 18 range from 6.376 (minimum) in fall semester 08 to 6.5 (maximum) in spring semester 07. This implies most of the students strongly agreed that the instructor treated the students with respect.
Finally, the variable on whether the class stimulated students interest has a mean value of 5.7, implying students fair approval in favor of it. More detailed descriptive statistics are also shown on a semester-basis in figure 19.
The average points in figure 19 range from 5.816 (minimum) in fall semester 08 to 6.358 (maximum) in spring semester 07. In four of the five semesters, students strongly agreed that the classes stimulated their interest.
All in all, the average points in the majority of cases are more than 6 points implying most of the students strongly agreed with the points raised in the questionnaire barring some exceptions. Those exceptions where students took neutral position include: (a) whether or not the content of the class was difficult, and to some extent (b) the instructor was accessible for assistance outside of class. Similarly, the minimum average points in many cases were observed in fall semester 08 while the maximum average points were mainly observed in spring semester 07. On the other hand, the highest number of students was mainly noted in fall semester 08 while the lowest record was in spring semester 07.
Figure 18: The instructor treated the students with respect?
Ⅵ.Partial Correlation of overall satisfaction with each of the attributing factors
Correlation analysis deals with relations that exist between variables. The correlation coefficients of each variable determine the nature and strength of the relation between each factors and the overall satisfaction of students in class. Accordingly, correlation analysis not only helps to clarify relations among variables but also often suggests directions for experimental research such as regression analysis. For instance, the positive correlation expected from the relation between the classroom environment was suitable for students and overall satisfaction of students suggests further research exploring the more detailed workings of that relationship including cause-effect relations.
The partial correlation coefficients and their associated significance level have been presented in table 2 below.
Hence, the following explanations may be drawn from the correlation analysis:
• There is significant evidence that overall satisfaction of students in the classes was directly correlated with the perception that the syllabus was a useful reference during course registration. • It has been confirmed that the instructor provided the necessary information for the study was
directly and significantly associated with overall satisfaction in the class.
• Ironically, the correlation analysis shows overall satisfaction was significantly but negatively correlated with the extent to which the instructor gave guidance for assignments. Though there Table 2: Partial Correlation of students overall satisfaction with the other explanatory variables
Variable Correlation Significance
Syllabus was a useful reference when you did course registration? 0.2648 0.082* Topics and issues were clearly indicated by the instructor? 0.0673 0.664
The content of the class was difficult? 0.1595 0.301
The textbook and/or teaching materials were suitable? -0.1943 0.206 The instructor provided the necessary information for your study? 0.2520 0.099*
The instructor spoke in a clear manner? -0.1748 0.256
This class allowed students to think creatively? 0.2271 0.138
You concentrated fully on the lesson? -0.1765 0.252
The instructor gave guidance for assignments? -0.2814 0.064* The classroom environment was suitable for students? 0.2125 0.166 The instructor was accessible for assistance outside of class? -0.0745 0.631 The class proceeded according to the syllabus? -0.0403 0.795 The instructor conducted class as per the level of understanding of students? 0.3428 0.023**
You were able to understand new ideas? 0.0130 0.933
You were able to grasp the basic ideas of the course? 0.1771 0.250 The instructor treated the students with respect? -0.1412 0.361
The class stimulated your interest? 0.4842 0.001***
is a probability that un-necessary and too long guidance may be boring, and not favorable by students in general, it is not however logical to claim that the less guidance the instructor gave for assignments, the more the students were satisfied, the author plans to review this particular data again and examine its reliability and consistency with general assumptions.
• Overall satisfaction is shown to be significantly associated with the view that the instructor
conducted class as per the level of understanding of students, which sounds more logical.
• Finally, the correlation analysis from table 2 confirms that overall satisfaction was directly and significantly related with whether the class stimulated the interest of students.
• Apart from the above five factors that were correlated with overall satisfaction , there was no evidence found for the remaining factors to be associated with overall satisfaction of students in class.
Ⅶ.Regression Analysis
The correlation analysis in the preceding section only tells us whether or not individual attributing factors are associated with overall satisfaction without identifying particular factors that significantly affect overall satisfaction. This task can be accomplished by using regression analysis with the appropriate model and estimation techniques. In this context, a qualitative response variable like this one at hand can be handled in a different way in addition to the traditional OLS regression for cross-sectional data.
Coming to this particular analysis, it should be noted that the range of responses for each question (factor) spans the scale of 1-7. Hence, Tobit censored regression is an appropriate qualitative response model with a specified left-censoring limit=1, and a specified right-censoring limit=7. The Tobit model has nonnegative predicted values for the dependent variable (y), and has sensible partial effects over a wide range of explanatory variables. It also satisfies the classical linear model assumptions; in particular, it has a normal, homoskedastic distribution with a linear conditional mean (Wooldridge, 2002).
Procedurally, it is wise to undertake a specification test such as the test for detecting heteroskedasticity so as to know whether or not the variance of the error term is constant. Accordingly, a Breusch-Pagan test as well as White s general test statistic were conducted and both results confirm that there was no evidence of heteroskadasticity (Breusch-Pagan test shows LM statistic: 19.01261 Chi-sq(18) P-value = .391; and White's general test statistic : 60 Chi-sq(59) P-value = .4392). In other words, the data was found to be homoskedastic, implying a constant error variance, and there was no need for the standard errors to be corrected.
Thus, the model takes the following functional form: Yi = Xi βi + ei
Where, Y denotes overall satisfaction, X s denote a range of factors attributing to overall satisfaction , and ei refers to the error term.
Accordingly, both the OLS and Tobit censored regression estimates have been presented in table 3 and interestingly the findings from both estimation techniques are being consistent and quite informative. The main findings of the regression analysis reveal the following:
• The variable that captures the syllabus was a useful reference during course registration was found to be a statistically significant attributing factor for the overall satisfaction of students in class. The statistical significance level was even 5 % in the case of using the Tobit model compared to the 10 % significance level in the case of OLS estimation.
• The empirical findings from both OLS and Tobit strongly suggest the fact that the instructor provided the necessary information for the study was having a significant positive impact on the
overall satisfaction of students in class.
• The result of Tobit regression analysis confirms that the more the instructor allowed students to think creatively, the greater their overall satisfaction in the class.
• Again, as in the case we encountered in the correlation analysis of the preceding section, the factor which captures the extent to which the instructor gave guidance for assignments was found to be a negative but statistically significant attributing factor for overall satisfaction. Though there is a probability that un-necessary and too long guidance may be boring, and not favorable by students in general, it is not however logical to claim that the less guidance the instructor gave for assignments, the more the students were satisfied. More investigation is required since it is contrary to general assumptions.
• The results from the Tobit estimation reveal that the more the classroom environment is suitable for students, the greater the overall satisfaction of students in the class. The term suitable classroom environment mainly captures the efforts of making the teaching-learning process to be more applied and practical that may match to the real world phenomena. This implies professors/instructors should create learning opportunities in an environment that is likely to evoke positive feelings and learning enthusiasm through constant encouragement and caring, and steer away from being overly critical. Feelings of achievement will definitely lead to increased motivation. It is certainly incumbent on the professors and instructors to maximize the chances of academic excellence to motivate students.
• It was revealed that overall satisfaction is also dependent on whether the instructor conducted
class as per the level of understanding of students. This implies that a strong effort is required
from professors/instructors in tailoring the lessons to suit the levels of competency of the students. For instance, if exercises are set at levels way above the proficiency levels of students, this will lead to frustration, sadness, anger and de-motivation of students who have to struggle with them with no chance of success.
• The OLS and Tobit regression results strongly confirm at 1 % statistical significant level that overall satisfaction was highly dependent on the degree to which the class stimulated the interest of students. This finding is inline with the commonly held notion that effective professors are able to capture and hold students interest, and generate, in nearly every student,
excitement about learning.
• Ironically, the variable that captures whether instructor was accessible for assistance outside of class was not found to be a statistically significant factor for students overall performance and successes. This regression result is inline with the descriptive statistics explained in the preceding section that most of the students in three of the five semesters have less agreed on whether the instructor was accessible for assistance outside of class. This may indicate there is still a room for improvement that professors/ instructors have to be more open and flexible in meeting and supporting students outside classes.
Table 3: OLS & Tobit Regression for Attributing Factors to Overall Satisfaction
Variable OLS Tobit
Coeff. /SE t-value p-value Coeff. /SE t-value p-value
Syllabus was a useful reference when you did course registration
.1746 ( .0982) 1.78 0.082* .1746 ( .0821) 2.13 0.039**
Topics and issues were clearly indicated by the instructor
.0472 ( .1081) 0.44 0.664 .0472 ( .0903) 0.52 0.604
The content of the class was difficult .0561 ( .0535) 1.05 0.301 .0560 ( .0448) 1.25 0.218
The textbook and/or teaching materials were suitable
-.1382 ( .1077) -1.28 0.206 -.1382 ( .0901) -1.53 0.132
The instructor provided the necessary information for the study
.2697 ( .1598) 1.69 0.099* .2697 ( .1337) 2.02 0.050**
The instructor spoke in a clear manner -.0881 ( .0765) -1.15 0.256 -.0881 ( .0640) -1.38 0.176
This class allowed students to think creatively .1087 ( .0719) 1.51 0.138 .1088 ( .0602) 1.81 0.078*
You concentrated fully on the lesson -.1055 ( .0907) -1.16 0.252 -.1055 ( .0759) -1.39 0.172
The instructor gave guidance for assignments -.1889 ( .0994) -1.90 0.064* -.1889 ( .0832) -2.27 0.028**
The classroom environment was suitable for students
.2185 ( .1550) 1.41 0.166 .2185 ( .1297) 1.68 0.099*
The instructor was accessible for assistance outside of class
-.0394 ( .0815) -0.48 0.631 -.0394 ( .0682) -0.58 0.566
The class proceeded according to the syllabus -.0277 ( .1062) -0.26 0.795 -.0277 ( .0888) -0.31 0.756
Class was conducted as per the level of understanding of students
.2513 ( .1062) 2.36 0.023** .2512 ( .0888) 2.83 0.007***
You were able to understand new ideas .0162 ( .1923) 0.08 0.933 .0162 ( .1608) 0.10 0.920
You were able to grasp the basic ideas of the course
.2103 ( .1802) 1.17 0.250 .2103 ( .1508) 1.39 0.170
The instructor treated the students with respect -.0939 ( .1016) -0.92 0.361 -.0939 ( .0851) -1.10 0.275
The class stimulated your interest .4594 (.1281) 3.59 0.001*** .4594 ( .1071) 4.29 0.000***
Constant -.7673 ( .3671) -2.09 0.043 -.7673 ( .3071) -2.50 0.016 R-squared 0.9759 Adjusted R-squared 0.9662 Log likelihood 52.3130 Prob > chi2 0.0000 Number of Observation 60 60
Ⅷ.Conclusion
This study has used descriptive statistics, correlation analysis, and regression analysis to identify the most attributing factors for students overall satisfaction and success in class; based on the data gathered from five semesters average points of 60 courses. The empirical evidences show that when students are provided with more favorable learning conditions, the probability for most of the students to reach a high level of satisfaction is very strong. This, in turn, would enable students to feel better about their courses, their teachers, and themselves, and to be more highly motivated for additional learning. Hence, it would be essential for professors/instructors to become highly effective in their teaching activities by making certain alterations or adaptations to their instructional practices. This may require a certain amount of effort, time, and commitment. It also requires some experimentation, and a tolerance for the occasional failures and setbacks that are likely to occur. However, it should be noted that professors/instructors certainly can support students own effort but they cannot manipulate all of the factors that influence students satisfaction and successes in classes.
While it may be possible to target the motivation and desire of the student as the primary factor in a student's ability to learn, a successful education is one that incorporates a host of interactive elements. For instance, though student s success is highly dependent on the student himself/herself, access to the basic tools of the educational process will greatly impact a student s success. Up- to- date books, access to state-of-the-art technology and sufficient supplies will supplement the learning process. A lack of basic tools can be detrimental to effective learning.
Moreover, being goal-oriented is a vital component to student s success. When there is a purpose it is easier to evaluate the success of the educational process. Hence, professors/instructors should construct detailed course outlines that include an overall description of the course, clear course objectives, and a description of the criteria to be used in evaluating students learning and assigning course grades. In addition, many teachers develop an outline of the topics they plan to discuss during each class session, together with the specific readings and homework that will be assigned. These outlines are then distributed to students on the first day of class, either as a course syllabus or course study guide. Paired with this careful lesson planning and organization, however, there might be a need for and importance of flexibility and responsiveness to students needs and interests. The need may arise in altering course schedules or certain sections of the course to be more adaptive to the students in class. These departures generally come about when unexpected difficulties are encountered or when a current topic attracts a great deal of student attention.
One of the best qualities of effective professors/instructors is their overall positive regard for students. Students generally want to be regarded as individuals with identifiable and unique strengths, weaknesses, and interests. Professors/instructors, therefore, should make a special effort to become aware of, and demonstrate their positive regard for such individual traits and interests.
Though most of the findings that are revealed from the descriptive statistics, correlation analysis, and regression analysis of this study are in line with the findings of other existing literatures, it is
however the first of its kind to synthesize the available information from such a large pool of APU students with heterogeneous and multi-cultural backgrounds, and identify the major attributing factors for students overall satisfaction and educational aspiration. Having said this, it is worth to admit that some of the variables/propositions considered in this study are broad and need to be addressed in more specific way, and hence it will become an avenue for future research.
References
1. Cross, K.P., Accent on Learning, San Francisco: Jossey-Bass, 1976.
2. Ellner, C. L., and Barnes, C. P., Studies of College Teaching. Lexington, MA: Lexington Books, 1983.
3. Guskey, T.R., Staff Development and the Process of Teacher Change , Educational Researcher, 15-5, 1986, pp. 5-12.
4. Guskey, T. R., Improving Student Learning in College Classrooms. Charless c Tomas: Springfield, Illinois, 1988. 5. Kulik, J. A., and Jaska, P., A Review of Research on PSI and Other Educational Technologies in College
Teaching , Educational Technology, 17, 1977, pp. 12-19.
6. Pascarella, E.T., College Environmental Influences on Learning and Cognitive Development: A Critical Review and Synthesis , In Smart, J.C. (eds.), Higher Education: Handbook of Theory and Research, New York: Agathon Press, 1985, pp.1-61.
7. Schunk, D., Pintrich, P., and Meece, J., Motivation in Education: Theory, Research, and Applications, New Jersey: Pearson Education, Inc., 2008.
8. Walberg, H.J., Improving the Productivity of America s Schools , Educational Leadership, 41-80, 1984, pp. 19-27.
9. Weiner, B., Human Motivation: Metaphors, Theories, and Research, Newbury Park, CA: Sage, 1992. 10. http://www.jasso.go.jp/statistics/intl_student/ref09_02_e.html
学生授業評価の全般的満足度の属性要因について
YOKOYAMA Kenji(Dh.P., Dean, Graduate School of Management, APU)
Aye Mengistu Alem(Ph.D., Lecturer, College of International Management, APU) 要 旨 学生の授業の理解度はテストの結果、レポートの内容、授業中の質問や討論に対す学生 の反応などによって判断される。また、学生の授業満足度は学生の授業評価によって判断 できる。しかし、授業評価の利用法は個別的であり、全体として評価の持つ意味や、各評 価項目が相互にどのような関連があるのかについてのマクロ分析と言えるものがない。こ の論文では、評価項目の中心である授業の全般的満足について、他のどの調査項目と最も 関連性があるのかについて分析した。その方法は、計量経済学の研究手法によって行った。 結果として、「授業が興味を刺激した」が最も高い関連性があることが分かった。今後の 課題は、授業のそして教員のどのような方法や言動が学生の興味を刺激するのかを明確に することである。この点については調査も完了したので、近日発表する。 キーワード 属性要因、学生授業評価、経営管理研究科、全般的満足度、刺激、興味、計量経済学