Histone deacetylase 1 and 2 drive
differentiation and fusion of progenitor cells
in human placental trophoblasts.
著者
Gargi Jaju Bhattad, Mariyan J Jeyarajah, Megan
G McGill, Vanessa Dumeaux, Hiroaki Okae,
Takahiro Arima, Patrick Lajoie, Nathalie G
Berube, Stephen J Renaud
journal or
publication title
Cell Death & Disease
volume
11
page range
311
year
2020-05-04
URL
http://hdl.handle.net/10097/00130831
A R T I C L E
O p e n A c c e s s
Histone deacetylase 1 and 2 drive differentiation
and fusion of progenitor cells in human placental
trophoblasts
Gargi Jaju Bhattad
1, Mariyan J. Jeyarajah
1, Megan G. McGill
1, Vanessa Dumeaux
2,3, Hiroaki Okae
4, Takahiro Arima
4,
Patrick Lajoie
1, Nathalie G. Bérubé
1,2,5,6and Stephen J. Renaud
1,6Abstract
Cell fusion occurs when several cells combine to form a multinuclear aggregate (syncytium). In human placenta, a syncytialized trophoblast (syncytiotrophoblast) layer forms the primary interface between maternal and fetal tissue, facilitates nutrient and gas exchange, and produces hormones vital for pregnancy. Syncytiotrophoblast development occurs by differentiation of underlying progenitor cells called cytotrophoblasts, which then fuse into the
syncytiotrophoblast layer. Differentiation is associated with chromatin remodeling and specific changes in gene expression mediated, at least in part, by histone acetylation. However, the epigenetic regulation of human cytotrophoblast differentiation and fusion is poorly understood. In this study, we found that human
syncytiotrophoblast development was associated with deacetylation of multiple core histone residues. Chromatin immunoprecipitation sequencing revealed chromosomal regions that exhibit dynamic alterations in histone H3 acetylation during differentiation. These include regions containing genes classically associated with cytotrophoblast differentiation (TEAD4, TP63, OVOL1, CGB), as well as near genes with novel regulatory roles in trophoblast
development and function, such as LHX4 and SYDE1. Prevention of histone deacetylation using both pharmacological and genetic approaches inhibited trophoblast fusion, supporting a critical role of this process for trophoblast differentiation. Finally, we identified the histone deacetylases (HDACs) HDAC1 and HDAC2 as the critical mediators driving cytotrophoblast differentiation. Collectively, thesefindings provide novel insights into the epigenetic mechanisms underlying trophoblast fusion during human placental development.
Introduction
Cell fusion into a syncytium is the process whereby several cells coalesce to form a multinucleated entity, and features in homeostasis of several normal tissues and pathologies (e.g., cancer, virus infection, inflammation)1,2. One of the best paradigms of syncytium formation occurs in the placenta—the organ that forms the interface between a pregnant mother and her baby. The placental
exchange surface is lined by a syncytium, called syncy-tiotrophoblast, which produces hormones and facilitates transfer of nutrients and gases between maternal and fetal blood. Syncytiotrophoblast is formed by fusion of underlying progenitor cells called cytotrophoblasts3. Continuous fusion of cytotrophoblasts is crucial for syn-cytiotrophoblast to expand and replenish, ensuring proper function of the exchange surface throughout pregnancy4. Dysregulation of syncytiotrophoblast formation leads to poor placental function, and is associated with several highly prevalent pregnancy complications that are detri-mental to maternal and fetal health5–7.
Syncytiotrophoblast nuclei exhibit a wide range of dis-tinctive chromatin condensation patterns, with some
© The Author(s) 2020
Open Access This article is licensed under a Creative Commons Attribution 4.0 International License, which permits use, sharing, adaptation, distribution and reproduction in any medium or format, as long as you give appropriate credit to the original author(s) and the source, provide a link to the Creative Commons license, and indicate if changes were made. The images or other third party material in this article are included in the article’s Creative Commons license, unless indicated otherwise in a credit line to the material. If material is not included in the article’s Creative Commons license and your intended use is not permitted by statutory regulation or exceeds the permitted use, you will need to obtain permission directly from the copyright holder. To view a copy of this license, visithttp://creativecommons.org/licenses/by/4.0/.
Correspondence: Stephen J. Renaud (srenaud4@uwo.ca)
1Department of Anatomy and Cell Biology, Schulich School of Medicine and
Dentistry, University of Western Ontario, London, ON, Canada
2Department of Pediatrics, Schulich School of Medicine and Dentistry,
University of Western Ontario, London, ON, Canada
Full list of author information is available at the end of the article Edited by E. Candi 1234567890() :,; 1234567890( ):,; 1234567890() :,; 1234567890( ):,;
nuclei demonstrating an open euchromatic appearance and others possessing a more heterochromatic state. Previous studies have indicated that syncytiotrophoblast nuclei are transcriptionally inert based on assessing uptake of [3H]-uridine, which correlates with the high number of heterochromatic nuclei8,9. Follow-up studies show that at least some nuclei are transcriptionally active10. These studies infer that cytotrophoblast pro-gression into syncytiotrophoblast is associated with altered chromatin dynamics, which may be required for the robust changes in transcription required for syncy-tiotrophoblast formation and function.
Histone acetylation is an epigenetic modification in which an acetyl group is covalently added to lysine resi-dues on histone tails protruding from nucleosomes, and is a key determinant of chromatin accessibility11. The dynamics of histone acetylation in regulating chromatin structure is fundamentally important for the precise timing and level of gene transcription. Histone acetylation is catalyzed by enzymes with acetyltransferase activity, and is associated with open chromatin regions and active transcription. Deacetylation is typically associated with chromatin condensation, and is performed by enzymes called histone deacetylases (HDACs)12. Although HDACs are classically associated with inactive transcription, both acetyltransferases and HDACs bind to chromatin near sites of actively transcribed regions, where they function cooperatively to fine-tune histone acetylation and facil-itate binding of machinery required for transcription13. HDACs are arranged into four distinct classes, of which class I, II, and IV have a zinc-dependent active site that is inhibited by trichostatin A (TSA). Class I HDACs reside in nuclei, and consist of HDAC1, HDAC2, HDAC3, and HDAC8. Class II HDACs shuttle between nucleus and cytoplasm, and include HDAC4, HDAC5, HDAC6, HDAC7, HDAC9, and HDAC10. HDAC11 is the sole member of class IV14. Class III HDACs are a distinct family identified as sirtuins, which depend on nicotina-mide adenine dinucleotide for deacetylase activity15.
Due to their critical role as regulators of chromatin accessibility and gene transcription, histone acetylation dynamics serve a crucial role in the control of cell pro-liferation and differentiation16. For example, HDAC1 regulates embryonic stem cell differentiation17,18, and controls lineage-specific transcriptional networks in mouse embryonic and trophoblast stem cells19. Blocking HDAC activity in mouse trophoblast stem cells promotes labyrinth trophoblast development at the expense of giant cell and spongiotrophoblast formation20. Class II HDACs are important for proper trophoblast differentiation in mouse placentas21, and mouse trophoblast stem cells lacking Sirtuin-1 show blunted cell differentiation22. In human trophoblasts, HDAC inhibition impairs expression of the efflux protein P-glycoprotein, and the cortisol
metabolizing enzyme 11β-hydroxysteroid dehy-drogenase23,24. Recent derivation of human trophoblast stem cells was made possible, in part, by using an HDAC inhibitor to maintain cells in a stem state, suggesting a critical role for HDAC activity in human trophoblast differentiation25. Indeed, differentiation of primary human cytotrophoblasts is associated with profound changes in histone acetylation, including gene- and promoter-specific changes in H3K9 and H3K27 acetyla-tion26. Collectively, these studies emphasize the critical role of histone acetylation dynamics and HDAC activity in the regulation of trophoblast differentiation and placental development, which prompted us to investigate the functional role of specific HDACs during human syncy-tiotrophoblast formation.
In this study, we found that histone acetylation decreases as trophoblast cells and cell lines differentiate into syncytiotrophoblast, and that HDAC1 and HDAC2 activity is required for cytotrophoblast differentiation. We identified several genomic regions in which acetylation patterns are altered during cytotrophoblast differentiation that correlate with robust changes in gene transcription required for differentiation. Collectively, our results reveal a critical role of HDACs for the regulation of cyto-trophoblast differentiation, and provide new insights into the epigenetic regulation of human syncytiotrophoblast formation.
Results
Expression of acetylated histone proteins in human placenta and differentiating cytotrophoblasts
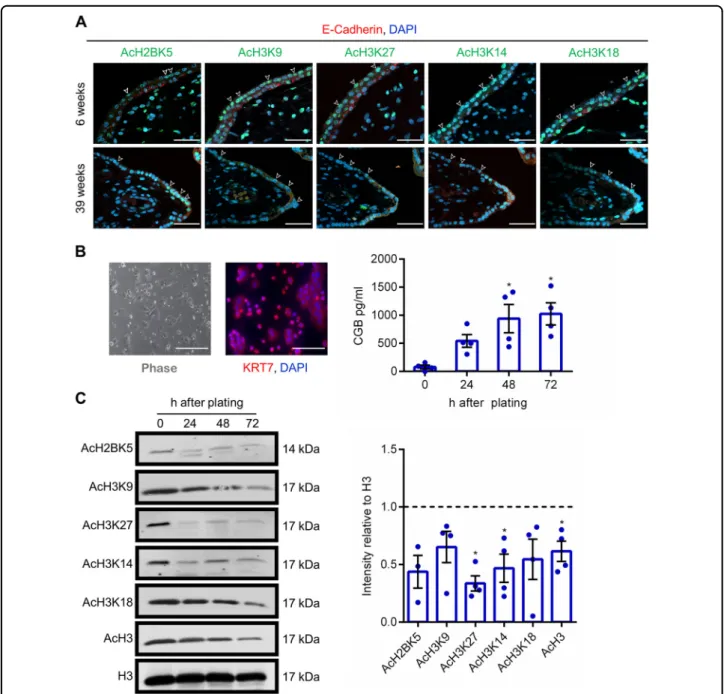
To evaluate localization of acetylated histone proteins in human placenta, we performed immunohistochemistry to detect acetylated histone H2B K5 (AcH2BK5), acetylated histone H3 (AcH3) K9, AcH3K27, AcH3K14, and AcH3K18 in 6-week and 39-week human placenta. All acetylated histone lysine residues were identified in both cytotrophoblasts (identified using E-cadherin) and syn-cytiotrophoblast in 6-week placentas (Fig.1a). Acetylated histones were also detected in the villous core. In 39-week placentas, few cytotrophoblasts were visible, and staining intensity of acetylated histone proteins in syncytio-trophoblast appeared to be lower than in early gestation placentas. Interestingly, patterns of histone acetylation were not consistent between cells of the same lineage, with some cells exhibiting robust expression of histone acetylation and other cells with low-to-undetectable expression. These findings indicate that histone acetyla-tion patterns in the human placenta are dynamic, and may be associated with altered function or developmental progression within placental cells. Since images represent a snapshot of the human placenta and we cannot confirm the developmental stage of each cell, we sought to analyze histone acetylation patterns in primary cytotrophoblasts,
where cells exhibit synchrony in terms of their develop-mental progression.
Immunofluorescence for cytokeratin-7 was used to evaluate the purity of the isolated cytotrophoblast popu-lations (Fig. 1b). Cytotrophoblasts were then lysed
immediately before plating (0 h), or cultured for 24, 48, or 72 h, during which time they spontaneously differentiate into syncytiotrophoblast and produce high levels of the syncytiotrophoblast hormone subunit chorionic gonado-tropin beta (CGB) (Fig. 1b). Interestingly, levels of
Fig. 1 Histone acetylation patterns in human placenta and primary cytotrophoblasts. a Localization of AcH2BK5, AcH3K9, AcH3K27, AcH3K14, and AcH3K18 in 6-week and 39-week human placenta. In all panels, cytotrophoblasts were detected by immunostaining for E-cadherin (red), and nuclei were counterstained using DAPI (blue). Arrowheads denote the syncytiotrophoblast layer. b Primary cytotrophoblasts were isolated from term human placenta, and cultured for 24, 48, and 72 h. At the 24-h timepoint, KRT7 (red) was detected by immunofluorescence to validate that these cells were trophoblasts. Nuclei were counterstained using DAPI (blue). CGB production was determined in conditioned media by enzyme immunoassay. c Levels of AcH2BK5, AcH3K9, AcH3K27, AcH3K14, AcH3K18, AcH3, and total histone H3 (loading control) were determined by western blotting (n= 4). Densitometric analysis relative to total histone H3 is shown beside the representative western blots. The dotted line represents signal intensity in undifferentiated cells. Graphs represent means ± SEM. Data significantly different from undifferentiated cells are indicated by an asterisk (*P < 0.05; n= 4 from different placentas). Scale bars represent 40 μm.
AcH3K27, AcH3K14, and AcH3 significantly decreased at 72 h differentiation (Fig. 1c). Levels of AcH2BK5, AcH3K9, and AcH3K18 appeared to be decreased, but did not reach statistical significance (P = 0.058, P = 0.082, and P= 0.080, respectively).
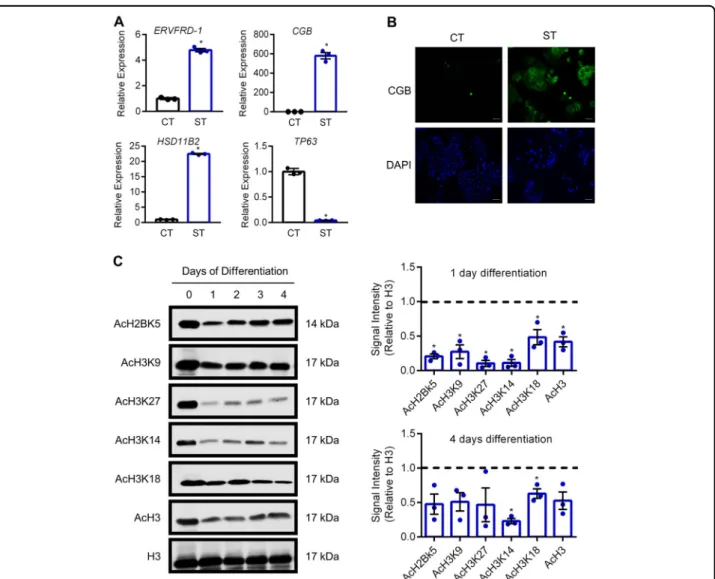
Next, we investigated patterns of histone acetylation in recently-derived human trophoblast stem cells maintained in the stem state, or following differentiation into syncy-tiotrophoblast. When induced to differentiate toward the syncytiotrophoblast lineage, human trophoblast stem cells exhibit increased expression of ERVFRD-1 (4.7-fold, encodes syncytin-2), CGB (579.9-fold), and HSD11B2 (22.4-fold, encodes the glucocorticoid-inactivating enzyme
corticosteroid 11-β-dehydrogenase isozyme 2), and decreased expression of TP63 (17-fold; all P < 0.05, Fig.2a). CGB is also highly detectable at the protein level (Fig. 2b). Not surprisingly, during TS cell differentiation toward syncytiotrophoblast, removal of the HDAC inhi-bitor valproic acid (used as a media component to main-tain these cells in a stem state) correlated with reduced levels of AcH2BK5, AcH3K9, AcH3K27, AcH3K14, AcH3K18, and AcH3 as early as one day after onset of differentiation (all P < 0.05, Fig. 2c). The reduced acetyla-tion during syncytializaacetyla-tion is consistent with our obser-vations in primary cytotrophoblasts. After four days of syncytiotrophoblast development, levels of histone
Fig. 2 Reduced histone acetylation during syncytialization of human trophoblast stem cells. a Transcript levels of ERVFRD-1, CGB, HSD11B2, and TP63 in human trophoblast stem cells cultured in stem conditions, and following 5 days culture in conditions that promote syncytiotrophoblast formation. b Detection of CGB in human trophoblast stem cells cultured in stem and differentiation conditions. Nuclei were counterstained using DAPI (blue). c Levels of AcH2BK5, AcH3K9, AcH3K27, AcH3K14, AcH3K18, AcH3, and total H3 were determined by western blotting. Densitometric analysis relative to total histone H3 on day 1 and day 4 of syncytialization is shown to the right of the western blots. The dotted line represents signal intensity in undifferentiated cells. Graphs represent means ± SEM. Data significantly different from undifferentiated cells are indicated by an asterisk (P < 0.05; n= 3). Scale bars represent 100 μm.
acetylation remained lower than in the undifferentiated state, although only AcH3K14 and AcH3K18 were statis-tically significant.
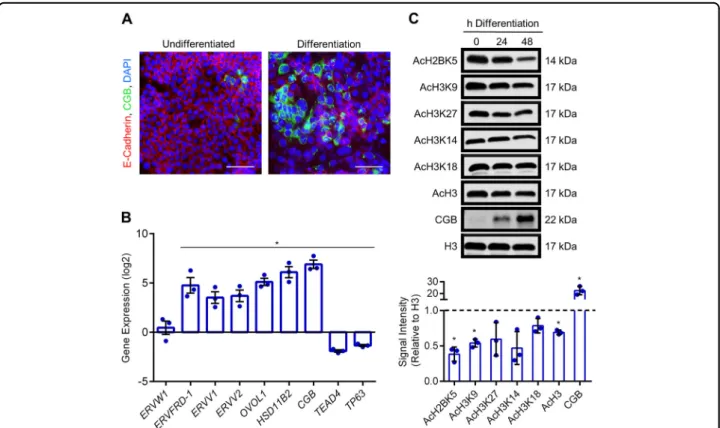
To further examine histone acetylation patterns during cytotrophoblast differentiation, we used BeWo tropho-blasts—a transformed cytotrophoblast cell line that is commonly used to study dynamics of cytotrophoblast differentiation into syncytiotrophoblast. The advantage of using these cells is that onset of differentiation can be precisely timed by exposing cells to a cell-permeable derivative of 3′, 5′-cyclic adenosine monophosphate (8-Br-cAMP), resulting in decreased surface expression of junctional proteins such as E-cadherin and increased production of CGB (Fig. 3a). Differentiation of BeWo trophoblasts was associated with increased mRNA expression of CGB (130.5-fold, P < 0.05), HSD11B2 (78.9-fold, P < 0.05), ERVW1 (1.6-(78.9-fold, encodes syncytin-1), ERVFRD-1 (36.7-fold, P < 0.05), the retroviral genes ERVV1and ERVV2 (13.4-fold and 15.1-fold, respectively, both P < 0.05), and OVOL1 (36.8-fold, encodes a tran-scriptional repressor essential for cytotrophoblast
differentiation, P < 0.05; Fig.3b). Differentiation was also associated with decreased expression of genes encoding transcription factors associated with cytotrophoblast progenitor traits (TP63: 2.6-fold; TEAD4: 3.8-fold; Fig.3b, P< 0.05). At the protein level, differentiation was asso-ciated with a 22.5-fold upregulation of CGB, and reduced levels of AcH2BK5, AcH3K9, and AcH3 (62%, 46%, and 31% decreased at 48 h differentiation compared with undifferentiated cells, respectively; Fig. 3c, all P < 0.05). Levels of AcH3K27, AcH3K14, and AcH3K18 appeared to be reduced in differentiated cells, but did not reach sta-tistical significance (P = 0.22, P = 0.058, and P = 0.13, respectively). Thus, trophoblast differentiation into syn-cytiotrophoblast is associated with reduced acetylation of multiple histone lysine residues.
Dynamic changes in genomic AcH3 binding during syncytiotrophoblast development
Since syncytiotrophoblast development was associated with reduced histone acetylation, our next goal was to use chromatin immunoprecipitation sequencing to evaluate
Fig. 3 Reduced histone acetylation during syncytialization of BeWo trophoblasts. a Representative immunofluorescent images depicting E-cadherin and CGB expression in BeWo trophoblasts cultured in undifferentiated and differentiation conditions. Nuclei were counterstained using DAPI (blue). Please note the loss of E-cadherin in syncytialized cells, and increased production of CGB. b Transcript levels of various genes associated with cytotrophoblast progenitor traits (TP63, TEAD4) and syncytiotrophoblast development (ERVW1, ERVFRD-1, ERVV1, ERVV2, OVOL1, HSD11B2, and CGB) in cells cultured in undifferentiated and differentiation conditions. c Levels of AcH2BK5, AcH3K9, AcH3K27, AcH3K14, AcH3K18, AcH3, CGB, and total H3 were determined by western blotting. Densitometric analysis relative to total histone H3 is shown below the representative western blots. The dotted line represents signal intensity in undifferentiated cells. Graphs represent means ± SEM. Data significantly different from undifferentiated cells are indicated by an asterisk (*P < 0.05; n= 3). Scale bars represent 80 μm.
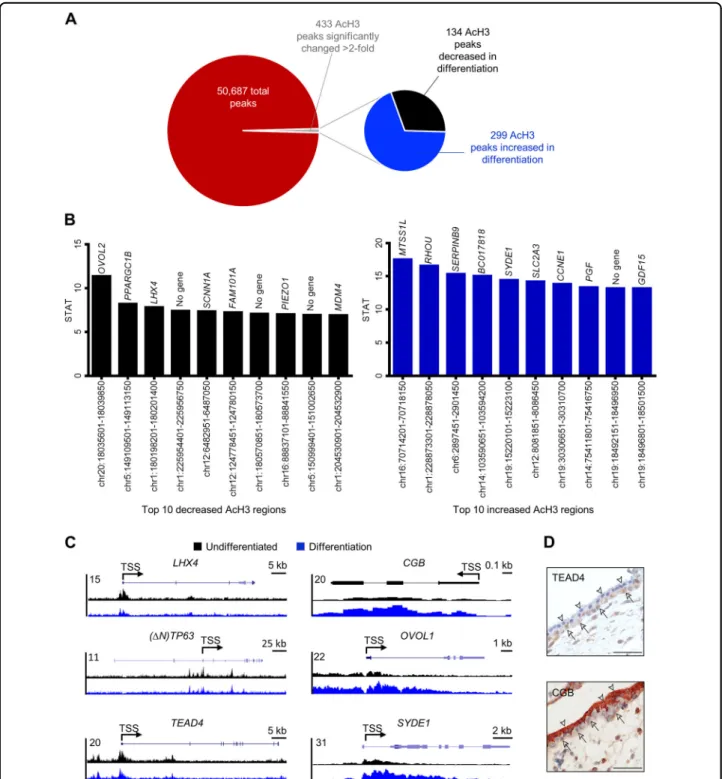
Fig. 4 Dynamic changes in genomic AcH3 binding during trophoblast differentiation. a Pie chart showing total number of AcH3 peaks, and the number of peaks that increased or decreased AcH3 binding during syncytiotrophoblast development by at least twofold (Padj< 0.01). b Top 10
chromosomal regions exhibiting decreased (black bars) and increased (blue bars) AcH3 binding during differentiation. Genes located proximate (<1 kb) to these chromosomal areas are included above each bar. c Representative genome browser views of chromosomal regions proximate to LHX4, (ΔN)TP63, TEAD4, CGB, OVOL1, and SYDE1, which exhibit differential AcH3 binding in undifferentiated and differentiation conditions. d Immunohistochemistry for TEAD4 and CGB onfirst trimester human placental sections. Arrowheads denote syncytiotrophoblast; arrows point to cytotrophoblasts. Scale bars represent 50μm.
site-specific changes in histone H3 acetylation in undif-ferentiated BeWo trophoblasts versus cells undergoing differentiation. We identified 50,678 AcH3 peaks genome wide, of which 433 peaks were significantly changed at least twofold (Padj< 0.01) between undifferentiated and
differentiated cells. One hundred and thirty-four peaks (30.9%) exhibited at least twofold higher H3 acetylation in undifferentiated cells, whereas higher H3 acetylation in differentiation conditions was detected at 299 peaks (69.1%, Fig.4a). The top ten chromosomal regions exhi-biting higher AcH3 occupancy in undifferentiated cells and differentiated cells are shown in Fig.4b. Interestingly, ten of the top twenty peaks that exhibited robust deace-tylation during differentiation aligned to chromosomes 1 and 5, whereas eight of the top twenty peaks showing increased acetylation were located on chromosomes 14 and 19, which is consistent with a large number of genes on these chromosomes expressed in syncytiotropho-blast27. Increased AcH3 binding in undifferentiated cells was also identified near genes previously associated with
cytotrophoblast stem traits (TEAD4 at chr12:3066251-3068900, TP63 at chr3:189507601-189509350, Fig. 4c, both P < 0.01; TEAD4 localized to cytotrophoblasts in human placenta is shown in Fig.4d). Increased AcH3 in differentiated cells was consistently detected close to genes associated with syncytiotrophoblast development and function (CGB at chr19:49525501-49525850, OVOL1 at chr11:65554451-65557400, ERVW1 at chr7:92098079-92099695, ERVFRD-1 at chr6:11102722-11112071, HSD11B2 at chr16:67465036-67471454, Fig. 4c and Fig. S1, all P < 0.01; CGB localized to syncytiotrophoblast in human placenta is shown in Fig.4d). Additionally, we also discovered several regions that exhibit differential AcH3 levels located near genes that have not been pre-viously associated with human syncytiotrophoblast development. These novel targets include a differentiation-associated increase in AcH3 near the gene encoding synapse defective 1 (SYDE1), which is a Rho-GTPase activating protein stimulated by glial cells miss-ing-1, and is important for murine placentation and
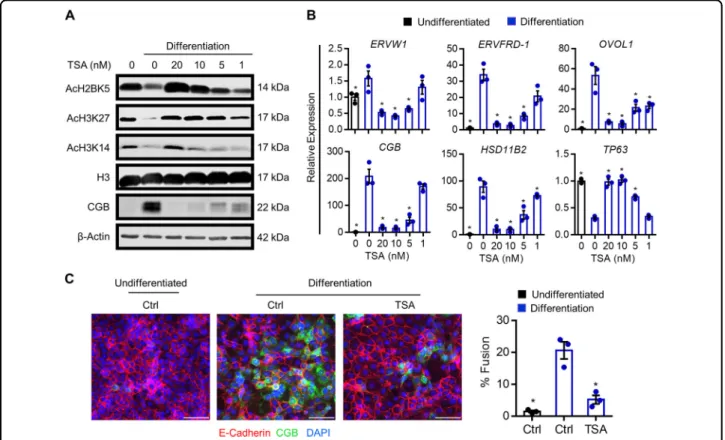
Fig. 5 Effect of HDAC inhibition on histone acetylation and syncytiotrophoblast development. BeWo trophoblasts were exposed to the broad spectrum HDAC inhibitor trichostatin A (TSA, 0–20 nM), and then induced to differentiate for 48 h. a Levels of AcH2BK5, AcH3K27, AcH3K14, histone H3, CGB, andβ-Actin (loading control) were determined by western blotting. b Transcript levels of ERVW1, ERVFRD-1, OVOL1, CGB, HSD11B2, and TP63 in cells cultured in undifferentiated (black bar) and differentiation (blue bars) conditions with or without various doses of TSA. c Percentage of fused cells following culture in undifferentiated or differentiation conditions with or without 20 nM TSA. Representative images of E-cadherin (red) and CGB (green) are shown to the left of the graph. Nuclei were counterstained using DAPI (blue). Scale bar represents 80μm. Graphs represent means ± SEM. Data significantly different from the Ctrl (0 nM TSA) cells cultured in differentiation conditions are indicated by an asterisk (*P < 0.05; n = 3 in (b), n = 9 images from three experiments in (c)).
human trophoblast migration28. Decreased AcH3 binding was detected during differentiation near LIM homeobox 4 (LHX4), which is important for development of the pla-cental labyrinth zone in mice29.
HDAC inhibition prevents cytotrophoblast differentiation
Altered acetylation levels of multiple histone residues during cytotrophoblast differentiation suggest that HDACs may be important mediators of syncytiotropho-blast development. To determine the impact of HDAC activity on trophoblast differentiation, BeWo trophoblasts were treated with the broad spectrum HDAC inhibitor, TSA, and then induced to differentiate for up to 48 h. TSA dose-dependently increased levels of AcH2BK5, AcH3K27, and AcH3K14 (Fig. 5a). To determine the impact of TSA on transcripts associated with cyto-trophoblast differentiation, we assessed expression of genes that change during differentiation (Fig.5b). Expo-sure of cells to TSA prior to commencing differentiation dose-dependently inhibited expression of all genes that
are normally induced during differentiation, including ERVW1, ERVFRD-1, OVOL1, CGB, and HSD11B2 (Fig.5b, P < 0.05). In the presence of 10 and 20 nM TSA, expression of TP63 was maintained at levels comparable to undifferentiated cells (Fig.5b). Furthermore, compared with cells exposed to differentiation conditions for 48 h, in which nuclei were frequently contained within fused cell clusters (E-cadherin-negative, CGB-positive), 74.9% less nuclei were detected within fused clusters in the presence of 20 nM TSA (P < 0.05, Fig. 5c). Thus, inhibition of HDAC activity prevented syncytiotrophoblast formation.
To test the efficacy of another broad-spectrum inhibitor of HDAC activity on syncytiotrophoblast development, BeWo trophoblasts were treated with various doses of SAHA. Cells exposed to SAHA under differentiation conditions exhibited a similar prevention of histone dea-cetylation and dose-dependent restoration of transcript expression comparable to levels detected in undiffer-entiated cells, as was observed with TSA (Fig. S2). Likewise, exposure of cells to SAHA prevented
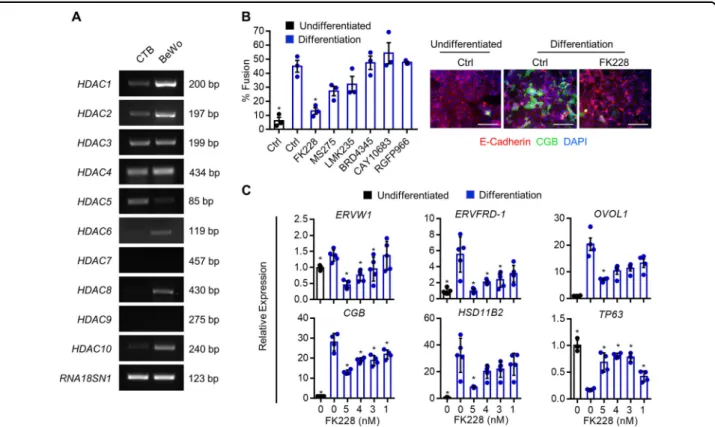
Fig. 6 Effect of selective HDAC inhibitors on syncytiotrophoblast development. a RT-PCR depicting expression of HDAC1-10 in primary term cytotrophoblasts (CTB) and BeWo trophoblasts. RNA18SN1 was used to ensure that a similar quantity of cDNA was used in PCR reactions. b Percentage of BeWo trophoblasts that underwent syncytialization following culture in undifferentiated conditions (black bar), or differentiation conditions (blue bars) in the presence of FK228, MS275, LMK235, BRD4345, CAY10683, or RGFP966. Please note that only the HDAC1/HDAC2 inhibitor FK228 significantly inhibited cytotrophoblast differentiation. Representative images of E-cadherin (red) and CGB (green) in undifferentiated and differentiation conditions with or without 5 nM FK228 is shown to the right of the graph. Nuclei were counterstained using DAPI (blue). Scale bar represents 80μm. c Transcript levels of ERVW1, ERVFRD-1, OVOL1, CGB, HSD11B2, and TP63 in cells cultured in undifferentiated and differentiation conditions with or without various doses of FK228. Graphs represent means ± SEM. Data significantly different from control cells cultured in differentiation conditions are indicated by an asterisk (*P < 0.05; n= 9 images from three experiments in (b), n = at least 4 in (c)).
syncytiotrophoblast development by 72.7% (Fig. S2C, P < 0.05). Since both TSA and SAHA abrogated cytotropho-blast differentiation, we conclude that HDAC activity is required for syncytiotrophoblast development.
HDAC1 and HDAC2 are critical regulators of cytotrophoblast differentiation
We next investigated the role of specific HDACs in cytotrophoblast differentiation. First, we profiled expres-sion of HDAC1 to HDAC10 in human primary cyto-trophoblasts and BeWo cyto-trophoblasts (Fig. 6a). HDAC1, HDAC2, HDAC3, HDAC4, HDAC5, and HDAC10 were detectable in both primary cytotrophoblasts and BeWo trophoblasts. HDAC6 and HDAC8 were detectable in BeWo trophoblasts, but expression was low or undetect-able in primary cytotrophoblasts. HDAC7 and HDAC9 were not detectable in either cell-type. To narrow our search for specific HDACs involved in syncytiotropho-blast development, cells cultured under differentiation conditions were treated with small molecule inhibitors that decrease activity of defined subsets of HDACs. Dose and specificity of the HDAC inhibitors used in this study are provided in Table 1. The only HDAC inhibitor that prevented differentiation was the HDAC1/HDAC2 inhi-bitor FK228 (71% decrease in fusion, P < 0.05, Fig. 6b). The highest concentration of FK228 (5 nM) inhibited expression of the differentiation-associated transcripts ERVW1 (66.9%), ERVFRD-1 (82.6%), OVOL1 (68.6%), CGB (51.9%), and HSD11B2 (73.9%, all P < 0.05), and prevented differentiation-associated repression of TP63 by 75% (Fig.6c, P < 0.05).
To further determine the biological significance of HDAC1 in syncytiotrophoblast development, we deliv-ered two-distinct shRNAs into BeWo trophoblasts, and generated stable populations of cells with constitutively decreased HDAC1 expression (HDAC1-KD1 and
HDAC1-KD2). Using this strategy, HDAC1 mRNA was decreased by 87.5% in HDAC1-KD1 cells, and 64.6% in HDAC1-KD2 cells compared with controls (P < 0.05, Fig. S3A). HDAC1 protein was also substantially reduced in both KD1 and KD2 cells (Fig. S3B). There was no significant effect of HDAC1 knockdown on mRNA expression of HDAC2, but an increase in HDAC2 protein was apparent, which is consistent with findings reported in other cells in which HDAC1 is reduced or absent30. There was no significant effect of HDAC1 deficiency on the ability of cells to differentiate (Fig. S3D), nor was there any difference in transcript expression of ERVFRD-1, HSD11B2, and TP63 (Fig. S3C). A modest reduction of CGB expression was observed in HDAC1-KD2 cells (54.4%, P < 0.05, Fig. S3C), but not in HDAC1-KD1 cells.
We employed a similar strategy to decrease HDAC2 expression. Stable populations of BeWo trophoblasts expressing shRNAs targeting HDAC2 exhibited reduced mRNA levels of HDAC2 (90.5% and 87.6% decreased in HDAC2-KD1 and HDAC2-KD2 cells, respectively, P < 0.05, Fig. S4A), and showed reduced HDAC2 protein (Fig. S4B). Cells lacking HDAC2 were able to robustly differentiate (Fig. S4D), and there were no consistent differences in the expression of differentiation-associated genes in HDAC2-KD1 and HDAC2-KD2 cells compared with control cells (Fig. 4C). Thus, deficiency of HDAC1 or HDAC2 is not sufficient to prevent syncytiotrophoblast development.
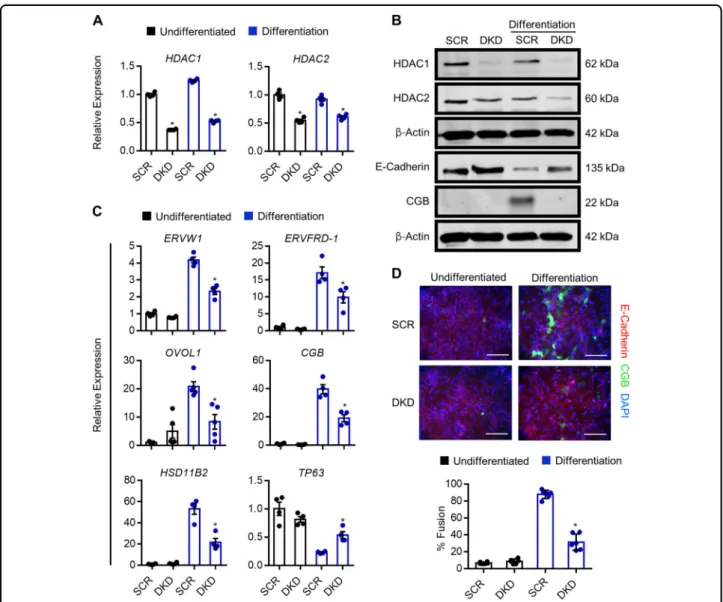
Since HDAC1 and HDAC2 are highly similar proteins that have the potential to compensate for each other31, we next analyzed the impact of reduced expression of both HDAC1 and HDAC2 on trophoblast differentiation capacity. Stable populations of HDAC1-KD1 cells were transduced with lentivirus carrying HDAC2-KD1 shRNAs, resulting in cells that exhibited a 59.6% decrease in HDAC1 expression and 34.7% decrease in HDAC2expression (P < 0.05, Fig.7a). Since expression of both HDAC1 and HDAC2 was reduced, these cells are henceforth referred to as “double knockdown” (DKD) cells. DKD cells exhibited a mild proliferation defect under undifferentiated conditions (not shown), which may explain the reduced knockdown efficiency of HDAC1and HDAC2 in DKD cells, since some HDAC1/ HDAC2 expression is likely required in the undiffer-entiated state. Under differentiation conditions, DKD cells exhibited impaired differentiation capacity, includ-ing reduced protein expression of CGB and increased E-cadherin levels (Fig. 7b), and a 64.2% decrease in the number of cells that underwent fusion (P < 0.05, Fig.7d). Furthermore, compared with control cells subjected to differentiation conditions, DKD cells exhibited sig-nificantly reduced expression of ERVW1 (45%), ERVFRD-1 (45.8%), OVOL1 (60%), CGB (51%) and
Table 1 HDAC inhibitors used in this study.
Name Specificity Dose Company, catalog
BRD434566 HDAC5, HDCA9 1300 nM Sigma-Aldrich SML1706
CAY1068367 HDAC2 300 nM Cayman Chemical Co
15403-5
FK22868 HDAC1, HDAC2 5 nM Sigma-Aldrich SML1175
LMK23569 HDAC4, HDAC5 880 nM Sigma-Aldrich SML1053
MS27570 HDAC1, HDAC3 740 nM Cayman Chemical Co 13284-1
RGFP96671 HDAC3 160 nM Cayman Chemical Co
16917-1
SAHA72 Pan 50-750 nM Sigma-Aldrich SML0061
HSD11B2(58%), and retained 2.3-fold higher expression of TP63 (all P < 0.05, Fig. 7c). Chromatin immunopre-cipitation analysis showed that, when cells were exposed to differentiation conditions, DKD cells had reduced AcH3 enrichment proximate to the transcription start site of both HSD11B2 and OVOL1 compared with con-trol cells (Fig. S5). Collectively, these findings indicate that DKD cells have a reduced capacity to differentiate, indicating that HDAC1 and HDAC2 are critical media-tors of syncytiotrophoblast development.
Discussion
In the present study, we found that global acetylation of core histones is altered during progression of cyto-trophoblast differentiation into syncytiocyto-trophoblast. We also identified dynamic changes in histone acet-ylation during trophoblast differentiation, including site-specific changes at loci that require transcriptional regulation during differentiation, and showed that HDAC activity is critical for syncytiotrophoblast for-mation. Collectively, our discoveries provide novel
Fig. 7 Knockdown of HDAC1 and HDAC2 inhibits syncytiotrophoblast development. a Expression of HDAC1 and HDAC2 in BeWo trophoblasts expressing control (scrambled, SCR) shRNA or shRNAs targeting HDAC1 and HDAC2 (double knockdown, DKD) cultured in undifferentiated (black bars) and differentiation (blue bars) conditions. b Western blot showing protein levels of HDAC1, HDAC2, E-cadherin, and CGB in SCR and DKD cells cultured in undifferentiated and differentiation conditions.β-Actin shown in the third blot (from top) served as a loading control for HDAC1 and HDAC2 blots;β-Actin shown in the sixth blot served as a loading control for E-cadherin and CGB. c Transcript levels of ERVW1, ERVFRD-1, OVOL1, CGB, HSD11B2, and TP63 in SCR and DKD cells cultured in undifferentiated and differentiation conditions. d Percentage of SCR and DKD cells that underwent syncytialization (E-cadherin-negative, CGB-positive) following culture in undifferentiated or differentiation conditions. Representative images of E-cadherin (red) and CGB (green) is shown above the graph. Nuclei were counterstained using DAPI (blue). Graphs represent means ± SEM. Data significantly different from SCR cells cultured in differentiation conditions are indicated by an asterisk (*P < 0.05; n = at least 4 in (a) and (c), n = 18 images from six experiments in (d). In (c) and (d), statistical comparisons are shown only for differentiation conditions). Scale bars represent 80μm.
insights into the epigenetic mechanisms of syncytio-trophoblast development.
Reversible acetylation of specific lysine residues in his-tone proteins is a major component of the epigenetic code that regulates chromatin accessibility. The acetylation status of histones is controlled through the competing actions of HDACs and histone acetyltransferases, which have a pivotal role in controlling gene expression during cell homeostasis, proliferation, and differentiation. In the current study, we found that coordination of cyto-trophoblast differentiation into syncytiocyto-trophoblast was associated with reduced acetylation of multiple histone lysine residues. Syncytialization is associated with a mul-titude of transcriptional changes32, so it was surprising to observe a robust decrease in histone acetylation during the progression of differentiation. One potential expla-nation is that histone hypoacetylation is required to transiently exit the epithelial state in order to facilitate syncytialization. High levels of histone acetylation are associated with maintenance of the epithelial phenotype33,
and histone deacetylation is implicated with repression of epithelial characteristics and transition to a mesenchymal state34,35. While there is no evidence that syncytio-trophoblast formation requires a mesenchymal transfor-mation, syncytialization necessitates repression of epithelial junctional proteins such as E-cadherin. In line with our study, differentiation of mouse trophoblast stem cells into (predominantly) trophoblast giant cells is asso-ciated with decreased acetylation of H2AK5, H2BK5, H2BK12, H2BK15, H2BK20, H3K9, and H4K8, as well as loss of E-cadherin36. Thus, histone deacetylation may be a conserved feature of trophoblast differentiation.
Since HDACs catalyze histone deacetylation, we next sought to determine the importance of HDAC activity for syncytialization. We found that the pan-HDAC inhibitors TSA and SAHA, and the selective HDAC1/HDAC2 inhibitor FK228, all robustly inhibited cytotrophoblast differentiation, implicating HDAC1/HDAC2 activity as a critical determinant of syncytiotrophoblast development. HDAC1 and HDAC2 exhibit 86% amino acid sequence identity, and are recruited to appropriate sites by binding to transcription factors as homodimers or heterodimers, or being part of multi-component complexes37–39. Their ubiquitous expression, incorporation into similar recruitment complexes, deacetylase activity toward com-mon substrates, and high homology all suggest that HDAC1 and HDAC2 are largely redundant and can compensate for a functional loss of the other. Indeed, mice exhibiting tissue-specific inactivation of Hdac1 or Hdac2 in epidermis17, B cells40, T cells41, cardiomyo-cytes31, endothelial cells42, neuronal precursors43, neural crest44, smooth muscle45, and oligodendrocytes46, all do not exhibit an obvious phenotypic defect, whereas loss of both Hdac1 and Hdac2 results in severe phenotypes in
these tissues47. However, in mice, global deletion of Hdac1 results in embryonic lethality at midgestation48, which is an effect not observed in mice lacking Hdac2, indicating that HDAC1 and HDAC2 exhibit at least some distinct biological functions. In the current study, we found that cytotrophoblasts expressed HDAC1 and HDAC2, and that knockdown of either HDAC1 or HDAC2 did not impact syncytiotrophoblast formation. Interestingly, in cells with reduced HDAC1 or HDAC2, we observed increased expression of the paralogous protein, which is consistent with results in other studies40,49,50. However, inhibition of both HDAC1 and HDAC2 using FK228, or knockdown of both HDAC1 and HDAC2, inhibited cytotrophoblast differentiation, suggesting that HDAC1 and HDAC2 can compensate for each other during syncytiotrophoblast development.
In this study, we used three human cytotrophoblast models to assess acetylation patterns during the pro-gression of syncytialization: primary cytotrophoblast cells isolated from term placentas, human trophoblast stem cells derived originally from first trimester placentas25, and BeWo trophoblasts. All three models of differentiat-ing trophoblasts showed reduced histone acetylation at multiple lysine residues during the progression of syncy-tialization. Of note, experiments investigating the role of HDAC inhibition on syncytiotrophoblast development were performed primarily using BeWo trophoblasts, since isolated cytotrophoblasts harbor very few cycling cells and spontaneously initiate differentiation shortly following isolation, and culture conditions to maintain human tro-phoblast stem cells in an undifferentiated state require the use of the HDAC inhibitor, valproic acid. Although BeWo trophoblasts are a transformed line with certain limita-tions, they do possess the capacity to rapidly transition from a proliferative state to a differentiated state on sti-mulus, and exhibit gene expression changes, fusion, and hormone production reminiscent of the switch between cytotrophoblasts and fused syncytiotrophoblast in vivo. These cells are thus an advantageous tool for investigating molecular mechanisms associated with the conversion between cytotrophoblast proliferation and differentiation. Collectively, ourfindings indicate that histone deacetyla-tion is likely a transient necessity for syncytializadeacetyla-tion, and is consistent with our in situ evidence that histone acet-ylation is apparent in a subset of syncytiotrophoblast nuclei.
In conclusion, we identified dynamic global and site-specific changes in AcH3 levels at key chromosomal regions during cytotrophoblast differentiation, which reveals new insights into regulatory mechanisms of gene expression changes during syncytiotrophoblast formation. It will be interesting to investigate these chromosomal regions, and genes located near these sites, for putative roles in syncytiotrophoblast development and function.
It will also be interesting to uncover the role of histone deacetylation and HDAC1/HDAC2 activity in the reg-ulation of extravillous trophoblast lineage development, and investigate the possibility of proteins other than his-tones whose activity is impacted by (de)acetylation. Our results caution against the use of HDAC inhibitors as front-line therapies in pregnant women diagnosed with cancer due to possible effects on placental function, and highlight the possibility of using clinically approved HDAC inhibitors in specific obstetric pathologies char-acterized by aberrant cytotrophoblast differentiation.
Materials and methods Collection of human placentae
Placental tissues were obtained with written informed consent from patients undergoing elective termination of pregnancy (first trimester placenta samples) or elective cesarean section (term placenta samples) at London Health Sciences Centre (London, ON, Canada) following approval by the Research Ethics Boards at the University of Western Ontario and London Health Sciences Centre. Paraffin-embedded sections and flash-frozen samples of gestational age 6-week and 39-week human placenta were obtained from the Research Centre for Women’s and Infant’s Health Biobank (RCWIH, Mount Sinai Hospital, Toronto, ON, Canada, http://biobank.lunenfeld.ca), fol-lowing appropriate consent, under protocols approved by Mount Sinai Hospital and the University of Western Ontario research ethics boards.
Isolation of primary cytotrophoblast cells
Isolation of primary cytotrophoblast cells from term placenta was conducted according to the protocol by Kliman et al.51, with modifications. Briefly, villous tissue was thoroughly washed with phosphate buffered saline (PBS), scraped using a glass slide, and minced. Minced villous tissue was then digested in digestion buffer (Hank’s Balanced Salt Solution supplemented with 1 M HEPES, 7.5% sodium bicarbonate, 2.5% trypsin, and 150 kU deoxyribonuclease I, Sigma-Aldrich, Oakville, ON, Canada) at 37 °C for 30 min on a magnetic stirrer. Sus-pended cells were collected and immersed in fetal bovine serum (FBS, ThermoFisher Scientific, Mississauga, ON, Canada) to inhibit enzymatic activity. The remaining tis-sue was subjected to two additional 30 min cycles of enzymatic digestion. Cell suspensions were filtered through a 100μm strainer to remove contaminating tissue debris, and then centrifuged at 1000 × g for 10 min. Cell pellets were resuspended in DMEM-F12 medium sup-plemented with 10% FBS, layered on top of a preformed Percoll gradient (consisting of dilutions of Percoll from 70 to 5%) and centrifuged at 1200 × g for 20 min without braking. The layer between 45 and 35% Percoll (con-taining cytotrophoblast cells) was collected, suspended in
DMEM-F12 medium and centrifuged at 350 × g for 10 min. To remove residual non-cytotrophoblast cells, 107 cells were resuspended in 100μl MACS separation buffer, and incubated with 10μl of phycoerythrin-conjugated anti-human leukocyte antigen-ABC antibody (catalog 130-120-431, Miltenyi Biotec, Auburn, CA) for 10 min at 4 °C. After washing, cells were resuspended in 80μl buffer and incubated with 20μl of anti-phycoerythrin-coated microbeads for 15 min at 4 °C. Cell pellets were washed and resuspended in 500μl buffer. Cells expressing human leukocyte antigen-ABC (non-cytotrophoblast cells) were positively selected using a magnetic separation column and a MiniMACSTM separator (Miltenyi Biotec). The remaining cells that passed through the column were counted, and cell viability was determined by trypan blue exclusion. We consistently achieved >90% viable cyto-trophoblasts using this method. 2 × 10⁵cytotrophoblasts/ cm2were cultured at 37 °C, 5% CO2in DMEM-F12 media
supplemented with 10% FBS, 100 units/ml penicillin, and 100μM streptomycin (Sigma-Aldrich) for up to 72 h, during which time cells spontaneously formed syncytiotrophoblast.
Culture of cell lines
Human trophoblast stem cells, derived from human 6-week placenta25, were maintained in DMEM-F12 media. Cells were passaged by using TrypLE (Thermo-Fisher Scientific) prior to reaching confluency and were maintained at 37 °C in an atmosphere consisting of 5% CO2for no more than twenty sequential passages. Human
trophoblast stem cells were maintained in a stem state, or induced to differentiate into syncytiotrophoblast for up to 5 days, using culture conditions described previously25.
BeWo trophoblasts are a well-characterized trans-formed human trophoblast cell line that exhibit cyto-trophoblast characteristics52. BeWo cells were obtained from American Type Culture Collection (CCL-98, Man-assas, VA), and were routinely tested by short tandem repeat profiling and for mycoplasma to authenticate cells and ensure consistency across passages. Cells were maintained at 37 °C, 5% CO2 in DMEM-F12 media
sup-plemented with 10% FBS, 100 units/ml penicillin, and 100μM streptomycin (Sigma-Aldrich). Differentiation of BeWo trophoblasts into syncytiotrophoblast was induced by exposing cells to a brominated, cell permeable deri-vative of cAMP, 8-Br-cAMP (Sigma-Aldrich, 250μM) for up to 48 h, as we have done previously53.
Human embryonic kidney (HEK)-293T cells were obtained from American Type Culture Collection (CRL-3216). HEK-293T cells were maintained in DMEM sup-plemented with 10% FBS, 100 units/ml penicillin, and 100μM streptomycin. Cells were passaged by light tryp-sinization prior to reaching confluency and were main-tained at 37 °C with 5% CO2.
Immunohistochemistry
Serial sections of human placental tissue were depar-affinized in Histoclear, and rehydrated using increasing dilutions of ethanol washes. Formaldehyde crosslinks were fragmented by placing slides in Reveal Decloaker (Biocare Medical, Pacheco, CA) at 95 °C for 20 min. Sec-tions were then permeabilized using PBS containing 1% bovine serum albumin and 0.3% Triton-X, and non-specific antibody binding was reduced by immersing slides in 10% normal goat serum (ThermoFisher Scien-tific). Sections were immersed in primary antibodies specific for AcH2BK5 (1:100, catalog 2574), AcH3K9 (1:800, catalog 9649), AcH3K27 (1:100, catalog 8173), AcH3K14 (1:400, catalog 7627), AcH3K18 (1:100, catalog 13998), CGB (1:100, catalog PA5-58598, ThermoFisher Scientific), and TEAD4 (1:50, catalog HPA056896, Sigma-Aldrich) overnight at 4 °C. Unless indicated otherwise, all antibodies were obtained from Cell Signaling Technology (Danvers, MA). The next day, sections were incubated for 1 h with species-appropriatefluorescent-conjugated anti-bodies (Alexa Fluor, ThermoFisher Scientific), and then incubated with 4′6-diamidino-2-phenylindole (DAPI, ThermoFisher Scientific) to detect nuclei. Slides were mounted using Fluoromount G (SouthernBiotech, Bir-mingham, AL) and imaged using a Nikon ECLIPSE Ni series microscope equipped with a Ds-Qi2 camera.
Western blotting
Evaluation of protein expression was determined by western blotting. Cell lysates were prepared using radio-immunoprecipitation assay buffer (RIPA: 50 mM Tris, 150 mM NaCl, 1% NP-40, 0.5% sodium deoxycholate, 0.1% sodium dodecyl sulfate (SDS)). Approximately 50μg of cell lysate was mixed with 4× reducing loading buffer (0.25 M Tris, 8% SDS, 30% glycerol, 0.02% bromophenol blue, 0.3 M dithiothreitol), boiled for 5 min, and subjected to SDS-polyacrylamide gel electrophoresis. Proteins were transferred to polyvinylidene difluoride membranes, blocked in tris buffered saline containing 3% bovine serum albumin and 0.5% Tween-20, and probed overnight at 4 °C using antibodies for AcH2BK5 (1:1000), AcH3K9 (1:1000), AcH3K27 (1:1000), AcH3K14 (1:1000), AcH3K18 (1:1000), acetylated H3 (1:10000, catalog 06-599, Sigma-Aldrich), total H3 (1:1000, catalog 499, Cell Signaling Technology), HDAC1 (1:1000, catalog 5356, Cell Signaling Technology), HDAC2 (1:1000, catalog 5113, Cell Signaling Technology), CGB (1:2000), E-cadherin (1:1000, catalog 14472, Cell Signaling Technol-ogy), and β-actin (1:4000, catalog sc47778, Santa Cruz Biotechnology, Santa Cruz, CA). Except where indicated, the antibodies used for western blotting are the same as those used for immunohistochemistry. All primary anti-bodies were diluted in tris buffered saline containing 0.5% Tween-20 and 3% bovine serum albumin. Membranes
were then washed, incubated for 1 h with species-appropriate infrared-conjugated secondary antibodies (Cell Signaling Technology), and signals detected using a LI-COR Odyssey imaging system (LI-COR Biosciences, Lincoln, NE). Densitometric analysis of signal intensity was conducted using ImageJ (version 1.52a)54.
Immunofluorescence
Cells were fixed with 4% paraformaldehyde and then permeabilized using PBS containing 0.3% Triton-X and 1% bovine serum albumin. Nonspecific antibody binding was blocked by immersing cells in 10% normal goat serum (ThermoFisher Scientific), and then cells were probed with mouse primary antibody specific for human E-cadherin (1:50, catalog 14472, Cell Signaling Technology) or rabbit primary antibody specific for cytokeratin 7 (1:100, catalog PA5-86169, ThermoFisher Scientific) overnight at 4°C. The next day, cells were incubated with Alexa Fluor 555 anti-mouse or anti-rabbit secondary antibodies for cells incubated with E-cadherin and cyto-keratin 7, respectively. Cells that were previously immersed in the antibody targeting E-cadherin were then incubated with rabbit anti-human CGB (1:1000), followed by Alexa Fluor 488-conjugated anti-rabbit secondary antibody. Nuclei were then counterstained using DAPI. Images were captured using a Zeiss Axio fluorescence microscope. For quantification of trophoblast fusion, images were taken from three randomly selectedfields per well in triplicate at ×20 magnification. The percent fusion was calculated by counting the total number of nuclei contained within fused cells (E-cadherin negative, CGB-positive) divided by the total number of nuclei. Cell counting was conducted using an in-house cell counting program designed in MATLAB.
RT-PCR
RNA was extracted using Ribozol (VWR International, Mississauga, ON, Canada), according to the manu-facturer’s instructions. RNA was converted into cDNA using reverse transcription (High Capacity cDNA kit, ThermoFisher Scientific), which was then diluted 1:10. Conventional PCR was conducted using primers descri-bed in Table2, and DreamTaq DNA Polymerase (Ther-moFisher Scientific) to amplify cDNA. Cycling conditions involved an initial holding step (95 °C for 3 min), followed by 33 cycles of PCR (95 °C for 30 s, 55–63 °C for 30 s, and 72 °C for 30 s), and a final elongation phase at 72 °C for 12 min. PCR products were resolved on 2% agarose gels and imaged using a ChemiDoc imaging system (Bio-Rad Laboratories, Mississauga, ON, Canada). Quantitative PCR was performed by amplifying cDNA using Sensifast SYBR Green PCR Master Mix (FroggaBio, Toronto, ON, Canada) and primers shown in Table2. A CFX96 Connect real-time PCR detection system (Bio-Rad Laboratories)
was used to detect fluorescence. Cycling conditions involved an initial holding step (95 °C for 10 min). Fol-lowing this step, 40 cycles of two step PCR (95 °C for 15 s and 60 °C for 1 min) and a dissociation phase were per-formed. Relative mRNA expression was calculated using the ΔΔCt method55. The geometric mean from three constitutively expressed reference genes (RNA18SN1, EEF2, YWHAZ) was used as reference RNA.
Chromatin immunoprecipitation sequencing
Chromatin immunoprecipitation was performed as previously described53. Briefly, cells cultured under con-trol and differentiated conditions were fixed with 0.7% formaldehyde for 10 min, and purified nuclear lysates were sonicated using a Bioruptor (Diagenode, Denville, NJ) to prepare DNA fragments at a size of ~200–400 bp. Approximately 1% of sonicated nuclear lysate was removed to serve as an input control. Half of the remaining lysate was incubated with AcH3 antibody (5μg,
Sigma-Aldrich catalog 06-599) overnight at 4 °C. The other half was incubated with rabbit IgG (5μg, catalog 2729, Cell Signaling Technology) overnight at 4°C to serve as a nonspecific binding control. The next day, immu-noprecipitated chromatin fragments were captured using protein G-conjugated Sepharose beads (Sigma-Aldrich). Eluted and purified DNA fragments were amplified using DreamTaq DNA polymerase (ThermoFisher Scientific) and primers described in Table 2, or analyzed using an Agilent Bioanalyzer (Agilent Technologies, Santa Clara, CA), quantified using Qubit, and libraries generated using a NEBNext Ultra II DNA Library Prep Kit (New England Biolabs, Whitby, ON, Canada). Libraries were sequenced on an Illumina (San Diego, CA) NextSeq High Output at the London Regional Genomics Facility using 75-bp single end reads, which generated at least 42 million reads per sample.
Raw reads were trimmed with the TrimGalore wrapper script around the sequence-grooming tool cutadapt
Table 2 List of primers used for RT-PCR and chromatin immunoprecipitation (ChIP).
Gene Forward Reverse Accession No.
CGB CCTGGCCTTGTCTACCTCTT GGCTTTATACCTCGGGGTTG NM_000737.3
ChIP-HSD11B2 GGGACTGGACACTCAACAGG AGAACTCTCCCACTCTTGCG NC_000016.10
ChIP-OVOL1 CCACCCTCACCTGTGTTTGA GGCTCAGCTCACCTTTACCA NC_000011.10
EEF2 AGGCGTAGAACCGACCTTTG GACAGCGAGGACAAGGACAA NM_001961.4
ERVV1 TAACAGTGGGGCGATAGAGG AGACTTCACAGCCTCCCAAA NM_152473.2
ERVV2 CAGGCACAGTGGAATGAAAA GACCTGGTGATGAAGTTGTGG NM_001191055.2
ERVFRD-1 CCAAATTCCCTCCTCTCCTC CGGGTGTTAGTTTGCTTGGT NM_207582.3
ERVW1 CTACCCCAACTGCGGTTAAA GGTTCCTTTGGCAGTATCCA NM_001130925.2
HDAC1 TCGATCTGCTCCTCTGACAA GCTTCTGGCTTCTCCTCCTT NM_004964.3
HDAC10 ATGGCCAGGGGATCCAGTAT TTTGCCCCTCAAAGGCCAGT NM_001159286.2
HDAC2 TGTGCCTCAGTTGCTTCATC GATGCAGTGAGCCAAGATCA NM_001527.4
HDAC3 GGAGCTGGACACCCTATGAA GACTCTTGGTGAAGCCTTGC NM_001355039.2
HDAC4 CAAGCACCCCTCGTCACAG GCCTCTTCCTCATCGCTCTC NM_006037.3
HDAC5 AGCAAAAGCCCAACATCAAC AACTTCTGCACACAGCTCCA NM_001015053.2
HDAC6 AGGTCGCCAGAAACTTGGTG TGGGGGTTCTGCCTACTTCT NM_001321225.2
HDAC7 CTCTCGCCGTCTCACAGTC TCGCTTGCTCTTGTCCTTGT NM_001098416.4
HDAC8 AAGCAGATGAGAGATGAAGCA TGCCAATTCCCACTGGAGTC NM_001166418.2
HDAC9 CCTTTTTGCTTCTGCCTCACC CAGCCACAGAATAGCACCCA NM_001204144.3
HSD11B2 CAGATGGACCTGACCAAACC AGCTCCGCATCAGCAACTAC NM_000196.4
OVOL1 CCGTGCGTCTCCACGTGCAA GGCTGTGGTGGGCAGAAGCC NM_004561.4
RNA18SN1 GCAATTATTCCCCATGAACG GGCCTCACTAAACCATCCAA NR_145820.1
TEAD4 CAGTATGAGAGCCCCGAGAA TGCTTGAGCTTGTGGATGAA NM_003213.4
TP63 CAGATGGACCTGACCAAACC AGCTCCGCATCAGCAACTAC NM_001114978.2
YWHAZ ATGCAACCAACACATCCTATC GCATTATTAGCGTGCTGTCTT NM_001135699.1
version 0.4.1 with the following quality trimming and filtering parameters56
. The trimmed reads were mapped onto the hg19 reference genome downloaded from UCSC genome browser57, using HISAT2 version 2.0.4 (‘–no-spliced-alignment’)58
. SAMtools (http://samtools. sourceforge.net/) was then used to convert SAM files and index BAMfiles. BigWig coverage tracks were gen-erated using deepTools2 from the aligned reads59. The coverage was calculated as the number of reads per 50 bp bin and normalized by 1× sequencing depth (effective hg19 genome size= 2,509,729,011).
A sliding window approach implemented in the csaw R/ Bioconductor package was used to identify regions enri-ched in AcH360. In brief, reads outside of blacklist regions (https://github.com/Boyle-Lab/Blacklist) with mapq≥ 20 were counted inside 200-bp sliding windows. Global background was estimated by counting reads within contiguous 2000-bp bins across the genome. Windows werefiltered out if the fold enrichment was below log2(3)
compared with background. Filtered windows less than 100 bp apart were merged and a maximum region size of 5000 bp was permitted, conferring a total of 49,648 regions. We performed differential binding analysis of count data within these regions using DESeq2 R/Bio-conductor package61, and used the independent hypoth-esis weighting R/Bioconductor package to weight P-values and adjust for multiple testing62,63. Raw and processed data is deposited in NCBI’s Gene Expression Omnibus (GSE141867)64.
Treatment of trophoblasts with HDAC small molecule inhibitors
BeWo trophoblasts were pretreated with pan and spe-cific HDAC inhibitors. After 2 h of HDAC inhibitor treatment, the cells were induced to differentiate by treating with 250μM 8-Br-cAMP. The doses and speci-ficity of the inhibitors used in this study are detailed in Table1. All inhibitors were dissolved initially in dimethyl sulfoxide (DMSO) except TSA, which was dissolved initially in ethanol. Thus, additional controls were inclu-ded in which cells were exposed to either 0.1% DMSO or 0.005% ethanol (the highest concentrations of vehicle in which cells were exposed during experiments). For all inhibitors, there was no obvious effect on cell viability at the doses used, nor did the vehicle in which the inhibitors were dissolved affect cytotrophoblast viability or differentiation.
Lentivirus production and shRNA-mediated gene knockdown
Two-distinct HDAC1 and HDAC2 knockdown shRNA constructs encoded in PLKO.1 vectors were obtained from Sigma-Aldrich (HDAC1-KD1: CCTAATGAGCTT CCATACAAT, HDAC1-KD2: CGGTTAGGTTGCTTC
AATCTA, HDAC2-KD1: CAGTCTCACCAATTTCAG AAA, HDAC2-KD2: CAGACTGATATGGCTGTTAAT). Control shRNA (scrambled) constructs that do not target any known mammalian genes were obtained from Addgene (plasmid 1864, Cambridge, MA). To establish HDAC1/HDAC2 DKD, the puromycin resistance cas-settes encoded within the shHDAC1-KD1 and Control PLKO.1 vectors were replaced with a cassette encoding blasticidin resistance. Lentiviral plasmids (MD2.G, MDLG/RRE, and RSV-Rev) were used to produce lenti-virus, as previously described65. HEK293T cells were transfected using Lipofectamine 2000 (ThermoFisher Scientific) in Opti-MEM medium (ThermoFisher Scien-tific) with the shRNA containing vectors and packaging plasmids. Culture supernatants containing lentivirus were collected every 24 h for a total of 48 h, centrifuged, and stored at−80 °C until use.
Human BeWo trophoblasts were exposed to lentiviral particles for 48 h in the presence of hexadimethrine bro-mide (8μg/ml, Sigma-Aldrich) diluted in normal growth medium. After 48 h, transduced cells were selected using puromycin (3.5μg/ml, ThermoFisher Scientific) or blas-ticidin (2.5μg/ml, ThermoFisher Scientific) for at least 48 h. A negative control well containing cells that were not exposed to virus was used to ensure efficient transduction.
Enzyme immunoassay
The concentration of CGB in supernatants of primary cytotrophoblasts was measured by an enzyme immu-noassay (catalog DY9034-05, R&D Systems, Minneapolis, MN), using a protocol provided by the manufacturer. Briefly, conditioned media were collected from tropho-blast cultures, centrifuged to remove debris, and super-natants added to a microplate precoated with a monoclonal antibody specific to CGB. After washing, a biotinylated rabbit anti-human CGB antibody was added, followed by streptavidin conjugated to horseradish per-oxidase. Excess solution was washed, and the peroxidase substrate 3,3′,5,5′-tetramethylbenzidine was added to the microplate to generate a colorimetric reaction. The reaction was stopped by adding 2 N H2SO4, and
absor-bance was measured in a spectrophotometer at 450 nm. To calculate the concentration of CGB in trophoblast supernatants, absorbance was compared with a standard curve, generated by graphing absorbance values relative to known CGB concentrations.
Statistical analysis
For isolation of primary cytotrophoblasts, four different placentas were used. All placentas were deemed to be from uncomplicated pregnancies, and there were no major differences in the number or quality of cyto-trophoblasts from each placenta. For chromatin
immunoprecipitation-sequencing experiments, immuno-precipitated DNA from three independent replicates of undifferentiated cells and three independent replicates of differentiated cells were used. Inputs from undiffer-entiated and differundiffer-entiated cells from each experiment were combined prior to sequencing. All other experi-ments were repeated at least three independent times. Variance was similar between groups being statistically compared. Statistical comparisons for densitometry ana-lyses were tested using one sample t-test, all other com-parisons were tested using analysis of variance, followed by Tukey’s post-hoc test. Means were considered statis-tically different if P < 0.05. GraphPad Prism 6.0 and MATLAB were used for all graphing and statistical ana-lyses. All graphs represent means ± SEM.
Acknowledgements
We wish to thank the donors, RCWIH BioBank, Lunenfeld-Tanenbaum Research Institute, Mount Sinai Hospital Department of Obstetrics and Gynecology for placental sections. We also thank Laura McMurphy in the Department of Obstetrics and Gynecology at the University of Western Ontario for help with collecting placentas in which cytotrophoblasts were isolated. Experiments in this study were supported, in part, by the Natural Sciences and Engineering Research Council of Canada (5053) awarded to SJR, and Canadian Institutes of Health Research to N.G.B. (MOP142369; ChIP-Seq analysis) and S.J.R. (386134, 376512). G.J.B. is supported by a fellowship from the Children’s Health Research Institute. M.J.J. was supported by fellowships from Children’s Health Research Institute and NSERC Alexander Graham Bell Canada Graduate Scholarship. We also wish to thank Srikanth Bhattad for assistance designing programs using MATLAB.
Author details
1Department of Anatomy and Cell Biology, Schulich School of Medicine and
Dentistry, University of Western Ontario, London, ON, Canada.2Department of
Pediatrics, Schulich School of Medicine and Dentistry, University of Western Ontario, London, ON, Canada.3PERFORM Centre, Concordia University,
Montréal, QC, Canada.4Department of Informative Genetics, Environment and Genome Research Center, Tohoku University Graduate School of Medicine, Sendai, Japan.5Department of Oncology, Schulich School of Medicine and Dentistry, University of Western Ontario, London, ON, Canada.6Children’s
Health Research Institute, Lawson Health Research Institute, London, ON, Canada
Conflict of interest
The authors declare that they have no conflict of interest.
Publisher’s note
Springer Nature remains neutral with regard to jurisdictional claims in published maps and institutional affiliations.
Supplementary Information accompanies this paper at (https://doi.org/ 10.1038/s41419-020-2500-6).
Received: 15 November 2019 Revised: 14 April 2020 Accepted: 15 April 2020
References
1. Aguilar, P. S. et al. Genetic basis of cell-cell fusion mechanisms. Trends Genet. 29, 427–437 (2013).
2. Bastida-Ruiz, D., Van Hoesen, K. & Cohen, M. The dark side of cell fusion. Int. J. Mol. Sci. 17,https://doi.org/10.3390/ijms17050638(2016).
3. Benirschke, K., Burton, G. J. & Baergen, R. N. In Pathology of the Human Placenta 249–307 (Springer Berlin Heidelberg, 2012).
4. Simpson, R. A., Mayhew, T. M. & Barnes, P. R. From 13 weeks to term, the trophoblast of human placenta grows by the continuous recruitment of new proliferative units: a study of nuclear number using the disector. Placenta 13, 501–512 (1992).
5. Fitzgerald, B. et al. Villous trophoblast abnormalities in extremely preterm deliveries with elevated second trimester maternal serum hCG or inhibin-A. Placenta 32, 339–345 (2011).
6. Gauster, M., Moser, G., Orendi, K. & Huppertz, B. Factors involved in regulating trophoblast fusion: potential role in the development of preeclampsia. Pla-centa 30(Suppl A), S49–S54 (2009).
7. Ishihara, N. et al. Increased apoptosis in the syncytiotrophoblast in human term placentas complicated by either preeclampsia or intrauterine growth retardation. Am. J. Obstet. Gynecol. 186, 158–166 (2002).
8. Huppertz, B. et al. Apoptosis cascade progresses during turnover of human trophoblast: analysis of villous cytotrophoblast and syncytial fragments in vitro. Lab. Invest. 79, 1687–1702 (1999).
9. Huppertz, B. et al. Hypoxia favours necrotic versus apoptotic shedding of placental syncytiotrophoblast into the maternal circulation. Placenta 24, 181–190 (2003).
10. Ellery, P. M., Cindrova-Davies, T., Jauniaux, E., Ferguson-Smith, A. C. & Burton, G. J. Evidence for transcriptional activity in the syncytiotrophoblast of the human placenta. Placenta 30, 329–334 (2009).
11. Görisch, S. M., Wachsmuth, M., Tóth, K. F., Lichter, P. & Rippe, K. Histone acetylation increases chromatin accessibility. J. Cell Sci. 118, 5825–5834 (2005). 12. Gallinari, P., Di Marco, S., Jones, P., Pallaoro, M. & Steinkühler, C. HDACs, histone deacetylation and gene transcription: from molecular biology to cancer therapeutics. Cell Res. 17, 195–211 (2007).
13. Wang, Z. et al. Genome-wide mapping of HATs and HDACs reveals distinct functions in active and inactive genes. Cell 138, 1019–1031 (2009). 14. de Ruijter, A. J. M., van Gennip, A. H., Caron, H. N., Kemp, S. & van Kuilenburg, A.
B. P. Histone deacetylases (HDACs): characterization of the classical HDAC family. Biochem. J. 370, 737–749 (2003).
15. Fischle, W. et al. A new family of human histone deacetylases related to Saccharomyces cerevisiae HDA1p. J. Biol. Chem. 274, 11713–11720 (1999). 16. Lehrmann, H., Pritchard, L. L. & Harel-Bellan, A. Histone acetyltransferases and
deacetylases in the control of cell proliferation and differentiation. Adv. Cancer Res. 86, 41–65 (2002).
17. LeBoeuf, M. et al. Hdac1 and Hdac2 act redundantly to control p63 and p53 functions in epidermal progenitor cells. Dev. Cell 19, 807–818 (2010). 18. Lee, J.-H., Hart, S. R. L. & Skalnik, D. G. Histone deacetylase activity is required for
embryonic stem cell differentiation. Genesis 38, 32–38 (2004).
19. Kidder, B. L. & Palmer, S. HDAC1 regulates pluripotency and lineage specific transcriptional networks in embryonic and trophoblast stem cells. Nucleic Acids Res. 40, 2925–2939 (2012).
20. Maltepe, E. et al. Hypoxia-inducible factor-dependent histone deacetylase activity determines stem cell fate in the placenta. Development 132, 3393–3403 (2005).
21. Pan, Z. et al. Impaired placental trophoblast lineage differentiation in Alkbh1 (-/-) mice. Dev. Dyn. 237, 316–327 (2008).
22. Arul Nambi Rajan, K. et al. Sirtuin1 is required for proper trophoblast differ-entiation and placental development in mice. Placenta 62, 1–8 (2018). 23. Duan, H. et al. HDAC2 was involved in placental P-glycoprotein regulation
both in vitro and vivo. Placenta 58, 105–114 (2017).
24. Togher, K. L., Kenny, L. C. & O’Keeffe, G. W. Class-specific histone deacetylase inhibitors promote 11-beta hydroxysteroid dehydrogenase type 2 expression in JEG-3 cells. Int. J. Cell Biol. 2017, 6169310 (2017).
25. Okae, H. et al. Derivation of human trophoblast stem cells. Cell Stem Cell 22, 50–63.e6 (2018).
26. Kwak, Y.-T., Muralimanoharan, S., Gogate, A. A. & Mendelson, C. R. Human trophoblast differentiation is associated with profound gene regulatory and epigenetic changes. Endocrinology 160, 2189–2203 (2019).
27. Than, N. G. et al. Evolutionary origins of the placental expression of chro-mosome 19 cluster galectins and their complex dysregulation in pre-eclampsia. Placenta 35, 855–865 (2014).
28. Lo, H.-F. et al. Association of dysfunctional synapse defective 1 (SYDE1) with restricted fetal growth - SYDE1 regulates placental cell migration and invasion. J. Pathol. 241, 324–336 (2017).
29. Tian, G. et al. Expression and function of the LIM homeobox containing genes Lhx3 and Lhx4 in the mouse placenta. Dev. Dyn. 237, 1517–1525 (2008).
30. Jurkin, J. et al. Distinct and redundant functions of histone deacetylases HDAC1 and HDAC2 in proliferation and tumorigenesis. Cell Cycle 10, 406–412 (2011).
31. Montgomery, R. L. et al. Histone deacetylases 1 and 2 redundantly regulate cardiac morphogenesis, growth, and contractility. Genes Dev. 21, 1790–1802 (2007).
32. Baines, K. J. & Renaud, S. J. Transcription factors that regulate trophoblast development and function. Prog. Mol. Biol. Transl. Sci. 145, 39–88 (2017). 33. Nieto, M. A., Huang, R. Y.-J., Jackson, R. A. & Thiery, J. P. EMT: 2016. Cell 166,
21–45 (2016).
34. Voon, D. C., Huang, R. Y., Jackson, R. A. & Thiery, J. P. The EMT spectrum and therapeutic opportunities. Mol. Oncol. 11, 878–891 (2017).
35. Zeisberg, M. & Neilson, E. G. Biomarkers for epithelial-mesenchymal transitions. J. Clin. Invest 119, 1429–1437 (2009).
36. Abell, A. N. et al. MAP3K4/CBP-regulated H2B acetylation controls epithelial-mesenchymal transition in trophoblast stem cells. Cell Stem Cell 8, 525–537 (2011).
37. Denslow, S. A. & Wade, P. A. The human Mi-2/NuRD complex and gene regulation. Oncogene 26, 5433–5438 (2007).
38. Lee, M. G., Wynder, C., Cooch, N. & Shiekhattar, R. An essential role for CoREST in nucleosomal histone 3 lysine 4 demethylation. Nature 437, 432–435 (2005). 39. Silverstein, R. A. & Ekwall, K. Sin3: aflexible regulator of global gene expression
and genome stability. Curr. Genet. 47, 1–17 (2005).
40. Yamaguchi, T. et al. Histone deacetylases 1 and 2 act in concert to promote the G1-to-S progression. Genes Dev. 24, 455–469 (2010).
41. Dovey, O. M. et al. Histone deacetylase 1 and 2 are essential for normal T-cell development and genomic stability in mice. Blood 121, 1335–1344 (2013). 42. Thambyrajah, R. et al. HDAC1 and HDAC2 modulate TGF-β signaling during
endothelial-to-hematopoietic transition. Stem Cell Rep. 10, 1369–1383 (2018). 43. Montgomery, R. L., Hsieh, J., Barbosa, A. C., Richardson, J. A. & Olson, E. N. Histone deacetylases 1 and 2 control the progression of neural precursors to neurons during brain development. Proc. Natl Acad. Sci. USA 106, 7876–7881 (2009).
44. Jacob, C. et al. HDAC1 and HDAC2 control the specification of neural crest cells into peripheral glia. J. Neurosci. 34, 6112–6122 (2014).
45. Karolczak-Bayatti, M., Loughney, A. D., Robson, S. C. & Europe-Finner, G. N. Epigenetic modulation of the protein kinase A RIIα (PRKAR2A) gene by his-tone deacetylases 1 and 2 in human smooth muscle cells. J. Cell Mol. Med. 15, 94–108 (2011).
46. Ye, F. et al. HDAC1 and HDAC2 regulate oligodendrocyte differentiation by disrupting the beta-catenin-TCF interaction. Nat. Neurosci. 12, 829–838 (2009). 47. Jamaladdin, S. et al. Histone deacetylase (HDAC) 1 and 2 are essential for accurate cell division and the pluripotency of embryonic stem cells. Proc. Natl Acad. Sci. USA 111, 9840–9845 (2014).
48. Lagger, G. et al. Essential function of histone deacetylase 1 in proliferation control and CDK inhibitor repression. EMBO J. 21, 2672–2681 (2002). 49. Lin, C.-L. et al. HDAC1 and HDAC2 double knockout triggers cell apoptosis in
advanced thyroid cancer. Int. J. Mol. Sci. 20, https://doi.org/10.3390/ ijms20020454(2019).
50. Wilting, R. H. et al. Overlapping functions of Hdac1 and Hdac2 in cell cycle regulation and haematopoiesis. EMBO J. 29, 2586–2597 (2010).
51. Kliman, H. J., Nestler, J. E., Sermasi, E., Sanger, J. M. & Strauss, J. F. Purification, characterization, and in vitro differentiation of cytotrophoblasts from human term placentae. Endocrinology 118, 1567–1582 (1986).
52. Wice, B., Menton, D., Geuze, H. & Schwartz, A. L. Modulators of cyclic AMP metabolism induce syncytiotrophoblast formation in vitro. Exp. Cell Res. 186, 306–316 (1990).
53. Renaud, S. J. et al. OVO-like 1 regulates progenitor cell fate in human tro-phoblast development. Proc. Natl Acad. Sci. USA 112, E6175–E6184 (2015). 54. Schneider, C. A., Rasband, W. S. & Eliceiri, K. W. NIH Image to ImageJ: 25 years
of image analysis. Nat. Methods 9, 671–675 (2012).
55. Willems, E., Leyns, L. & Vandesompele, J. Standardization of real-time PCR gene expression data from independent biological replicates. Anal. Biochem. 379, 127–129 (2008).
56. Martin, M. Cutadapt removes adapter sequences from high-throughput sequencing reads. EMBnet J. 17, 10 (2011).
57. Haeussler, M. et al. The UCSC Genome Browser database: 2019 update. Nucleic Acids Res. 47, D853–D858 (2019).
58. Kim, D., Paggi, J. M., Park, C., Bennett, C. & Salzberg, S. L. Graph-based genome alignment and genotyping with HISAT2 and HISAT-genotype. Nat. Biotechnol. 37, 907–915 (2019).
59. Ramírez, F. et al. deepTools2: a next generation web server for deep-sequencing data analysis. Nucleic Acids Res. 44, W160–5 (2016).
60. Lun, A. T. L. & Smyth, G. K. csaw: a Bioconductor package for differential binding analysis of ChIP-seq data using sliding windows. Nucleic Acids Res. 44, e45 (2016).
61. Love, M. I., Huber, W. & Anders, S. Moderated estimation of fold change and dispersion for RNA-seq data with DESeq2. Genome Biol. 15, 550 (2014). 62. Benjamini, Y. & Hochberg, Y. Controlling the false discovery rate: A practical
and powerful approach to multiple testing. J. R. Stat. Soc.: Ser. B (Methodol.) 57, 289–300 (1995).
63. Ignatiadis, N., Klaus, B., Zaugg, J. B. & Huber, W. Data-driven hypothesis weighting increases detection power in genome-scale multiple testing. Nat. Methods 13, 577–580 (2016).
64. Barrett, T. et al. NCBI GEO: archive for functional genomics data sets–update. Nucleic Acids Res. 41, D991–5 (2013).
65. Renaud, S. J., Kubota, K., Rumi, M. A. K. & Soares, M. J. The FOS transcription factor family differentially controls trophoblast migration and invasion. J. Biol. Chem. 289, 5025–5039 (2014).
66. Boskovic, Z. V. et al. Inhibition of zinc-dependent histone deacetylases with a chemically triggered electrophile. ACS Chem. Biol. 11, 1844–1851 (2016). 67. Furumai, R. et al. FK228 (depsipeptide) as a natural prodrug that inhibits class I
histone deacetylases. Cancer Res. 62, 4916–4921 (2002).
68. Pavlik, C. M. et al. Santacruzamate A, a potent and selective histone deace-tylase inhibitor from the Panamanian marine cyanobacterium cf. Symploca sp. J. Nat. Prod. 76, 2026–2033 (2013).
69. Marek, L. et al. Histone deacetylase (HDAC) inhibitors with a novel connecting unit linker region reveal a selectivity profile for HDAC4 and HDAC5 with improved activity against chemoresistant cancer cells. J. Med. Chem. 56, 427–436 (2013).
70. Saito, A. et al. A synthetic inhibitor of histone deacetylase, MS-27-275, with marked in vivo antitumor activity against human tumors. Proc. Natl Acad. Sci. USA 96, 4592–4597 (1999).
71. Malvaez, M. et al. HDAC3-selective inhibitor enhances extinction of cocaine-seeking behavior in a persistent manner. Proc. Natl Acad. Sci. USA 110, 2647–2652 (2013).
72. Richon, V. M. et al. A class of hybrid polar inducers of transformed cell dif-ferentiation inhibits histone deacetylases. Proc. Natl Acad. Sci. USA 95, 3003–3007 (1998).
73. Vigushin, D. M. et al. Trichostatin A is a histone deacetylase inhibitor with potent antitumor activity against breast cancer in vivo. Clin. Cancer Res. 7, 971–976 (2001).