Japan Advanced Institute of Science and Technology
https://dspace.jaist.ac.jp/
Title
Mining multiple biological data for
reconstructing signal transduction networks
Author(s)
Nguyen, Thanh-Phuong; Ho, Tu-Bao
Citation
Issue Date
2012
Type
Book
Text version
author
URL
http://hdl.handle.net/10119/10335
Rights
This is the author-created version of Springer,
Thanh-Phuong Nguyen and Tu-Bao Ho, Data Mining:
Foundations and Intelligent Paradigms, 25, 2012,
pp.163-185. The original publication is available
at www.springerlink.com,
http://dx.doi.org/10.1007/978-3-642-23151-3_8
transduction networks
Thanh-Phuong Nguyen and Tu-Bao HoAbstract Signaling transduction networks (STNs) are the key means by which a cell converts an external signal (e.g. stimulus) into an appropriate cellular response (e.g. cellular rhythms of animals and plants). The essence of STN is underlain in some signaling features scattered in various data sources and biological components overlapping among STN. The integration of those signaling features presents a challenge. Most of previous works based on PPIs for STN did not take the signaling properties of signaling molecules and components overlapping among STN into account. This paper describes an effective computational method that can exploit three biological facts of STN applied to human: protein-protein interaction networks, sig-naling features and sharing components. To this end, we introduce a soft-clustering method for doing the task by exploiting integrated multiple data, especially signaling features, i.e., protein-protein interactions, signaling domains, domain-domain interactions, and protein functions. The gained results demonstrated that the method was promising to discover new STN and solve other related problems in computational and systems biology from large-scale protein interaction networks. Other interesting results of the early work on yeast STN are additionally presented to show the advantages of using signaling domain-domain interactions.
1 Introduction
The way how an organism can survive is the continually adjusting its internal state to changes in the environ-ment. To track environmental changes, the organism must communicate effectively with their surroundings. These may be in the form of chemicals, such as hormones or nutrients, or may take another form, such as light, heat, or sound. A signal itself rarely causes a simple, direct chemical change inside the cell. Instead, the signal is transduced through a multi-step chain, or changed in form. Signal transduction systems are especially important in multicellular organisms, because of the need to coordinate the activities of hundreds to trillions of cells [1]. Signal transduction network refers to the entire set of pathways and interactions by which environmental signals are received and responded to by single cells [53]. It is unsurprising that many components of these signal transduction circuits are oncogenes or tumour suppressors, emphasizing the importance of understanding signaling in normal tissues and targeting aberrant signaling in diseases [44].
Traditionally, the discovery of molecular components of signaling networks in yeast and mammals has relied upon the use of gene knockouts and epistasis analysis. Although these methods have been highly ef-Thanh-Phuong Nguyen
The Microsoft Research - University of Trento Centre for Computational and Systems Biology, Piazza Manci 17, 38123, Povo, Trento, Italy, e-mail:[email protected]
Tu-Bao Ho
School of Knowledge Science, Japan Advanced Institute of Science and Technology, 1-1 Asahidai, Nomi, Ishikawa 923-1292, Japan, e-mail:[email protected]
fective in generating detailed descriptions of specific linear signaling pathways, our knowledge of complex signaling networks and their interactions remains incomplete. New computational methods that capture molecular details from high-throughput genomic data in an automated fashion are desirable and can help direct the established techniques of molecular biology and genetics [6, 49].
Signal transduction networks (STN) are chiefly based on interactions between proteins, which are intrin-sic to almost all cellular functions and biological processes [23, 22, 12, 15]. The study of protein interactions is fundamental to understanding the complex mechanisms underlying signal transduction networks. Protein-protein interaction problem have attracted a lot of research for last ten years, both experimental methods [59, 28, 10, 54] and computational method as well [13, 38, 47, 29, 11, 17, 43]. In addition, the enormous amount of protein-protein interaction (PPI) data has been nowadays generated and published much more than ever [41, 37] such as DIP [51], MISP [45], i2d [14], MINP [16], BIND [3], STRING [39], etc. Hence, the PPI-based approach is greatly appealing for studying STN.
When exploring PPI data to reconstructing STN, we face two problems of complexity. The first one de-rives from the large number of molecules and multiple types of interactions between them. In addition to the size of the signaling machinery, a second layer of complexity inter-connectivity of signaling biochemistry is apparent from the fact that signaling proteins often contain multiple functional domains, thus enabling each to interact with numerous downstream targets [18]. Therefore, it has become emerging to develop effective data mining methodologies to extract, process, integrate and discover useful knowledge from the PPI net-work data accompanying with other proteomic and genomic data. These methodologies should be robust to manipulate the huge number of proteins involving in the STN and also flexible to combine other sig-naling features. The retrieved knowledge is expected to better understand the system behavior of sigsig-naling networks, and to predict higher order functions that can be validated by experiments.
The objective of this paper is to present the study of STN based on PPI. First, we briefly introduce some background of STN and PPI network. Then the work on combining multiple data to reconstruct human STN is described. In addition, we provide some results of Yeast STN reconstruction by using signaling features. The future work and the summarization are lastly given.
2 Background
In this section, we present some biological background of the signal transduction network and then the protein-protein interaction network.
2.1 Signal transduction network
Signal transduction networks are the key means for the communication between cells. Those networks consist of extracellular and intracellular signaling molecules. Some of extracellular ones operate over long distances, signaling to cells far away; others signal only to immediate neighbors. Most cells in multicellular organisms both emit and receive signals. Once receptor proteins bind the signal molecules, one or more in-tracellular signaling pathways are activated. These relay chains of molecules mainly inin-tracellular signaling proteins process the signal inside the receiving cell and distribute it to the appropriate intracellular targets. These targets are generally effector proteins, which are altered when the signaling pathway is activated and implement the appropriate change of cell behavior. Depending on the signal and the nature and state of the receiving cell, these effectors can be gene regulatory proteins, ion channels, components of a metabolic pathway, or parts of the cytoskeleton among other things [1]. An simple example of an intracellular signal-ing pathway is depicted in Figure 1. Because of the wide-range of function, signal transduction networks play a pivotal role in almost of fundamental cellular processes including cell proliferation, metabolism, differentiation, and survival [37].
process, called quorum sensing, allows bacteria to coordinate their behavior, including their motility, antibiotic production, spore formation, and sexual con-jugation.
Similarly, yeast cells communicate with one another in preparation for mat-ing. The budding yeast Saccharomyces cerevisiae provides a well-studied exam-ple: when a haploid individual is ready to mate, it secretes a peptide mating fac-tor that signals cells of the opposite mating type to stop proliferating and pre-pare to mate (Figure 15–2). The subsequent fusion of two haploid cells of oppo-site mating type produces a diploid cell, which can then undergo meiosis and sporulate, generating haploid cells with new assortments of genes (see Figure 21–3B). The reshuffling of genes through sexual reproduction helps a species survive in an unpredictably variable environment (as discussed in Chapter 21).
Studies of yeast mutants that are unable to mate have identified many pro-teins that are required in the signaling process. These propro-teins form a signaling network that includes cell-surface receptor proteins, GTP-binding proteins, and protein kinases, and each of these categories has close relatives among the recep-tors and intracellular signaling proteins in animal cells. Through gene duplication and divergence, however, the signaling systems in animals have become much more elaborate than those in yeasts; the human genome, for example, contains more than 1500 genes that encode receptor proteins, and the number of different receptor proteins is further increased by alternative RNA splicing and post-trans-lational modifications.
The large numbers of signal proteins, receptors, and intracellular signaling proteins used by animals can be grouped into a much smaller number of protein families, most of which have been highly conserved in evolution. Flies, worms, and mammals all use essentially similar machinery for cell communication, and many of the key components and signaling pathways were first discovered through analysis of mutations in Drosophila and C. elegans.
Extracellular Signal Molecules Bind to Specific Receptors
Cells in multicellular animals communicate by means of hundreds of kinds of signal molecules. These include proteins, small peptides, amino acids,
Figure 15–1 A simple intracellular signaling pathway activated by an extracellular signal molecule. The signal molecule usually binds to a receptor protein that is embedded in the plasma membrane of the target cell and activates one or more intracellular signaling pathways mediated by a series of signaling proteins. Finally, one or more of the intracellular signaling proteins alters the activity of effector proteins and thereby the behavior of the cell.
Figure 15–2 Budding yeast cells responding to a mating factor. (A) The cells are normally spherical. (B) In response to the mating factor secreted by neighboring yeast cells, they put out a protrusion toward the source of the factor in preparation for mating. (Courtesy of Michael Snyder.)
metabolic
enzyme gene regulatoryprotein cytoskeletalprotein
altered
metabolism altered geneexpression
altered cell shape or movement
INTRACELLULAR SIGNALING PROTEINS RECEPTOR PROTEIN EXTRACELLULAR SIGNAL MOLECULE
EFFECTOR PROTEINS plasma membrane of target cell 10 mm (A) (B)
Fig. 1 A simple intracellular signaling pathway activated by an extracellular signal molecule. The signal molecule usually binds to a receptor protein that is embedded in the plasma membrane of the target cell and activates one or more intracellular signaling pathways mediated by a series of signaling proteins. Finally, one or more of the intracellular signaling proteins alters the activity of effector proteins and thereby the behavior of the cell. Adopted in Chapter 15: Mechanisms of Cell Communication in the book Molecular Biology of the Cell (textbook) [1].
Additionally, an intracellular signaling cascade can no longer be viewed as a linear pathway that relays and amplifies information. It is known that the cell uses these pathways as a way of integrating multiple inputs to shape a uniquely defined output. Hence, the interactions of different pathways and the dynamic modulation of the activities of the components within signaling pathways can create a multitude of biologi-cal outputs. The cell appears to use these complex networks of interacting pathways and regulatory feedback mechanisms to co-coordinately regulate multiple functions. These outputs allow the cell to respond to and adapt to an ever-changing environment [40].
2.2 Protein-protein interaction
Protein-protein interactions are specific interactions between two or more proteins. Indeed, protein-protein interactions are at the core of the entire interactomics system of any living cell.
2.2.1 Biological characteristics of the protein-protein interactions
The followings are the summary of general characteristics of protein-protein interactions [60].
Classification:Protein-protein interactions can be arbitrarily classified based on the proteins involved (structural or functional groups) or based on their physical properties (weak and transient, non-obligate vs. strong and permanent). Protein interactions are usually mediated by defined domains, hence interactions can also be classified based on the underlying domains.
Universality:Protein-protein interactions affect almost all processes in a cell: structural proteins need to interact in order to shape organelles and the whole cell, molecular machines such as ribosomes or RNA polymerases are hold together by protein-protein interactions, and the same is true for multi-subunit chan-nels or receptors in membranes [2].
Specificity:Distinguishes such interactions from random collisions that happen by Brownian motion in the aqeous solutions inside and outside of cells. Note that many proteins are known to interact although it remains unclear whether certain interactions have any physiological relevance.
Number of interactions:It is estimated that even simple single-celled organisms, such as yeast have their roughly 6000 proteins interact by at least 3 interactions per protein, i.e. a total of 20,000 interactions or more. By extrapolation, there may be 100,000 interactions in the human body.
Protein-protein interactions and protein complexes: Most protein-protein interactions are detected as interacting pairs or as components of protein complexes. Such complexes may contain dozens or even hundreds of protein subunits (ribosomes, spliceosomes, etc.). It has even been proposed that all proteins in a given cell are connected in a huge network in which certain protein interactions are forming and dissociating constantly.
2.2.2 Topological characteristics of the protein-protein interaction network
The followings are some topological characteristics of the protein-protein interaction networks [36]. Scale-free network:Protein-protein interactions have the features of a scale-free network, meaning that their degree distribution approximates a power law, P(k) ∼ kγ. In scale-free networks, most proteins
partic-ipate in only a few interactions, while a few (termed “hubs”) particpartic-ipate in dozens of interactions.
Small-world effect: Protein-protein interaction networks have a characteristic property known as the “small world effect”, which states that any two nodes can be connected via a short path of a few links. Although the small-world effect is a property of random networks, the path length in scale-free networks is much shorter than that predicted by the small-world effect. Therefore, scale-free networks are “ultra-small”. This short path length indicates that local perturbations in metabolite concentrations could permeate an entire network very quickly.
Disassortativity:In protein-protein interaction networks, highly-connected nodes (hubs) seldom directly link to each other. This differs from the assortative nature of social networks, in which well-connected people tend to have direct connections to each other. By contrast, all biological and technological networks have the property of disassortativity, in which highly-connected nodes are infrequently linked each other.
3 Constructing Signal Transduction Networks Using Multiple Data
In this section, we present our proposed method to construct the STN from the human PPI networks and multiple databases using soft-clustering. The related work were summarized in Section 3.1. In the next section (Section 3.2), we described our framework for doing the task of constructing STN. The evaluation of the experiments is showed in Section 3.4. Experimental results and some discussions are presented in Section 3.4.2.
3.1 Related work
Constructing STN based on PPI is an area of much ongoing research. A statistical model, based on repre-senting proteins as collections of domains or motifs, which predicts unknown molecular interactions within these biological networks, was proposed by Gomez et al. [25]. Using Markov chain Monte Carlo method, they then modeled the signal transduction networks (STN) in terms of domains in upstream and downstream protein interactions. Steffen et al. developed a computational method for generating static models of STN which utilizes PPI maps generated from large-scale two-hybrid screens and expression profiles from DNA microarrays [57]. Liu et al. applied a score function that integrated protein-protein interaction data and microarray gene expression data to predict the order of signaling pathway components [37]. Concerning protein modification time-course data, Allen et al. applied a method of computational algebra to modeling of signaling networks [4]. Another work by Fukuda et al. is to represent the model of signal transduction pathways based on a compound graph structure. Their method is designed to capture directly the structure of pathways that biologists bear in mind or that are described in the articles [20]. One of the most recent work is to search for the optimal subnetworks from PPI according to some cost functions [62]. Korcsm et al.have presented a signaling resource, SignaLink, compiled by applying uniform manual curation rules and data structures across eight major, biochemically defined signaling pathways in three metazoans. The curation method allowed a systematic comparison of pathway sizes and cross-talks [32]. Other work on the cross-talk of signaling pathway used network theory to find out the pathway interactions through connector proteins as the key means to transduce signals between pathways [27]. Li et al. built the global pathway crosstalk network by combining pathway and protein interaction data based on the shortest path profiles only [35].
Although the previous work achieved many results, there are still some biological characteristics of STN that they did not take much into account. First, it is known that the deeper level underlying the PPI to trans-mit signals in cells are functional domains, so-called signaling domains, and their interactions [46], [18]. Data of those significant signaling features are structured, complexly relational, and sparse in different data sources. In order to construct STN effectively, those data is needed to be appropriately integrated. Second, STN indeed have many overlapping components including proteins and their interactions
[40]. This work aims to solve those two intricate problems of STN to better construct STN from PPI net-works. To this end, we introduce an effective computational method to construct STN that (1) exploits integrated multiple signaling features of STN from heterogeneous sources, i.e., protein-protein interactions, signaling domains, domain-domain interactions, and protein functions, and (2) detects overlapping compo-nents using soft-clustering. Additionally, in previous work clustered objects were often individual proteins, but our method handled clustered objects as the functional or physical protein interactions because these interactions are the means to transmit signals in cells.
We evaluated the proposed method using human protein interaction network published in the database Reactome. Five complex biological processes were tested to demonstrate the performance. The clustered results are well-matched with these five processes. To the best of our knowledge, this work is the first one that computationally solves the STN problem for Homo Sapiens. The preliminary results open a prospect to study other problems related to complex biological systems in Homo Sapiens.
3.2 Materials and Methods
The method does two main tasks. The first one is to extract and preprocess signaling feature data from various data sources. Those relational data in heterogeneous types are then weighted and normalized by the proposed functions. Based on data extracted in the first task, the second one is to combine weighted data and then cluster protein-protein interactions into STN using soft-clustering. Because the main data mining technique in this paper is the clustering, we first review the clustering problem in the PPI network analysis
to provide more details of this study. The next two subsections, Subsection 3.3.4 and Subsection 3.3.5, describe two mentioned tasks of the data extraction and the STN reconstruction, respectively.
3.3 Clustering and protein-protein interaction networks
A cluster is a set of objects which share some common characteristics. Clustering is the process of grouping data objects into sets (clusters) which demonstrate greater similarity among objects in the same cluster than the ones in the different clusters. Clustering differs from classification; in the latter, objects are assigned to predefined classes, while clustering defines the classes themselves. Thus, clustering is an unsupervised classification problem, which means that it does not rely on training the data objects in predefined classes.
Clustering methods can be broadly divided into hierarchical and partitioning ones. In partitioning clus-tering, there are two categories of hard-clustering method and soft-clustering method. On the one hand, hard-clustering is based on classical set theory and assigns an instance to exactly one cluster, e.g., k-means, SOMs, etc. On the other hand, soft-clustering assigns an instance to several cluster and differentiate grade of representation (cluster membership), e.g., fuzzy c-means, HMMs, etc. [21].
In the traditional clustering approaches, a simple distance measure can often be used to reflect dissim-ilarity between two patterns, while other simdissim-ilarity measures can be used to characterize the conceptual similarity between patterns. However, most of protein-protein interactions are the binary ones without di-rection, the graph of PPI network is represented with proteins as nodes and interactions as edges. The relationship between two proteins is therefore a simple binary value: 1 if they interact, 0 if they do not. Because of this monotony, the definition of the distance between the two proteins becomes more difficult. Moreover, the reliable clustering of PPI networks is problematical due to a high rate of false positives and the huge volume of data.
Clustering approaches for PPI networks can be broadly classified into two categories, distance-based and graph-based. Distance-based clustering uses classic clustering techniques and focuses on the definition of the distance between proteins. Graph-based clustering includes mainly take into account the topology of the PPI network. Based on the structure of the network, the density of each subgraph is maximized or the cost of cut-off minimized while separating the graph. The following subsections will discuss each of these clustering approaches in more detail. In addition, we also give the presentation of soft clustering for PPI networks.
3.3.1 Distance-based Clustering
Generally, there are four distance-based clustering approaches applying for PPI networks [36]. The first category of approaches uses classic distance measurement methods, which offered a variety of coefficient formulas to compute the distance between proteins in PPI networks [50]. The second class of approaches defines a distance measure based on network distance, including the shortest path length, combined strength of paths of various lengths, and the average number of steps a Brownian particle takes to move from one vertex to another. The third approach type, exemplified by UVCLUSTER, defines a primary and a sec-ondary distance to establish the strength of the connection between two elements in relationship to all the elements in the analyzed dataset [5]. The fourth is a similarity learning approach by incorporating some annotation data. Although these four categories of approaches each involve different methods for distance measurement, they all apply classic clustering approaches to the computed distance between proteins [36].
3.3.2 Graph-based Clustering
A protein-protein interaction network is an undirected graph in which the weight of each edge between any two proteins is either 1 or 0. This section will explore graph-based clustering, another class of approaches to
the process of clustering. Graph-based clustering techniques are explicitly presented in term of a graph, thus converting the process of clustering a data set into such graph-theoretical problems as finding a minimum cut or maximal subgraphs in the graph G [36].
a. Finding Dense Subgraphs. The goal of this class of approaches is to identify the densest subgraphs within a graph; specific methods vary in the means used to assess the density of the subgraphs.
• Enumeration of complete subgraphs. This approach is to identify all fully connected subgraphs (cliques) by complete enumeration. While this approach is simple, it has several drawbacks. The ba-sic assumption underlying the method - that cliques must be fully internally connected - does not accurately reflect the real structure of protein complexes and modules. Dense subgraphs are not nec-essarily fully connected. In addition, many interactions in the protein network may fail to be detected experimentally, thus leaving no trace in the form of edges [55].
• Monte Carlo optimization. The use of a Monte Carlo approach allows smaller pieces of the cluster to be separately identified rather focusing exclusively on the whole cluster. Monte Carlo simulations are therefore well suited to recognizing highly dispersed cliques [55].
• Redundancies in PPI network. This approach assumes that two proteins that share a significantly larger number of common neighbors than would arise randomly will have close functional associa-tions. This method first ranks the statistical significance of forming shared partnerships for all protein pairs in the PPI network and then combines the pair of proteins with least significance. The p-value is used to rank the statistical significance of the relationship between two proteins. In the next step, the two proteins with smallest p-value are combined and are considered to be in the same cluster. This process is repeated until a threshold is reached [52].
• Molecular complex detection. Molecular complex detection (MCODE), proposed by Bader and Hogue, is an effective approach for detecting densely-connected regions in large proteprotein in-teraction networks. This method weights a vertex by local neighborhood density, chooses a few seeds with high weight, and isolates the dense regions according to given parameters. The MCODE algo-rithm operates in three steps: vertex weighting, complex prediction, and optional postprocessing to filter or add proteins to the resulting complexes according to certain connectivity criteria [8]. b. Finding Minimum Cut. Second category of graph-based clustering approaches generates clusters
by trimming or cutting a series of edges to divide the graph into several unconnected subgraphs. Any edge which is removed should be the least important (minimum) in the graph, thus minimizing the informational cost of removing the edges. Here, the least important is based on the structure of the graph. It does not mean the interaction between these two proteins is not important.
• Highly connected subgraph (HCS) algorithm. The highly-connected subgraph or HCS method is a graph-theoretic algorithm which separates a graph into several subgraphs using minimum cuts. The resulting subgraphs satisfy a specified density threshold. Despite its interest in density, this method differs from approaches discussed earlier which seek to identify the densest subgraphs. Rather, it exploits the inherent connectivity of the graph and cuts the most unimportant edges to find highly-connected subgraphs [26].
• Restricted Neighborhood Search Clustering Algorithm (RNSC). A cost-based local search algorithm based on the tabu search meta-heuristic was proposed [31]. In the algorithm, a clustering of a graph G= (V,E) is defined as a partitioning of the node set V. The process begins with an initial random or user-input clustering and defines a cost function. Nodes are then randomly added to or removed from clusters to find a partition with minimum cost. The cost function is based on the number of invalid connections. An invalid connection incident with v is a connection that exists between v and a node in a different cluster, or, alternatively, a connection that does not exist between v and a node u in the same cluster as v.
• Super paramagnetic clustering (SPC). The super-paramagnetic clustering (SPC) method uses an analogy to the physical prop- erties of an inhomogenous ferromagnetic model to find tightly-connected clusters in a large graph [24].
• Markov clustering The Markov clustering (MCL) algorithm was designed specifically for application to simple and weighted graphs and was initially used in the field of computational graph clustering. The MCL algorithm finds cluster structures in graphs by a mathematical bootstrapping procedure. The MCL algorithm simulates random walks within a graph by the alternation of expansion and inflation operations [61].
• Line graph generation.Line graph generation method generates the graph in which edges now rep-resent proteins and nodes reprep-resent interactions [48]. First, the protein interaction network is trans-formed into a weighted network, where the weights attributed to each interaction reflect the degree of confidence attributed to that interaction. Next, the network connected by interactions is expressed as a network of interactions, which is known in graph theory as a line graph. These nodes are then linked by shared protein content. The scores for the original constituent interactions are then averaged and assigned to each edge. Finally, an algorithm for clustering by graph flow simulation, TribeMCL, is used to cluster the interaction network and then to reconvert the identified clusters from an interaction-interaction graph back to a protein-protein graph for subsequent validation and analysis.
3.3.3 Soft-clustering for PPI Networks
Many proteins are believed to exhibit multiple functionalities in several biological process in general and STNs in particular. They do not participate in one process but intend to involve in some of them to perform different roles. Because soft clustering method is able to distinguish overlapping parts among clusters, it is potentially more sensible to reconstruct the biological processes. Some soft clustering methods are well applied to PPI networks.
The line graph generation is one of soft clustering techniques and has a number of attractive features [36]. It does not sacrifice informational content, because the original bidirectional network can be recovered at the end of the process. Furthermore, it takes into account the higher-order local neighborhood of interactions. Additionally, the graph it generates is more highly structured than the original graph. Finally, it produces an overlapping graph partitioning of the interaction network, implying that proteins may be present in multiple functional modules.
Ucar et al.’s work proposed a soft clustering method using hub-induced subgraphs [58]. Their approach consists of two stages. In the first stage, they refine the PPI graph to improve functional modularity, using hub-induced subgraphs. They employ the edge betweenness measure to identify dense regions within the neighborhoods. In the second stage, they cluster the refined graph using traditional algorithms. Their end goal is to isolate components with high degree of overlap with known functional modules. An additional advantage of the refinement process is its ability to perform soft clustering of hub proteins. Owing to this approach, they improved functional modularity in PPI network.
Other soft clustering for PPI is an ensemble framework [7]. They construct a variant of the PCA-agglo consensus algorithm to perform soft clustering of proteins, which allows proteins to belong to multiple clusters. The hard agglomerative algorithm places each protein into the most likely cluster to satisfy a clustering criterion. However, it is possible for a protein to belong to many clusters with varying degrees. The probability of a protein belonging to an alternate cluster can be expressed as a factor of its distance from the nodes in the cluster. If a protein has sufficiently strong interactions with the proteins that belong to a particular cluster, then it can be considered amenable to multiple memberships.
3.3.4 Extracting signaling feature data from multi-data sources
STN have a complex two-level signaling machinery. The first level of complexity in cellular signaling con-structs from the large number of molecules and multiple types of interactions between them. The second layer of complexity of signaling biochemistry is apparent from the fact that signaling proteins often con-tain multiple functional domains, thus enabling each to interact with numerous downstream targets [18]. Considering these complexities, we extracted the following structured data of signaling features.
1. Protein-protein interactions (PPI): the upper level consists of the components as interfaces to transmit signals. PPI data were extracted from Reactome database1.
2. Domain-domain interactions (DDI): the deeper level consists of the functional domains that perform as the basic elements in signal transduction. DDI data were extracted from iPfam database2.
3. Signaling domain-domain interactions: the functional level consists of signaling domains (specific func-tional domains) that act as key factors to transduce signals inside STN. Signaling DDI data were extracted from SMART database3and referred in [46].
Table 1 List of signaling features and their corresponding data sources.
Feature Database Description of database
Protein-protein Reactome database [30] An online bioinformatics database
interactions of biology described in molecular
terms. The largest set of entries refers to human biology
Domain-domain iPfam database [19] A resource describing domain-domain
interactions interactions observed in PDB entries
Signaling domains SMART database [34] SMART allows the identification and and Pawson’s dataset [46] annotation of genetically mobile
domains and the analysis of domain architectures
Function of protein Uniprot database [9] The world’s most comprehensive catalog of information on proteins
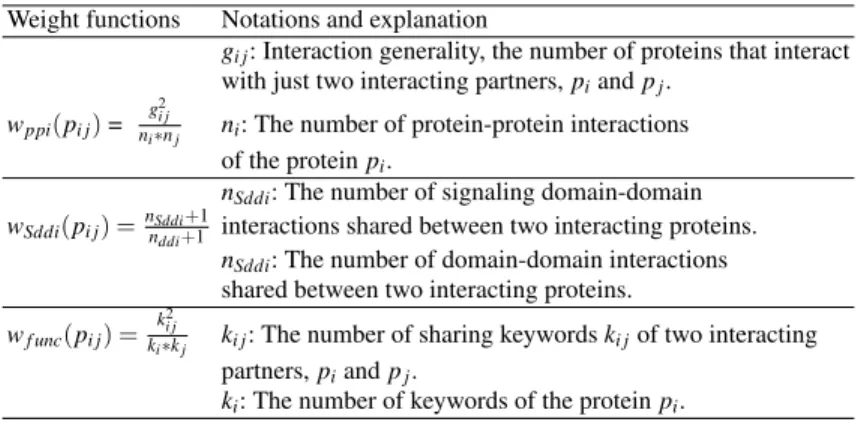
Functions of proteins in STN were also extracted from Uniprot database4in terms of keywords. The extracted data are in different types, e.g., the numerical type for number of PPI, interaction general-ity, number of signaling DDI or categorical type for protein functions. Those data have complex relations, such as a protein may have many interactions and then each interaction may have many DDI. In a domain interaction, the interacting partner may be a signaling domain or not. To exploit these relations, after extract-ing data from multi-data sources, we weighted and normalized these relational data by weight functions. Table 2 shows these proposed weight functions and the corresponding explanations.
• PPI weight function (wppi): The topological relation of proteins in the PPI network was extracted in
terms of the numbers of interactions of each partner and the interaction generality.
• Signaling DDI weight function (wSddi): The relation between a PPI and their domains was exploited to
study more deeply STN in terms the number of DDI and signaling DDI mediating this interactions. • Keyword weight function (wf unc): The relation of a PPI and protein functions was considered in terms
of the keywords tagged in each partner and the keywords shared between them.
3.3.5 Combining signaling feature data to construct STN using soft-clustering
After weighing signaling features, it is necessary to combine them all in a unified computational scheme to take advantage of those data. We integrated these data and represented them in forms of feature vectors. Each interaction has its own feature vector that has three elements corresponding to three features, vi j
= {wppi, wSddi, wf unc}. Subsequently, we employed a soft-clustering algorithm to cluster the interactions
based on their features vectors. Soft-clustering can construct STN and detect the overlapping components that can not be found by traditional hard-clustering. Note that we used Mfuzz software package [33] to
1www.reactome.org/
2www.sanger.ac.uk/Software/Pfam/iPfam/ 3smart.embl-heidelberg.de/
Table 2 Signaling features and their weight functions.
Weight functions Notations and explanation
gi j: Interaction generality, the number of proteins that interact
with just two interacting partners, piand pj.
wppi(pi j) = g2
i j
ni∗nj ni: The number of protein-protein interactions
of the protein pi.
nSddi: The number of signaling domain-domain
wSddi(pi j) =nnSddi+1
ddi+1 interactions shared between two interacting proteins.
nSddi: The number of domain-domain interactions
shared between two interacting proteins. wf unc(pi j) =
k2 i j
ki∗kj ki j: The number of sharing keywords ki jof two interacting
partners, piand pj.
ki: The number of keywords of the protein pi.
implement fuzzy c-means (FCM) clustering algorithm in our experiments. Fuzzy c-means (FCM) clustering algorithm is a popular soft-clustering algorithm. It is based on the iterative optimization of an objective function to minimize the variation of objects within clusters. First, it generates accessible internal cluster structures, i.e. it indicates how well corresponding clusters represent genes/proteins. Second, the overall relation between clusters, and thus a global clustering structure, can be defined. Additionally, soft clustering is more noise robust and a priori pre-filtering of genes can be avoided. This prevents the exclusion of biologically relevant genes from the data analysis.
Figure 1 summarizes the key idea of our method that does (1) extracting and weighing signaling features and (2) integrating and soft-clustering them into STN. Given a large protein-protein interaction network N, the outputs of our method are STN, which are the subgraphs of edges as protein interactions and node as proteins. Step 1 is to obtain the binary interactions from the protein-protein interaction network N. From Step 2 to Step 5 is to do the first task, extracting and then weighing signaling data features by functions shown in Table 2. These steps were done for all binary interactions to exploit the relations between PPI and signaling features. Step 6 and Step 7 are to perform the second task, combining weighted feature data, representing them in forms of feature vectors vi j= {wppi, wSddi, wf unc} and lastly doing soft-clustering into
STNS . STN S are returned in Step 8.
3.4 Evaluation
To evaluate the performance of the method, we consider a complex PPI network to detect STN out of other biological processes. The tested PPI network does not contain only signaling processes but also other biological processes functioned inside the network as the nature in cells. The clustered results should reflect these complicated phenomenon, well construct signaling processes and find overlapping components. We extracted five heterogeneous processes in Reactome database and the experimental results demonstrated that our method effectively constructed signaling processes from the PPI network.
3.4.1 Experiments for Human STN construction
The Reactome database consists of 68 Homo sapiens biological processes of 2,461 proteins. They also published 6,188 protein interactions, among those there are 6,162 interactions participating in biological processes. Investigating known biological processes in Reactome database, there are 636 proteins partaking
Algorithm 1 The proposed method to construct STN from PPI networks using soft-clustering and multi-signaling feature data.
Input:
Protein-protein network N.
Set of featuresF ⊂{fppi, fSddi, ff unc}.
Output:
Set of signal transduction networksS .
1: Extract binary interactions {pi j} from the protein-protein network N.P :={pi j}.
2: For each interaction pi j⊂P
3: Extract and formalize data for the PPI data feature fppi
Calculate the number of interactions ni, njof each interacting
partner piand pj, respectively.
Calculate the interacting generality gi jof interaction pi j.
Weigh the feature fppiby the numbers ni, nj, and gi j.
4: Extract and formalize data for the signal DDI feature fSddi
Calculate the number of sharing domain-domain interactions nddiof two interacting
partners, piand pj.
Calculate the number of sharing signaling domain-domain interactions nSddiof two
interacting partners, piand pj.
Weigh the feature fSddiby the numbers nddi, nSddi.
5: Extract and formalize data for the function data feature ff unc
Calculate the number of keywords ki, kjof each interacting partner piand pj,
respectively.
Calculate the number of sharing keywords ki jof two interacting partners, piand pj.
Weigh the feature ff uncby the numbers ki, kj, and ki j.
6: Combine and represent the all features in the feature vectors vi j={fppi, fSddi, ff unc}.
7: Apply a soft-clustering algorithm with the set of feature vectors {vi j} to cluster interactions pi jinto signal transduction
networksS . 8: returnS .
in at least 2 different processes, 400 proteins in at least 3 processes, 119 proteins in 5 processes. These facts prove that there exists lot of proteins and their interactions overlapping among these processes.
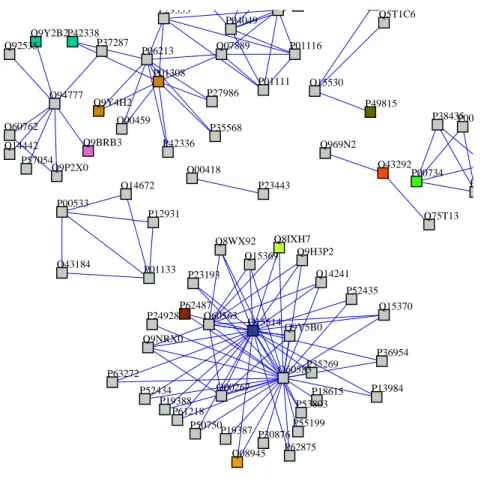
In our experiments, we extracted a group of five biological processes which have from 30 to 50 proteins and include signaling networks. Table 3 shows some information related to these five processes. Totally, this group consists of 145 distinct interactions of 140 distinct proteins. Among these processes, there are overlapping interactions and proteins. Figure 2 illustrates the interaction network of five processes.
Proteins taking part in these processes are extracted and looked for their interactions in the Reactome interactions set. We strictly extracted only the interactions that have both interacting partners joining in processes because the method considers the proteins but more importantly their interactions. The extracted interactions and their signaling features were then input in the soft-clustering algorithm.
In this work, we applied Mfuzz software package to run fuzzy c-means (FCM) clustering algorithm. It is based on the iterative optimization of an objective function to minimize the variation of objects within
Table 3 Five tested biological processes and some related information.
Reactome annotation Description #Proteins #Interactions REACT 1069 Post-translational protein 40 23
modification
REACT 1892 Elongation arrest and recovery 31 68 REACT 498 Signaling by Insulin receptor 39 44 REACT 769 Pausing and recovery of 31 68
elongation
P42338 P13984 P57054 P38435 Q9Y4H2 P00734 P37287 Q9Y5B0 Q15370 P01308 Q8WX92 P01133 O14672 Q9BRB3 P30876 P12931 O94777 P27986 P18615 Q07889 Q15369 Q92535 P04049 O60583 P19388 P23443 Q14442 O00267 O60563 Q9NRX0 O00459 Q9P2X0 P00740 P61218 O43292 O15514 P53803 P50750 Q08945 Q9Y2B2 P62487 P24928 Q14241 P49815 Q9H3P2 Q75T13 P01111 P00742 O15530 Q969N2 P35269 Q8IXH7 Q5T1C6 P01116 P35568 P42336 P36954 P19387 O00418 P55199 O60762 P62875 P52434 P00533 P63272 P52435 P06213 P23193 O43184 P29353
Fig. 2 Protein interaction networks of the five testing processes.
clusters [33]. As a result, fuzzy c-means produces gradual membership values µi jof an interaction i between
0 and 1 indicating the degree of membership of this interaction for cluster j. This strongly contrasts with hard-clustering, e.g., the commonly used k-means clustering that generates only membership values µi j
of either 0 or 1. Mfuzz is constructed as an R package implementing soft clustering tools. The additional package Mfuzzgui provides a convenient TclTk-based graphical user interface.
Concerning the parameters of Mfuzz, the number of clusters was 5 (because we are considering 5 pro-cesses) and the so-called fuzzification parameter µi j was chosen 0.035 (because the testing data is not
noisy).
3.4.2 Experimental Results and Discussion for Human STN construction
Actually, two processes REACT 1892 and REACT 498 share the same set of proteins and the same interac-tions as well. Also, two signaling processes, REACT 9417 and REACT 498 have 16 common interacinterac-tions. Nevertheless, the process ‘post-translational protein modification’ is separated with the rest processes. In such complex case, the method should construct STN effectively and detect the overlaps among STN.
The threshold to output clusters is 0.1. The threshold means that if the membership of an interaction iwith a cluster j µi j≥ 0.1, this interaction highly correlates with the cluster j and it will be clustered to
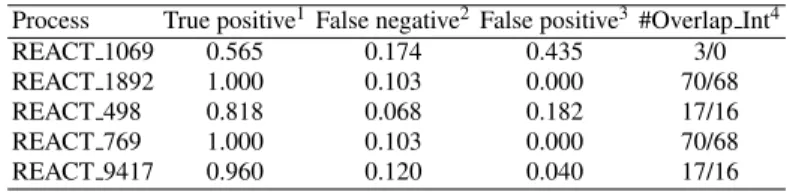
cluster j. Five clusters are outcomes and then matched with 5 processes. The results are shown in Table 4.
Table 4 Clustered results for five tested biological processes.
Process True positive1False negative2False positive3#Overlap Int4
REACT 1069 0.565 0.174 0.435 3/0
REACT 1892 1.000 0.103 0.000 70/68
REACT 498 0.818 0.068 0.182 17/16
REACT 769 1.000 0.103 0.000 70/68
REACT 9417 0.960 0.120 0.040 17/16
1 True positive: the number of true interactions clustered/the number of interactions of the fact process.
2 Faulse negative: the number of interactions missed in fact processes/the number of interactions of the fact process. 3 False positive : the number of false interactions clustered/the number of interactions of the fact process.
4 #Overlap Int: the number of overlapping interactions among the clusters/the number of overlapping interactions among the fact processes.
Table 4 shows that we can construct signal transduction networks with the small error and can detect the nearly exact number of overlapping interactions. The combination of signaling feature data distinguished signaling processed from other biological processes and soft-clustering detected the overlapping compo-nents. When we checked the overlapping interactions among the clusters, there were exact 16 interactions that are shared in two signaling processes ‘signaling by Insulin receptor’ and ‘signaling by EGFR’. In ad-dition, the same interaction set of the process ‘elongation arrest recovery’ and the process ‘pausing and recovery of elongation’ are found in their clusters. In fact, REACT 1069 does not overlap other processes but the results return three overlapping interactions, i.e., one with REACT 1892 and REACT 769 and two with REACT 498 and REACT 9417.
Analyzing the case of interaction (P00734, P00734) shared among REACT 1069, REACT 498 and RE-ACT 9417, we found some interesting findings. Protein P00734 (Prothrombin) functions in blood home-ostasis, inflammation and wound healing and joins in biological process as cell surface receptor linked signal transduction (have GO term GO:0007166). In Reactome database, interaction (P00734, P00734) does not happen in the processes REACT 498 and REACT 9417, however according to the function of P00734, it probably partakes in one or two signaling processes REACT 498 and REACT 9417.
Although the experiment carried out a case study of five biological processes; the proposed method is flexible to be applied to the larger scale of human interaction networks. In the intricate relations of many biological processes, the proposed method can well construct signal transduction networks.
We proposed a general framework to construct STN from multiple signaling feature data using soft-clustering. The experiments with various parameters and other soft-clustering algorithms (not only FCM algorithm in Mfuzz) should be tested.
4 Some Results of Yeast STN Reconstruction
In addition to the work on human STN, we also carried out the work on yeast STN. This work consist of two parts: (1) signaling DDI prediction using ILP and (2) MARK yeast reconstruction.
This work concentrates on study STN for Saccharomyces cerevisiae – a budding yeast. The objective of this work is twofold. One objective is to present a method of predicting signaling domain-domain inter-actions (signaling DDI) using inductive logic programming (ILP), and the other is to present a method of discovering signal transduction networks (STN) using signaling DDI.
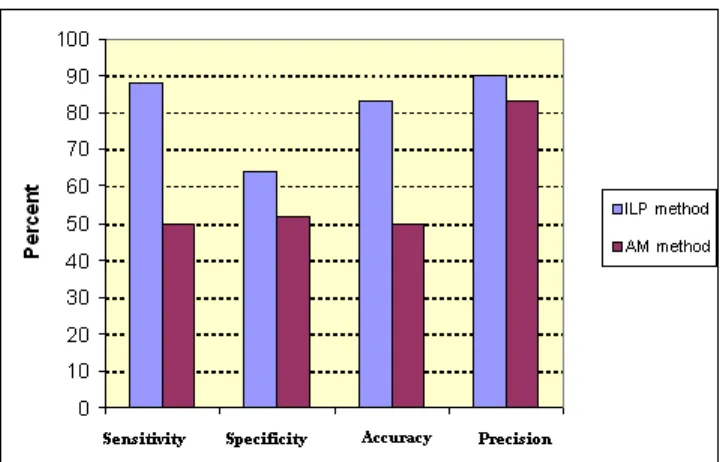
Fig. 3 Performance of ILP method (minpos = 3 and noise = 0) compared with AM methods for signaling DDI prediction.
For signaling DDI prediction, we first examine five most informative genome databases, and extract more than twenty four thousand possible and necessary ground facts on signaling protein do-mains. We then employ inductive logic programming (ILP) to infer efficiently signaling DDI. Sensitivity (88%) and accuracy (83%) obtained from 10-fold cross validation show that our method is useful for predicting signaling domain interactions. Studying yeast MAPK path-ways, we predicted some new signaling DDI that do not exist in the well-known InterDom database. Assuming all pro-teins in STN are known, we preliminarily build up signal transduction networks be-tween these proteins based on their sig-naling domain interaction networks. We
can mostly reconstruct the STN of yeast MAPK pathways from the inferred signaling domain interactions with coverage of 85%.
Figure 3 shows the results for signaling domain-domain interactions. Our experimental results obtained higher sensitivity, specificity, accuracy and precision compared with AM method [56].
From predicted (signaling) domain interaction networks, we raise the question of how completely they cover the STN, and how to reconstruct STN using signaling DDI. Our motivation was to propose a com-putational approach to discover more reliable and stable STN using signaling DDI. When studying yeast MAPK pathways, the results of our work are considerable.
All extracted domains of proteins in MAPK pathways are inputs (testing examples) in our proposed pre-dictor using ILP method [42]. With 32 proteins appearing in MAPK pathways, we extracted 29 different protein domains, and some of them are shared among proteins. Some domains are determined to be signal-ing domains, such as domain pf00069 belongsignal-ing to many proteins, for example, ste11 yeast, fus3 yeast or pbs 2, etc., and some of them are not signaling domains, such as TEA or MID2. Figure 4 shows yeast MAPK (mitogen-activated protein kinase) covered by signaling domain interactions. MAPK pathways involve pheromone response, filamentous growth, and maintenance of cell wall integrity pathways. Table 5 shows the results of predicted signaling DDI when reconstructing STN for the yeast MAPK pathways. Moreover, among predicted signaling DDI for yeast MAPK pathways, there are some DDI which are newly discov-ered, when compared with the InterDom database. For example, our predicted DDI (pf00071,pf00768), (pf00768,pf00069), (pf00433,pf02200)do not exist in the InterDom database.
Evaluating signaling domain interactions predicted from the testing set of MAPK domains, 88% of protein relations in the Cell Wall Integrity PKC pathway, the Pheromone Response pathway, and the Filamentous Growth pathway are covered, and the Invasion High Osmolarity HOG pathway has cover-age of 80%. Outstandingly, lots of domain interactions are found in which their corresponding proteins interacted in DIP (Database of Interacting Proteins) 5 and/or in CYGD (Comprehensive Yeast Genome Database)footnotehttp://mips.gsf.de /genre/proj/yeast/, for example, seven signaling domain interactions in the Cell Wall Integrity PKC pathway belong to 39 protein-protein interactions in CYGD database, and also belong to 47 protein-protein interactions in DIP. For estimating the reliability of STN, the reliability score WST N(see in [42]) was calculated for yeast MAPK pathways. The reliability score of the Cell Wall Integrity
PKC pathway is the highest with WST N= 7.19.
The work is the first work that took effort to predict signaling DDI. The results on yeast STN confirmed the role of signaling domain-domain interactions and it
Fig. 4 MAPK signal transduction pathways in yeast covered by signaling DDI networks. The rectangles denote proteins, the ellipses illustrate their domains and the signaling domains are depicted in dark. The signaling DDI are the lines with arrows, the missing interactions are dashed lines with arrows.
Table 5 Results of predicted signaling DDI in the yeast MAPK pathways
The yeast MARK pathways Percentage of signaling #CYGD PPI #DIP PPI
pathways DDI predicted covered covered
Cell Wall Integrity PKC 88% 39 47
Pheromone Response 88% 41 42
Filamentous Growth 88% 40 38
Invasion High Osmolarity HOG 80% 40 53
5 Outlook
The previous sections presented our work testing the example of five biological processes for human or a single pathway - MARK pathway for yeast. However, the methods are easy to be applied to the large-scale protein interaction networks. In the intricate relationships with various processes, the proposed method can well detect signal transduction networks. The preliminary results encourage the further studies on biological complex systems.
1. Consider the whole interaction networks or some functional sub-networks, it is interesting to not only reconstruct the known signal transduction networks but also model the new ones. The components (pro-teins and their interactions) that are shared among these networks to perform various functions in differ-ent biological processes can be further functionally investigated.
2. Given starting nodes (e.g., membrane proteins) and ending nodes (e.g, transcription factors), the pro-posed method can specify the signal transduction networks and then discover complete signaling path-ways.
3. In human disease study, human protein interaction networks, signal transduction pathways and diseases closely associate with each other. Signaling network dysfunction can result in abnormal cellular transfor-mation or differentiation, often producing a physiological disease outcome. The potential work on
iden-tification of disease-related subnetworks are significant and can be carried out through the constructed signal transduction networks.
4. Some other data mining methods in relational learning and statistical learning can be applied to supple-ment the work.
5. Our proposed methods are flexible to integrate other useful biological features and apply to other organ-isms.
6 Summary
In this paper, we have presented a the study on mining multiple data to reconstruct STN. The soft-clustering method was used to construct signal transduction networks from protein-protein networks. Many structured data of signaling features were extracted, integrated and exploited. The experimental results demonstrated that our proposed method can construct STN effectively. The overlapping parts among STN were well detected. As proposing the general framework to construct signal transduction networks from protein inter-action networks using soft-clustering, the method should be more carefully tested with various parameters and other algorithms (not only FCM algorithm in Mfuzz). Other computational measures also need calcu-lated to better demonstrate efficiency of the method. Yet, the experimental results show that the proposed method is promising to construct signal transduction networks from protein-protein interaction networks. On the other hand, the work on the yeast STN proposed an alternative way to study in deep the mechanism of STNs in terms of signaling domain interactions. These work are expected to provide insights of the cell signaling that will be useful for studying systems biology.
7 Acknowledgement
We would like to respectfully thank to Professor Kenji Satou for all helpful advices and discussion. Also, we highly appreciate all comments with Dr. Dang-Hung Tran and Dr. Jose Clemente.
References
1. Molecular Biology of the Cell. Garland Science (2007)
2. Alberts, B.: Molecular biology of the cell. Garland Science (2002)
3. Alfarano, C., Andrade, C.E., Anthony, K., Bahroos, N., Bajec, M., Bantoft, K., Betel, D., Bobechko, B., Boutilier, K., Burgess, E., Buzadzija, K., Cavero, R., D’Abreo, C., Donaldson, I., Dorairajoo, D., Dumontier, M.J., Dumontier, M.R., Earles, V., Farrall, R., Feldman, H., Garderman, E., Gong, Y., Gonzaga, R., Grytsan, V., Gryz, E., Gu, V., Haldorsen, E., Halupa, A., Haw, R., Hrvojic, A., Hurrell, L., Isserlin, R., Jack, F., Juma, F., Khan, A., Kon, T., Konopinsky, S., Le, V., Lee, E., Ling, S., Magidin, M., Moniakis, J., Montojo, J., Moore, S., Muskat, B., Ng, I., Paraiso, J.P., Parker, B., Pintilie, G., Pirone, R., Salama, J.J., Sgro, S., Shan, T., Shu, Y., Siew, J., Skinner, D., Snyder, K., Stasiuk, R., Strumpf, D., Tuekam, B., Tao, S., Wang, Z., White, M., Willis, R., Wolting, C., Wong, S., Wrong, A., Xin, C., Yao, R., Yates, B., Zhang, S., Zheng, K., Pawson, T., Ouellette, B.F.F., Hogue, C.W.V.: The Biomolecular Interaction Network Database and related tools 2005 update. Nucleic Acids Research 33(suppl 1), D418–D424 (2005). DOI 10.1093/nar/gki051. URL
http://nar.oxfordjournals.org/content/33/suppl_1/D418.abstract
4. Allen, E.E. and Fetrow, J.S. and Daniel,L. W. and Thomas, S.J. and John, D.J.: Algebraic dependency models of protein signal transduction networks from time-series data. Journal of Theoretical Biology 238(2), 317–330 (2006)
5. Arnau, V., Mars, S., Marin, I.: Iterative Cluster Analysis of Protein Interaction Data. Bioinformatics 21(3), 364–378 (2005). DOI 10.1093/bioinformatics/bti021. URLhttp://bioinformatics.oxfordjournals.org/cgi/content/ abstract/21/3/364
6. Asthagiri, A.R., Lauffenburger, D.A.: Bioengineering models of cell signaling. Annual Review of Biomedical Engineering 2(1), 31–53 (2000). DOI 10.1146/annurev.bioeng.2.1.31. URLhttp://arjournals.annualreviews.org/doi/abs/ 10.1146/annurev.bioeng.2.1.31
7. Asur, S., Ucar, D., Parthasarathy, S.: An ensemble framework for clustering protein protein interaction networks. Bioin-formatics 23(13), i29–40 (2007). DOI 10.1093/bioinBioin-formatics/btm212
8. Bader, G.D., Hogue, C.W.: An automated method for finding molecular complexes in large protein interaction net-works. BMC bioinformatics 4(1), 2+ (2003). DOI 10.1186/1471-2105-4-2. URLhttp://dx.doi.org/10.1186/ 1471-2105-4-2
9. Bairoch, A., Apweiler, R., Wu, C., Barker, W., Boeckmann, B., Ferro, S., Gasteiger, E., Huang, H., Lopez, R., Magrane, M., Martin, M., Natale, D., O’Donovan, C., Redaschi, N., Yeh, L.: The universal protein resource (uniprot). Nucleic Acids Research 33, D154–D159 (2005)
10. Bauer, A., Kuster, B.: Affinity purification-mass spectrometry: Powerful tools for the characterization of protein com-plexes. Eur. J. Biochem. 270(4), 570–578 (2003)
11. Ben-Hur, A., Noble, W.S.: Kernel methods for predicting protein-protein interactions. Bioinformatics 21(suppl1), i38– 46 (2005). DOI 10.1093/bioinformatics/bti1016. URLhttp://bioinformatics.oxfordjournals.org/cgi/content/ abstract/21/suppl1/i38
12. Bhalla, U.S.: Understanding complex signaling networks through models and metaphors. Progress in Biophysics and Molecular Biology 81(1), 45 – 65 (2003). DOI DOI:10.1016/S0079-6107(02)00046-9. URL http://www. sciencedirect.com/science/article/B6TBN-47C7506-3/2/2267fd452dc127061f9236c3d42067f0
13. Bock, J.R., Gough, D.A.: Predicting protein-protein interactions from primary structure. Bioinformatics 17(5), 455–460 (2001)
14. Brown, K., Jurisica, I.: Unequal evolutionary conservation of human protein interactions in interologous networks. Genome Biology 8(5), R95+ (2007). DOI 10.1186/gb-2007-8-5-r95
15. Cannataro, M., Guzzi, P.H., Veltri, P.: Protein-to-protein interactions: Technologies, databases, and algorithms. ACM Comput. Surv. 43, 1:1–1:36 (2010). DOI http://doi.acm.org/10.1145/1824795.1824796. URLhttp://doi.acm.org/ 10.1145/1824795.1824796
16. Chatr-aryamontri, A., Ceol, A., Palazzi, L.M., Nardelli, G., Schneider, M.V., Castagnoli, L., Cesareni, G.: MINT: the Molecular INTeraction database. Nucl. Acids Res. 35(suppl1), D572–574 (2007). DOI 10.1093/nar/gkl950
17. Chen, X., Liu, M.: Prediction of protein-protein interactions using random decision forest framework. Bioinformatics 21(24), 4394–4400 (2005). DOI 10.1093/bioinformatics/bti721
18. Eungdamrong, N.J., Iyenga, R.: Modeling cell signaling networks. Biology of the Cell 96(5), 355–362 (2004)
19. Finn, R.D., Marshall, M., Bateman, A.: iPfam: visualization of proteinprotein interactions in PDB at domain and amino acid resolutions. Bioinformatics 21(3), 410–412 (2005). DOI 10.1093/bioinformatics/bti011. URL http: //bioinformatics.oxfordjournals.org/content/21/3/410.abstract
20. Fukuda, K., Takagi, T.: Knowledge representation of signal transduction pathways. Bioinformatics 17(9), 829–837 (2001). DOI 10.1093/bioinformatics/17.9.829
21. Futschik, M., Carlisle, B.: Noise-robust soft clustering of gene expression time-course data. J Bioinform Comput Biol. 3(4), 965–88 (2005)
22. Gagneur, J., Casari, G.: From molecular networks to qualitative cell behavior. FEBS Letters 579(8), 1867 – 1871 (2005). DOI DOI:10.1016/j.febslet.2005.02.007. URLhttp://www.sciencedirect.com/science/article/ B6T36-4FG2TYJ-5/2/904b1a2f8f6bc73b06ab00e9e4bfe2f8. Systems Biology
23. Gagneur, J., Krause, R., Bouwmeester, T., Casari, G.: Modular decomposition of protein-protein interaction networks. Genome Biol 5(8) (2004). URLhttp://dx.doi.org/10.1186/gb-2004-5-8-r57
24. Getz, G., Levine, E., Domany, E.: Coupled two-way clustering analysis of gene microarray data. Proceedings of the National Academy of Sciences of the United States of America 97(22), 12,079–12,084 (2000). URLhttp://www.pnas. org/content/97/22/12079.abstract
25. Gomez, S.M., Lo, S., Rzhetsky, A.: Probabilistic Prediction of Unknown Metabolic and Signal-Transduction Networks. Genetics 159(3), 1291–1298 (2001)
26. Hartuv, E., Shamir, R.: A clustering algorithm based on graph connectivity. Inf. Process. Lett. 76, 175–181 (2000). DOI 10.1016/S0020-0190(00)00142-3. URLhttp://portal.acm.org/citation.cfm?id=364456.364469
27. Ihekwaba, A.E., Nguyen, P.T., Priami, C.: Elucidation of functional consequences of signalling pathway interactions. BMC Bioinformatics 10(370)
28. Ito, T., Chiba, T., Ozawa, R., Yoshida, M., Hattori, M., Sakaki, Y.: A comprehensive two-hybrid analysis to explore the yeast protein interactome. In: Proc. Natl. Acad. Sci. USA 98, pp. 4569–4574 (2001)
29. Jansen, R., Yu, H., Greenbaum, D., Kluger, Y., Krogan, N.J., Chung, S., Emili, A., Snyder, M., Greenblatt, J.F., Gerstein, M.: A Bayesian Networks Approach for Predicting Protein-Protein Interactions from Genomic Data. Science 302(5644), 449–453 (2003). DOI 10.1126/science.1087361. URLhttp://www.sciencemag.org/cgi/content/abstract/302/ 5644/449
30. Joshi-Tope, G., Gillespie, M., Vastrik, I., D’Eustachio, P., Schmidt, E., de Bono, B., Jassal, B., Gopinath, G., Wu, G., Matthews, L., Lewis, S., Birney, E., Stein, L.: Reactome: a knowledgebase of biological pathways. Nucl. Acids Res. 33(suppl1), D428–432 (2005). DOI 10.1093/nar/gki072
31. King, A.D., Prulj, N., Jurisica, I.: Protein complex prediction via cost-based clustering. Bioinformatics 20(17), 3013–3020 (2004). DOI 10.1093/bioinformatics/bth351. URLhttp://bioinformatics.oxfordjournals.org/content/20/17/ 3013.abstract
32. Korcsmaros, T., Farkas, I.J., ad Petra Rovo, M.S.S., Fazekas, D., Spiro, Z., Bode, C., Lenti, K., Vellai, T., Csermely, P.: Uniformly curated signaling pathways reveal tissue-specific cross-talks and support drug target discovery. Bioinformatics 26(16), 2042–2050 (2010). DOI 10.1093/bioinformatics/btq310. URLhttp://bioinformatics.oxfordjournals. org/content/26/16/2042.abstract
33. Kumar, L., Futschik, M.: Mfuzz: A software package for soft clustering of microarray data. Bioinformation 2(1), 5–7 (2007)
34. Letunic, I., Doerks, T., Bork, P.: SMART 6: recent updates and new developments. Nucleic Acids Research 37(suppl 1), D229–D232 (2009). DOI 10.1093/nar/gkn808. URLhttp://nar.oxfordjournals.org/content/37/suppl_1/D229. abstract
35. Li, Y., Agarwal, P., Rajagopalan, D.: A global pathway crosstalk network. Bioinformatics 24(12), 1442–1447 (2008). DOI 10.1093/bioinformatics/btn200
36. Lin, C., Cho, Y., Hwang, W., Pei, P., Zhang, A.: Clustering methods in protein-protein interaction network. Knowledge Discovery in Bioinformatics: Techniques, Methods and Application (2006)
37. Liu, Y., Zhao, H.: A computational approach for ordering signal transduction pathway components from genomics and proteomics data. BMC Bioinformatics 5(158) (2004). DOI 10.1186/1471-2105-5-158. URLhttp://dx.doi.org/10. 1186/1471-2105-5-158
38. Matthews, L.R., Vaglio, P., et al., J.R.: Identification of potential interaction networks using sequence-based searches for conserved protein-protein interactions or ’interologs’. Genome Res. 11(12), 2120–2126 (2001)
39. Mering, C.v., Huynen, M., Jaeggi, D., Schmidt, S., Bork, P., Snel, B.: STRING: a database of predicted functional associations between proteins. Nucleic Acids Research 31(1), 258–261 (2003). DOI 10.1093/nar/gkg034. URL
http://nar.oxfordjournals.org/content/31/1/258.abstract
40. Neves, S.R., Iyengar, R.: Modeling Signaling Networks. Sci. STKE 2005(281), tw157– (2005). DOI 10.1126/stke. 2812005tw157. URLhttp://stke.sciencemag.org/cgi/content/abstract/sigtrans;2005/281/tw157
41. Ng, S.K., Tan, S.H.: Discovering protein-protein interactions. Journal of Bioinformatics and Computational Biology 1(4), 711–741 (2003)
42. Nguyen, T., Ho., T.: Discovering signal transduction networks using signaling domain-domain interactions. Genome Informatics 17(2), 35–45 (2006)
43. Nguyen, T., Ho, T.: An Integrative Domain-Based Approach to Predicting Protein-Protein Interactions. Journal of Bioin-formatics and Computational Biology 6 (2008)
44. Nicolau, M., Tibshirani, R., Brresen-Dale, A.L., Jeffrey, S.S.: Disease-specific genomic analysis: identifying the signature of pathologic biology. Bioinformatics 23(8), 957–965 (2007). DOI 10.1093/bioinformatics/btm033. URLhttp:// bioinformatics.oxfordjournals.org/content/23/8/957.abstract
45. Pagel, P., Kovac, S., Oesterheld, M., Brauner, B., Dunger-Kaltenbach, I., Frishman, G., Montrone, C., Mark, P., Stumpflen, V., Mewes, H.W., Ruepp, A., Frishman, D.: The MIPS mammalian protein-protein interaction database. Bioinformatics 21(6), 832–834 (2005). DOI 10.1093/bioinformatics/bti115. URLhttp://bioinformatics.oxfordjournals.org/ cgi/content/abstract/21/6/832
46. Pawson, T., Raina, M., Nash, N.: Interaction domains: from simple binding events to complex cellular behavior. FEBS Letters 513(1), 2–10 (2002)
47. Pellegrini, M., Marcotte, E.M., et al., M.J.T.: Assining protein functions by comparative genome analysis: Protein phylo-genetic profiles. In: Proc. Natl. Acad. Sci. USA 96(8), pp. 4285–4288 (1999)
48. Pereira-Leal, J.B., Enright, A.J., Ouzounis, C.A.: Detection of functional modules from protein interaction networks. Proteins: Structure, Function, and Bioinformatics 54(1), 49–57 (2004). DOI 10.1002/prot.10505. URLhttp://dx.doi. org/10.1002/prot.10505
49. Priami, C.: Algorithmic systems biology. Commun. ACM 52, 80–88 (2009)
50. Rives, A.W., Galitski, T.: Modular organization of cellular networks 100(3), 1128–1133 (2003). DOI 10.1073/pnas. 0237338100. URLhttp://www.pnas.org/content/100/3/1128.abstract
51. Salwinski, L., Miller, C.S., Smith, A.J., Pettit, F.K., Bowie, J.U., Eisenberg, D.: Dip: The database of interacting proteins: 2004 update. Nucleic Acids Research 32, 449–451 (2004)
52. Samanta, M.P., Liang, S.: Predicting protein functions from redundancies in large-scale protein interaction networks. Proceedings of the National Academy of Sciences of the United States of America 100(22), 12,579–12,583 (2003). DOI 10.1073/pnas.2132527100
53. Scott, J.D., Pawson, T.: Cell communication: The inside story (2000). Scientific American
54. Smith, G.P.: Filamentous fusion phage: Novel expression vectors that display cloned antigens on the virion surface. Science 228(4705), 1315–1317 (1985)
55. Spirin, V., Mirny, L.A.: Protein complexes and functional modules in molecular networks. Proceedings of the National Academy of Sciences of the United States of America 100(21), 12,123–12,128 (2003). DOI 10.1073/pnas.2032324100. URLhttp://www.pnas.org/content/100/21/12123.abstract
56. Sprinzak, E., Margalit, H.: Correlated sequence-signatures as markers of protein-protein interaction. Journal of Molecular Biology 311(4), 681–692 (2001)
57. Steffen, M., Petti, A., Aach, J., D’haeseleer, P., Church, G.: Automated modelling of signal transduction networks. BMC Bioinformatics 3(34) (2002)
58. Ucar, D., Asur, S., Catalyurek, U., Parthasarathy, S.: Improving Functional Modularity in Protein-Protein Interactions Graphs using Hub-induced Subgraphs. PKDD pp. i371–382 (2006). DOI 10.1093/bioinformatics/btm212
59. Uetz, P., Giot, L., Cagney, G., Mansfield, T.A., Judson, R.S., Knight, J.R., Lockshon, D., Narayan, V., Srinivasan, M., Pochart, P., Qureshi-Emili, A., Li, Y., Godwin, B., Conover, D., Kalbfleisch, T., Vijayadamodar, G., Yang, M., Johnston, M., Fields, S., Rothberg, J.M.: A comprehensive analysis of protein-protein interactions in saccharomyces cerevisiae. Nature 403(6770), 623–627 (2000). DOI 10.1038/35001009. URLhttp://dx.doi.org/10.1038/35001009
60. Uetz, P., Vollert, C.: Protein-Protein Interactions. Encyclopedic Reference of Genomics and Proteomics in Molecular Medicine 17, – (2006)
61. Van Dongen, S.: A new cluster algorithm for graphs. Tech. Rep. Technical Report INS-R0010, Center for Mathematics and Computer Science (CWI), Amsterdam (2000)
62. Zhao, X., Wang, R., Chen, L., Aihara, K.: Automatic modeling of signal pathways from protein-protein interaction net-works. In: The Sixth Asia Pacific Bioinformatics Conference, pp. 287–296 (2008)