The effect of synthetic bone mineral on a new bone formation around the machined surface implant placed in the normal rats
日本大学大学院松戸歯学研究科歯学専攻 佐藤 博紀
(指導:河相 安彦 教授)
Abstract
Ⅰ. Introduction
Ⅱ. Method and Result
1. Effect of a dietary supplement in distal end of femur of rat. (Research 1) 1) Animal diet
2) Animal experiment 3) Measurement item
3. 1. BMD and BMD color imaging 3. 2. Fluorescence microscopy observation 4) Statistical analysis
5) Result 5. 1. BMD
5. 2. BMD color imaging
5. 3. Fluorescence microscopy observation
2. Effect of a dietary supplement on peri-implant bone strength in a rat model of machined surface implants. (Research 2)
1) Animal diet 2) Animal experiment 3) Measurement item 3. 1. Pull-out strength
3. 2. BMD and BMD color imaging 3. 3. Quantitative real-time PCR assay 3. 4. Fluorescence microscopy observations 3. 5. Body weight
4) Statistical analysis 5) Result
5. 1. Pull out strength 5. 2. BMD
5. 3. BMD color imaging
5. 4. Quantitative real-time PCR assay 5. 5. Fluorescence microscopy observation 5. 6. Body weight
Ⅲ. Discussion
Ⅳ. Conclusion
Ⅴ. Reference
Ⅵ. Table and Figure
Abstract
Back ground
Efforts to improve the bone-implant interface to accelerate and improve the quality of osseointegration have generally focused on chemically improving the interface by incorporating inorganic phases on or into the titanium oxide layer or physically improving it by increasing the level of roughness. It is known from previous studies that some types of rough-surfaced implants, such as those coated with hydroxyapatite, may result in a higher incidence of complications. Thus, it is extremely important to study approaches for accelerating bone formation around the machined surface dental implants. Machined surface dental implants difficult to cause peri-implantitis, but enable less osteoblast proliferation and differentiation, which is important in bone formation around the implant. Watanabe found that synthetic bone mineral (SBM), a supplement developed for osteoporosis, accelerates bone formation around rough-surfaced implants in rats. However, the effect of SBM has not been investigated in rats without implants, machine surface implant. Thus, this study was aimed to investigated whether SBM is effective in eliciting bone formation in rats without implants, and to investigate whether SBM is effective for bone formation and bone metabolism around the machine surface implant.
Objective
Research 1: To confirm whether intake of SBM is effective in bone formation.
Research 2: To confirm whether intake of SBM is effective in bone formation bone formation for machined surface implant.
Material and Methods
Research 1: Twenty-four female Wistar normal rats (7 weeks of age) were randomly assigned to receive a control group fed a diet without SBM (n = 12, control) or an experimental group fed a diet with SBM (n = 12, experimental).The rats were sacrificed at 11 and 13 weeks. Bone mineral density (BMD) and fluorescent staining were assessed at the distal end of the femur. Between-group differences in BMD at 11 and 13 weeks of age were analyzed by Mann-Whitney U test.
Research 2: Twenty-four 7-week-old female Wistar rats were randomly assigned to receive a standardized diet with or without SBM (diet with SBM group and diet without SBM group, respectively; n = 12 for both). The rats underwent implant surgery at 9 weeks of age under general anesthesia. The main outcome measures BMD, pull-out strength, real-time PCR and fluorescence microscopy observations of the implant from the femur were compared at 2 and 4 weeks after implantation using the Mann-Whitney U test.
Result
Research 1: BMD in cortical bone and cancellous bone was significantly higher in rats who
received SBM than those who did not at both 11 and 13 weeks of age. Fluorescence microscopy
imaging of rats which received SBM demonstrated more green fluorescence, compared with rats
who did not receive SBM, at both 11 and 13 weeks of age.
Research 2: At 2 and 4 weeks after implantation, BMD, pull-out strength, real-time PCR and fluorescence microscopy observations were both significantly more in the diet with SBM group than in the diet without SBM group.
Conclusion
1. SBM promotes bone formation at the distal end of the femur.
2. SBM promotes bone formation of machine surface implant.
Ⅰ.
Introduction
Dental implant treatment is an effective modality to restore esthetic and masticatory functions lost due to tooth loss, but osseointegration between the implant and bone requires 3-6 months (1).
Therefore, efforts are being made to improve the bone-implant interface to accelerate and improve the quality of osseointegration. These efforts have focused on improving the interface chemically by incorporating inorganic phases on or into the titanium oxide layer, or physically by increasing the level of surface roughness (2, 3). In a consensus report published in 2009, it was concluded that
‘‘moderately rough and rough surfaces provided enhanced bone integration compared with smooth and minimally rough surfaces’’ (4). It is known from previous studies that some types of
rough-surfaced implants, those coated with hydroxyapatite, were reported to show a higher incidence of complications, peri-implantitis (5).
Simion et al. reported in their 12-year retrospective follow-up study concluded that when implants with machined surfaces are used, the risk of peri-implantitis in the posterior maxilla was less than with rough surface implants (6, 7). Machined surface dental implants difficult to cause peri-implantitis, but enable less osteoblast proliferation and differentiation. (8). These disadvantages could be addressed by using approaches aimed at accelerating bone formation around machined surface dental implants. In the past, Ogawa (9) reported that machine surface implants treated with ultraviolet light developed a unique electrostatic characteristic, acting as direct cell attractants to effectively reduce the osseointegration period without the aid of ionic or organic bridges, which is a novel physicochemical characteristic of titanium (10). Ultraviolet photofunctionalization has also been reported to improve the bone to implant contact ratio (11). In addition to these local approaches, systemic approaches such as the use of osteoporosis medication to promote bone metabolism may improve peri-implant bone formation after the surgery (12-14).
LeGeros developed synthetic bone mineral (SBM), a calcium-phosphate-based supplement incorporating magnesium (Mg), zinc (Zn), fluoride (F), and carbonate, to promote bone formation and inhibit bone resorption in osteoporosis (15, 16). On the basis of this development, one study revealed that SBM accelerated bone formation in normal rats both with and without rough surface implants (12). However, the effect of SBM on machined surface implants is unknown. Therefore, the purpose of this study was to conduct an animal study to verify how peri-implant bone formation might be improved by dietary supplementation of SBM in rats with machined surface dental implants. The null hypothesis was that bone formation, evaluated by pull-out strength, bone mineral density (BMD), relative gene expression, and fluorescence microscopy findings, around the
machined surface dental implants would not differ between rats fed diets with and without an SBM supplement.
Ⅱ.Material and Method
1. Effect of a synthetic bone mineral supplement on bone growth in the distal end of the rat
femur
1) Animal diet
AIN-93M, developed by the American Institute of Nutrition and prepared by the Oriental Yeast Co, Ltd. (Tokyo, Japan), was used as the control diet. The experimental diet consisted of AIN-93M and SBM. The SBM was prepared in accordance with the protocol published by LeGeros (15).
Briefly, a mixture of dicalcium phosphate dihydrate (CaHPO
4• 2H
2O) and magnesium and zinc chlorides (MgCl
2and ZnCl
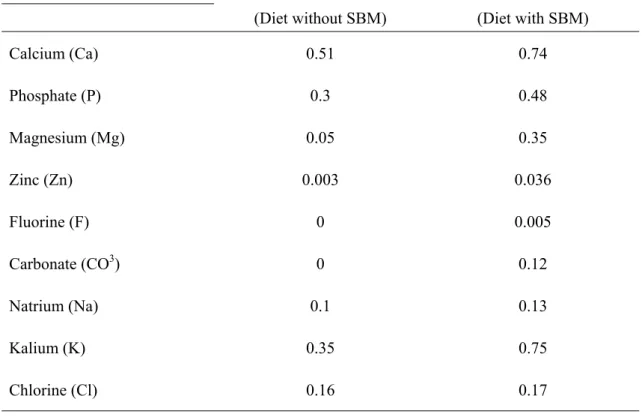
2, respectively) was hydrolyzed in double-distilled water containing dissolved potassium carbonate and sodium fluoride. SBM was then added to AIN-93M; the final mineral composition was prepared according to Mijares protocol (16). The compositions of the diets with and without SBM are shown in Table 1.
2) Animal experiment
The study protocol was approved by the Ethical Committee of Nihon University School of Dentistry at Matsudo (AP16MD004-2). Twenty-four 6-week-old femail Wistar rats (Sankyo Labo Service, Tokyo, Japan) were included in the study. After consuming a diet without SBM for 1 week during environmental acclimation, 7-week-old rats were randomly allocated into one of two groups:
a control group fed a diet without SBM (n = 12, control) or an experimental group fed a diet with SBM (n = 12, experimental). Rats were housed individually; food and water were given ad libitum, and temperature and relative humidity were maintained at 20°C ± 1°C and 50% ± 1%, respectively.
Six rats in each group were randomly selected for euthanasia at 11 and 13 weeks of age. Seven days before they were euthanized, four of these eight rats in each group were randomly selected for intraperitoneal injection of 20 mg/kg of calcein, in order to visualize new bone formation with fluorescent labeling. Four of six rats were allocated for bone mineral density (BMD) analysis. The remaining two rats were allocated for fluorescence microscopy observations.
3) Measurement item
3. 1. BMD and BMD color imaging
Imaging conditions for micro computed tomography (micro-CT, R_mCT2; Rigaku, Tokyo, Japan) were as follows: tube current: 160 µA; tube voltage: 90 kV; field of view: 10 mm; shooting time: 26 s; and voxel size: 30 µm × 30 µm × 30 µm. Micro-CT images of the femur and phantoms for CT value proofreading were taken at 11 and 13 weeks of age. The measurement region in the distal femur (6.0 mm × 5.0 mm × 3.0 mm) was 0.5 mm from the datum line connecting the two ends of the epiphyseal growth plate on the femur (Fig. 1); this was referred to as the epiphyseal region.
Additionally, measurements in the epiphyseal region were divided into cortical bone and cancellous
bone. R_mCT Image Analysis software (Rigaku 、 Tokyo, Japan) was used to generate
three-dimensional models with the scanned data. A TRI/3D-BON image analyzer (Ratoc System
Engineering, Tokyo, Japan) was used to calculate the BMD of the distal femur metaphysis cuboid; it
was also used to generate color images depicting BMD intensity, with blue/light blue, green/yellow, and orange/red representing low, medium, and high BMD values, respectively.
3.2. Fluorescence microscopy observation
The femur was cut in the epiphyseal region using a diamond disk (Isomet; Buehler Ltd., Lake Bluff, IL, USA). The bone tissue was dehydrated in a 70%-80% ethanol series followed by 100%
acetone; it was then embedded in methyl methacrylate acrylic resin (Osteoresin Embedding Kit, Wako Pure Chemical Industries, Tokyo, Japan) and cured. Embedded specimens were cut into 30 μm sections perpendicular to the long axis of the implant using a diamond disk; they were then polished to a final thickness of 20 to 30 μm, and unstained, non-demineralized specimens from the diaphyseal region were obtained. New bone formation around the implant was observed with a fluorescence microscope (BZ-9000, KEYENCE Co., Osaka, Japan).
4) Statistical analysis
Between-group differences in BMD at 11 and 13 weeks of age were analyzed by the Mann-Whitney U test. All statistical analyses were performed using the statistical package PASW Statistics (Version 18.0, SPSS, Chicago, IL, USA). P values < 0.05 were considered statistically significant.
5) Result
5. 1. Bone mineral density
Results of BMD analyses in the cortical bone are shown in Fig. 2A. The BMD of the SBM group at 11 weeks of age was 1477.5 ± 24.03 mg/cm
3, approximately 1.8-fold greater than that of the control group (841.22 ± 34.60 mg/cm
3; P < 0.05). The BMD of the SBM group at 13 weeks of age was 1552.3 ± 39.73 mg/cm
3, approximately 1.8-fold greater than that of the control group (870.55 ± 24.06 mg/cm
3; P < 0.05). Results of BMD analyses in the cancellous bone are shown in Fig. 3A. The BMD of the SBM group at 11 weeks of age was 1191.3 ± 8.41 mg/cm
3, approximately 1.8-fold greater than that of the control group (664.3 ± 25.50 mg/cm
3; P < 0.05). The BMD of the SBM group at 13 weeks of age was 1245.8 ± 16.70 mg/cm
3, approximately 1.8-fold greater than that of the control group (683.6 ± 27.88 mg/cm
3; P < 0.05).
5. 2. BMD color imaging
Color images of BMD in the cortical bone of the control group were primarily blue and green at
11 and 13 weeks of age (Fig. 2B-a and c); corresponding images were primarily yellow, with some
red and blue, in the SBM group at the same time points (Fig. 3B-b and d). Color images of BMD in
the cancellous bone of the control group were primarily blue and green at 11 and 13 weeks of age
(Fig. 3B-a and c); corresponding images were primarily yellow, with some green, in the SBM group at the same time points (Fig. 3B-b and d). Given that blue/light blue, green/yellow, and orange/red represent low, medium, and high BMD, respectively, these results indicate that the BMD of both cortical and cancellous bone was higher in the SBM group than in the control group at both time points.
5. 3. Fluorescence microscopy observation
Fluorescence microscopy imaging demonstrated more green fluorescence (indicating bone formation) in the SBM group than in the control group at both 11 and 13 weeks of age (Fig. 4).
2. Reseach 2 : Effect of A Dietary Supplement on Peri-Implant Bone Strength in A Rat Model of Machined Surface Implants
1) Animal diet
AIN-93M, developed by the American Institute of Nutrition Committee and prepared by the Oriental Yeast Co, Ltd. (Tokyo, Japan), was used as the control diet. The experimental diet consisted of AIN-93M and SBM. The SBM was prepared according to LeGeros’ protocol (15). Briefly, a mixture of dicalcium phosphate dihydrate (CaHPO
4• 2H
2O) and magnesium and zinc chlorides (MgCl
2and ZnCl
2, respectively) was hydrolyzed in double-distilled water containing dissolved potassium carbonate and sodium fluoride. SBM was then added to AIN-93M, the mineral
composition of which was adjusted using Mijares’ method (16). The compositions of the diets with and without SBM are shown in Table 1.
2) Animal experiment
The study protocol was approved by the Ethics Committee of Nihon University School of Dentistry at Matsudo (AP15MD004-1). Twenty-four 6-week-old femail Wistar rats (Sankyo Labo Service, Tokyo, Japan) were included in the study. After consuming a diet without SBM for 1 week to acclimate to the changes in their environment, the 7-week-old rats were randomly allocated into one of two groups: a control group fed a diet without SBM (n = 12, control) or an experimental group fed a diet with SBM (n = 12, experimental).The rats were housed individually; food and water were given ad libitum, and temperature and relative humidity were maintained at 20° C ± 1° C and 50% ± 1%, respectively.
All rats underwent implant surgery on their femurs at 9 weeks of age while under general anesthesia
administered via an intraperitoneal injection of medetomidine, midazolam, and butorphanol. One
operator prepared a hole in the femur 1.2 mm in diameter and 2.5 mm deep using a 1.2 mm diameter
drill. The implants were then inserted into the hole to a depth of 2.5 mm using a drill at a speed of
500 rpm, with saline irrigation to avoid heating the bone. The remaining 1.5 mm of the implant was
covered by muscle rather than bone, and used for the connection to the load cell to measure the pull-out strength. The incision wound was sutured after completion of the surgery.
Seven days before euthanasia at 2 and 4 weeks, two rats were randomly selected to receive a 20 mg/kg injection of calcein intraperitoneally for visualization of new bone formation using
fluorescent labeling. Six rats in each group were randomly selected for euthanasia at 2 weeks and 4 weeks after implantation. Four of these six rats were allocated for pull-out testing, BMD analysis, and quantitative real-time PCR. The remaining two rats were allocated for fluorescence and histological microscopic observations.
3) Measurement item 3. 1. Pull-out strength
The pull-out test was conducted to evaluate the adhesive strength between the implant body and the bone. The titanium specimens were mechanically anchored to a baseplate with self-curing resin.
The setup was adjusted using a level to align the test area with the load cell such that the direction of the exerted force was as perpendicular as possible, thereby minimizing shear forces. A 110 mm long stainless-steel wire was threaded through the hole at the top of the implant and connected to the load cell, with 50 mm separating the top of the implant and load cell. An Instron universal testing
machine (TG-5k; Minebea Co., Kanagawa, Japan) was used for the pull-out test with a 1.0 mm/min cross head speed. Pull-out strength was determined as the peak force (newton, N) applied to detach the implant from the bone.
3. 2. BMD and BMD color imaging
BMD and BMD color imaging were performed to quantify and visualize the bone density around the implant body. After the pull-out test, the femur was subjected to microcomputed tomography (mCT) scanning performed with an R_mCT2 device (Rigaku, Tokyo, Japan) using a 90 kV anode electrical current at a 30 μm resolution. The isotropic voxel resolution was 30 μm × 30 μm × 30 μm.
To verify new bone formation around the implant, a 1.5 mm
2area surrounding the bone where the 1.2 mm implant was placed was scanned at a depth of 0.5-1.0 mm from the inner cortical bone. Thus, a cuboid of peri-implant bone with a 1.5 × 1.5 mm base and a 0.5 mm height was used to analyze BMD. R_mCT Image Analysis software (Rigaku, Tokyo, Japan) was used to generate
three-dimensional models using the scanned data. A TRI/3D-BON image analyzer (Ratoc System Engineering, Tokyo, Japan) was used to calculate the BMD of the peri-implant bone cuboid and generate color images depicting BMD intensity, with blue and light blue, green and yellow, and orange and red representing low, medium, and high BMD values, respectively.
3. 3. Quantitative real-time polymerase chain reaction assay
Quantitative real-time PCR assay was performed to evaluate the metabolic activity of osteoblasts by the effect of SBM. After mCT scanning, osseous tissues surrounding the implant were used for quantitative real-time PCR (qRT-PCR) testing to explore the potential molecular mechanisms at 2 and 4 weeks after implantation of the fixture. Total RNA was isolated using TRIzol (Invitrogen, Carlsbad, CA) according to the manufacturer’s instructions. At an absorbance of 260 nm, RNA concentration was detected using a NanoDrop spectrophotometer (ND-1000; Thermo Fisher Scientific, Waltham, MA, USA). Reverse transcription was performed, and complementary DNA (cDNA) was synthesized using up to 1 μg of isolated RNA, by a Prime Script RT reagent Kit (Takara, Tokyo, Japan) according to the manufacturer’s protocol. The qRT-PCR assay was performed using an SYBR Premix Ex Taq (Takara, Tokyo, Japan). GAPDH was employed as a housekeeping gene, and the primer sequences used in this study are listed in Table 2. The relative gene expression of an alkaline phosphatase (ALP), collagen type 1, and osteocalcin were used as outcomes.
3. 4. Fluorescence microscopy observations
Fluorescence microscopic observation was carried out in order to visually evaluate the bone formation over time due to the effect of SBM. The femur was cut at the midpoint of the long axis using a diamond disk (Isomet; Buehler Ltd., Lake Bluff, IL, USA). The bone tissue was dehydrated in a 70-80% ethanol series followed by 100% acetone, embedded in methyl methacrylate acrylic resin (Osteoresin Embedding Kit; Wako Pure Chemical Industries, Tokyo, Japan), and cured.
Embedded specimens were cut into 30-μm sections perpendicular to the long axis of the implant using a diamond disk, polished to a final thickness of 20 to 30 μm, and unstained, nondemineralized specimens from the diaphyseal region were obtained. New bone formation around the implant was observed with a fluorescence microscope (BZ-9000; Keyence Co., Osaka, Japan).
3. 5. Body weight
Weight measurements were carried out to evaluate the health of the rats. All 24 rats were weighed at 7, 9, and 11 weeks old; the 12 surviving rats were also weighed at 13 weeks old to confirm growth and good physical condition. Rats were also weighed before euthanasia.
4) Statistical analyses
Between and within-group differences in BMD, pull-out strength, and relative gene expression at
2 and 4 weeks after implantation were analyzed by using the Mann-Whitney U test. Changes in body
weight were separately analyzed by using the Friedman test to verify whether weight significantly
changed over time in each group. All statistical analyses were performed using the statistical
package PASW Statistics (Version 18.0, SPSS, Chicago, IL, USA). P values < 0.05 were considered
statistically significant.
5) Result
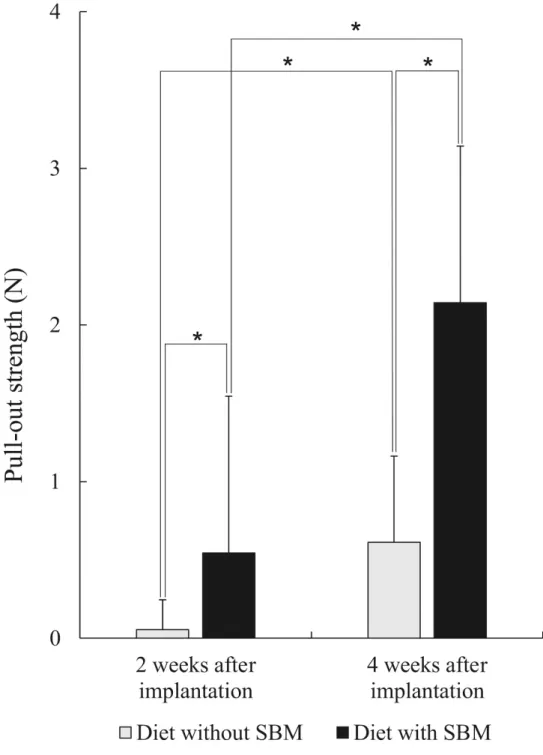
5. 1. Pull-out strength
Results of the pull-out strength test are given in Fig. 5. The pull-out strength in the diet with SBM group at 2 weeks after implantation was 0.55 ± 0.14 N, approximately 9.9 times greater than that in the diet without SBM group (0.06 ± 0.14 N; between-group comparison, P < 0.05). The pull-out strength in the diet with SBM group at 4 weeks after implantation was 2.14 ± 0.38 N, also approximately 3.4 times greater than that in the diet without SBM group (0.61 ± 0.25 N;
between-group comparison, P < 0.05). Both diet groups showed statistically significant increases in pull-out strength 2 to 4 weeks after implantation (within-group comparisons, P < 0.05).
5. 2. Bone mineral density
BMD results are shown in Fig. 6. The BMD in the diet with SBM group at 2 weeks after implantation was 320.62 ± 25.35 mg/cm
3, approximately 1.2 times greater than that in the diet without SBM group (248.43 ± 19.07 mg/cm
3; between-group comparison, P < 0.05). The BMD in the diet with SBM group at 4 weeks after implantation was 454.77 ± 25.07 mg/cm
3, approximately 1.1 times greater than that in the diet without SBM group (396.85 ± 17.70 mg/cm
3; between-group comparison, P < 0.05). Both diet groups also showed statistically significant increases in BMD from 2 to 4 weeks after implantation (within-group comparisons, P < 0.05).
5. 3. BMD color imaging
The BMD color image in the diet without SBM group was primarily blue and green at 2 and 4 weeks after implantation (Figs. 7-a and c), but the image in the diet with SBM group was primarily yellow, with some red and blue, at the same time points (Figs. 7-b and d). Given that blue/light blue, green/yellow, and orange/red represent low, medium, and high BMD, respectively, these results indicate that the BMD of peri-implant bone was higher in the diet with SBM group than in the diet without SBM group.
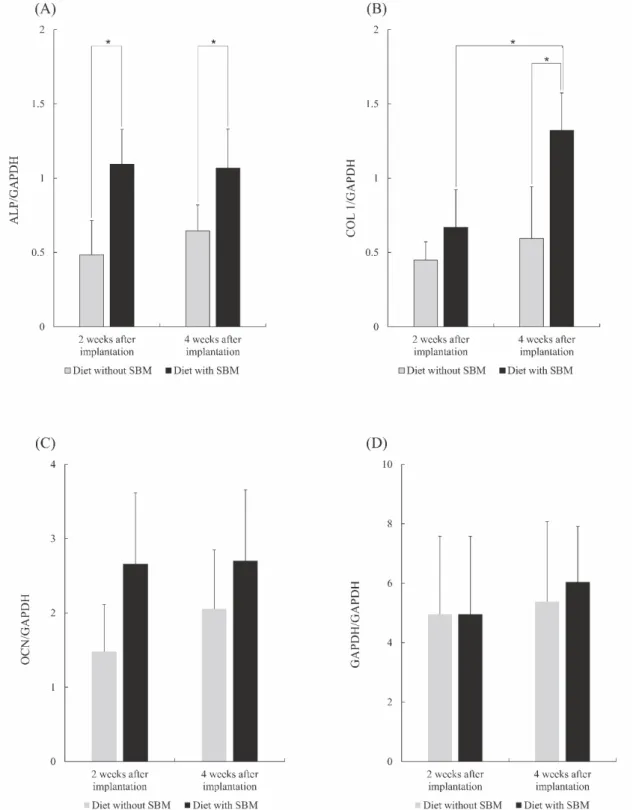
5. 4. Quantitative real-time PCR assay
The qRT-PCR data are presented in Fig. 8. The ALP expression level in the diet with SBM group at 2 weeks after implantation was 1.09 ± 0.23, approximately 2.2 times greater than that in the diet without SBM group (0.48 ± 0.23; between-group comparison, P < 0.05). The ALP expression level in the diet with SBM group at 4 weeks after implantation was 1.07 ± 0.26, approximately 1.6 times greater than that in the diet with SBM group (0.64 ± 0.17; between-group comparison, P < 0.05).
Both diet groups showed no statistically significant increases from 2 to 4 weeks after implantation (within-group comparisons, P < 0.05).
The COL 1 expression level in the diet with SBM group at 2 weeks after implantation was 0.66 ± 0.25, approximately 1.4 times greater than that in the diet without SBM group (0.44 ± 0.12;
between-group comparison, P < 0.05). The COL 1 expression level in the diet with SBM group at 4
weeks after implantation was 1.32 ± 0.25, approximately 1.6 times greater than that in the diet with SBM group (0.59 ± 0.34; between-group comparison, P < 0.05). The diet with SBM group showed a statistically significant increase in COL 1 expression level from 4 weeks after implantation
(within-group comparisons, P < 0.05).
The OCN expression level was not significantly higher in the diet with SBM group than in the diet without SBM group at 2 and 4 weeks after implantation (P < 0.05). Both diet groups showed no statistically significant increase in OCN expression level from 2 to 4 weeks after implantation (within-group comparison, P < 0.05).
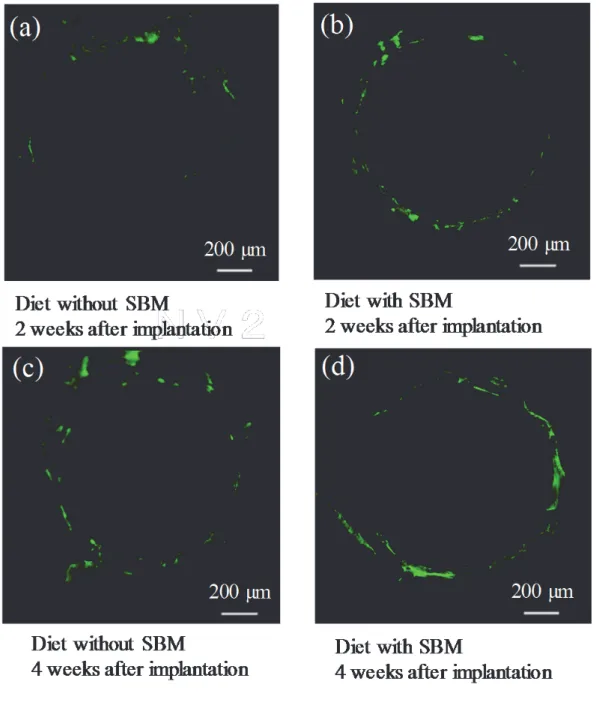
5. 5. Fluorescence microscopy observation
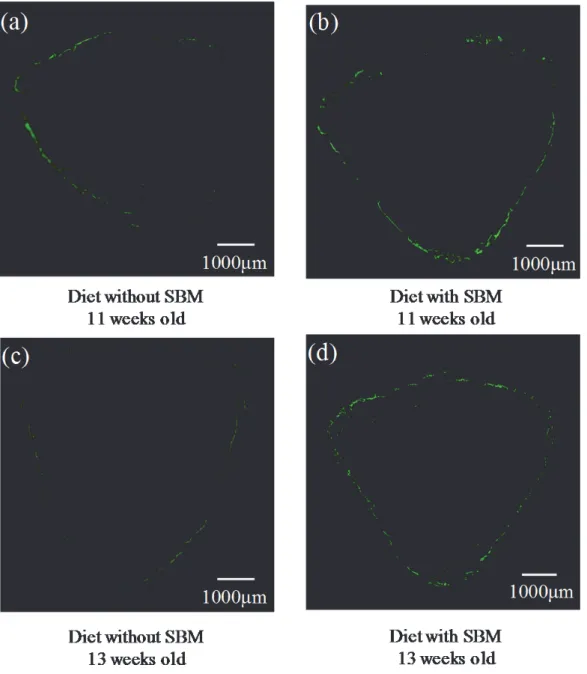
Fluorescence microscopy imaging in the diet with SBM group demonstrated more green fluorescence (indicating bone formation) than that in the diet without SBM group at both 2 and 4 weeks after implantation (Fig. 9). As the rats aged from 2 to 4 weeks (Figs. 9a and c, and 9 b and d, respectively), the green fluorescence became more pronounced in both diet groups.
5. 6. Body weight
Body weight comparisons are given in Fig. 10. The body weights in both diet groups increased significantly over the feeding period (Fig. 10; Friedman test, P < 0.0001). The Mann-Whitney U test indicated no significant body weight difference between the groups at 2 or 4 weeks after
implantation (P > 0.05), but also revealed significant within-group increases in body weight from 2 to 4 weeks in both groups (P < 0.05).
III
.Discussion
These two animal studies revealed that in a rat model of machined surface implants, dietary supplementation with SBM resulted in greater peri-implant BMD and pull-out strength in
comparison with the results associated with a normal diet, suggesting that SBM could contribute to bone formation around implants. The objective of research 1 was to effect of SBM on healthy rats on osteogenic effect was evaluated using BMD, BMD color imaging, fluorescence microscopy
observation. The objective of research 2 was to effect of intake of SBM is effective in bone formation for machined surface implant. The research 1 revealed that to increased BMD was observed qualitatively in BMD color images of rats in the SBM group at 11 and 13 weeks of age, where the majority of areas showed increased bone formation. This finding could be partially explained by the results of fluorescence microscopy imaging, which revealed the dynamics of bone remodeling through incorporation of calcein fluorescent dye. Green fluorescence was observed at 11 weeks of age solely in the SBM group, whereas it was observed at similar levels in both groups at 13 weeks of age; this suggested that rats that were fed SBM showed a greater extent of bone formation.
The sole difference between the two groups was whether they had been fed SBM. Therefore, the
difference of BMD mineral composition, 7-fold greater Mg content and 12-fold greater Zn and F
content in the SBM group, may primarily affect bone formation. Mg, Zn, and F play important roles
in bone formation and resorption. Mijares et al (16). stated that the effect of SBM may be explained in terms of individual and combined effects of Mg, Zn, and F on bone cell activities, such as bone formation and bone resorption when released from the SBM, as well as their effects when
incorporated in newly formed bone. This may explain why rats in the SBM group have greater BMD than rats in the control group and promote bone formation.
The research 2 revealed that in a rat model of machined surface implants, dietary supplementation with SBM resulted in greater peri-implant BMD and pull-out strength in
comparison with the results associated with a normal diet, suggesting that SBM could contribute to bone formation around implants. These findings highlight the potential of oral supplements to accelerate bone formation after machined surface dental implant surgery in patients. The rats that received SBM supplementation showed 9.9 and 3.4 times greater pull-out strength at 2 and 4 weeks after implantation, respectively, than those without SBM supplementation. Because the presence of SBM in the feed was the only difference in the intervention between the groups, the observed difference in pull-out strength might be attributable to the promotion of bone formation by SBM.
Given that the body weights of both groups significantly and steadily increased during the feeding period, the rats seemed to grow normally. Some increased bone formation may be explained by the growth of the rats; however, similar growth curves were observed in both groups, suggesting that SBM worked mainly by reinforcing the bone, not by increasing body weight. To investigate the influences on pull-out strength in greater depth, BMD measurements, BMD color imaging data, and fluorescence microscopy observations were analyzed. As the degree of increase in pull-out strength and BMD were similar, the increase in BMD may have resulted in the increased pull-out strength.
From the results of research 1, it may explain why SBM fed rats showed greater BMD than rats fed normal diet, because SBM is accelerate bone formation.
BMD color images also indicated that new bone growth around the implants was greater in the diet with SBM group than in the diet without SBM group. Color imaging (Figs. 7-b and d) visually suggested that the implants were surrounded and fixed more quickly in the diet with SBM group, likely resulting in the observed rapid increase in pull-out strength. This finding is consistent with the results of the fluorescence microscopy imaging (Fig. 9), which showed the dynamics of bone remolding via the administration and subsequent incorporation of calcein fluorescent dye. This might also be one reason why osteoblast relative gene expression growth around the implants was greater in the diet with SBM group than in the diet without SBM group.
There is an ongoing effort to improve the interface between bone and implant in order to accelerate and improve the quality of osseointegration. However, once peri-implantitis occurs, the factors benefiting bone integration can turn into risk factors exacerbating inflammation around implant fixtures. SBM was originally developed for the prevention and treatment of osteoporosis.
Therefore, from the perspective of implant treatment, the SBM supplement appears to be a
promising subject for further study. Within its limitations, this study concludes that the dietary supplement SBM developed for osteoporosis was effective in accelerating peri-implant bone formation of machined surface implants during the healing period after implantation.
IV
.Conclusions
The result of the summarized researchs revealed and suggested the following.
1. SBM promotes bone formation at the distal end of the femur.
2. SBM promotes bone formation of machine surface implant.
V. References
1. Johansson C, Albrektsson T: Integration of screw implants in the rabbit: a 1-year follow-up of removal torque of titanium implants.
Int J Oral Maxillofac Implants, 2: 69-75, 1987.
2. Rani VV, Vinoth-Kumar L, Anitha VC, Manzoor K, Deepthy M, Shantikumar VN:
Osteointegration of titanium implant is sensitive to specific nanostructure morphology. Acta biomater, 8:
1976-1989, 2012.
3. Le Guehennec L, Soueidan A, Layrolle P, Amouriq Y: Surface treatments of titanium dental implants for rapid osseointegration. Dental mater, 23: 844-854, 2007.
4. Lang NP, Jepsen S: Implant surfaces and design (Working Group 4). Clin Oral Implants Res, 20 Suppl 4: 228-231, 2009.
5. Piattelli A, Cosci F, Scarano A, Trisi P: Localized chronic suppurative bone infection as a sequel of peri-implantitis in a hydroxyapatite-coated dental implant. Biomaterials, 16: 917-920, 1995.
6. Simion M, Nevins M, Rasperini G, Tironi F: A 13- to 32-year retrospective study of bone stability for machined dental implants. Int J Periodontics Restorative Dent, 38: 489-493, 2018.
7. Simion M, Gionso L, Grossi GB, Briguglio F, Fontana F: Twelve-year retrospective follow-up of machined implants in the posterior maxilla: radiographic and peri-implant outcome. Clin Implant Dent Relat Res, 17 Suppl 2: e343-351, 2015.
8. Babuska V, Palan J, Kolaja Dobra J, Kulda V, Duchek M, Cerny J, et al.: Proliferation of Osteoblasts on Laser-Modified Nanostructured Titanium Surfaces. Materials, 11, 2018.
9. Ogawa T: Ultraviolet photofunctionalization of titanium implants. Int J Oral Maxillofac Implants, 29: e95-102, 2014.
10. Suzuki S, Kobayashi H, Ogawa T: Implant stability change and osseointegration speed of immediately loaded photofunctionalized implants. Implant dent, 22: 481-490, 2013.
11. Tabuchi M, Ikeda T, Nakagawa K, Hirota M, Park W, Miyazawa K,Goto S, Ogawa T:
Ultraviolet photofunctionalization increases removal torque values and horizontal stability of orthodontic
miniscrews. Am J Orthod Dentofacial Orthop, 148: 274-282, 2015.
12. Watanabe T, Nakada H, Takahashi T, Fujita K, Tanimoto Y, Sakae T, Kimoto S, Kawai Y:
Potential for acceleration of bone formation after implant surgery by using a dietary supplement: an animal study. J Oral Rehabil, 42: 447-453, 2015.
13. Takahashi T, Watanabe T, Nakada H, Sato H, Tanimoto Y, Sakae T, Kimoto S, Mijares DQ, Zhang Y, Kawai Y: Improved Bone Micro Architecture Healing Time after Implant Surgery in an Ovariectomized Rat. J hard tissue biol, 25: 257-262, 2016.
14. Takahashi T, Watanabe T, Nakada H, Tanimoto Y, Kimoto S, Mijares DQ, Zhang Y, Kawai Y:
Effect of a dietary supplement on peri-implant bone strength in a rat model of osteoporosis. J Prosthodont Res, 60: 131-137, 2016.
15. LeGeros RZ: US 7,419,680,B2 (submitted 2004, issued September 2, 2008). US 2009/0068285A1 (CIP, March 12, 2009). Calcium phosphate-based biomaterials incorporating magnesium, zinc, fluoride and carbonate., Patent. 2008.
16. Mijares D, Kulkarni A, Lewis K, Yao F, Xi Q, Tannous S,Dias R, LeGeros RZ: Oral bone loss induced by mineral deficiency in a rat model: effect of a synthetic bone mineral (SBM) preparation. Arch Oral Biol, 57: 1264-1273, 2012.
17. Inoue M, LeGeros RZ, Inoue M, Tsujigiwa H, Nagatsuka H, Yamamoto T, Nagai N: In vitro response of osteoblast-like and odontoblast-like cells to unsubstituted and substituted apatites. J Biomed Mater Res A, 70: 585-593, 2004.
Ⅵ