1
Evaluating the Effects of Career-oriented Education on Academic Performance and Employment Outcome
- A statistical analysis based on students’ data - †
Yasushi Tanaka
Kyoto Sangyo University, Faculty of Economics and Center of Research and Development for Cooperative EducationThe Centre of Research and Development for Cooperative Education at Kyoto Sangyo University (KSU) has gathered the data of all 5473 students who graduated in 2008 and 2009, through which we can trace how well he/she performed academically, whether he/she took career-oriented education programme, and how he/she managed the job hunting.
This paper is an attempt to verify the causal relationships among these factors by using a statistical analysis on the KSU students’ data and thus to suggest to academics and practitioners concerned one way to assess the career-oriented education programme.
Based on this huge and detailed set of data on individual students, we performed a regression analysis to test following three hypotheses; Hypothesis 1: “Career-oriented education helps to obtain a good job,”
Hypothesis 2: “Career-oriented education raises academic performance,” and Hypothesis 3: “Good students do well at university, anyway.” Our data showed a set of statistical results in favour of all of the three hypotheses.
Keywords: Academic performance, Employment outcome, Career-oriented education, Statistical
analysis
1. Introduction
The concept of Career-oriented Education (better known as Career Education in Japan) started drawing attention of educators and industrialists approximately 10 years ago, when the Ministry of Education, Culture, Sports, Science, and Technology introduced it in the Report of Central Educational Council in 1999. Its popularity grew steadily helped by two recent socioeconomic trends in Japan, despite being somewhat behind the rest of the industrial nations. One was the lack of financial resource to train employees by companies. Japanese companies typically offered a lifetime employment to newly recruited employees and train them at their own expense. But the companies became increasingly cautious to use their financial resource for such investment
for the uncertain future, as a result of the long economic downturn after the collapse of bubble economy during 1990’s.
So there was a need for someone to train the potential
employees. The other trend was the lowering ability standard
of university graduates. The Ministry of Economy, Trade, and
Industry has been pointing out in the same period that
university graduates tend to lack “Basic social skills,” the
term equivalent to generic or soft skills. This is not unrelated
to the rising enrolment rates of universities and colleges,
which exceeded 50% by 2005, and to the fact that many
universities and colleges find it necessary to offer remedial
programmes in recent years. It is probably safe to say that
after the 10 years both career education and basic social skills
are becoming integral parts of higher education as well as of
workplace in Japan. And yet there is no hard fact to verify the
effectiveness of such programmes.
At Kyoto Sangyo University (KSU) we have started to gather individual data on each student since 2009, in which student’s attributes such as the pre-entry background, the academic performance during the university career, as well as the employment outcome after graduation are collected.
These data if properly used can help construct an academic programme at KSU that responds to the need of Japanese society today.
The present paper makes use of some of the data in order to specifically verify the effectiveness of career education programme at KSU.
2. Kyoto Sangyo University and its career education programme
Kyoto Sangyo University is a private university, which was established in 1965 with Faculties of Economics and Science, and by 2011 there are 9 faculties in all --- Economics, Science, Business Administration, Law, Foreign languages, Cultural Studies, Engineering, Computer Science and Engineering, and Life Science. We have 393 full-time academic staff, 399 full-time administrative staff and 12961 undergraduate and 251 post-graduate students as of may 2011. Undergraduate courses are for 4 years and the academic year starts in April and end in March of the following year in Japan. .
Since 1999, KSU has been offering to its students a range of career education courses based on domestic internships.
But the significant step was taken when the government approved and funded our new project on career education in 2004, with a help of which the Center of Research and Development for Cooperative Education was set up. Since then, the programme expanded and as of 2009 there are 20 courses. Of the 20 courses, 11 are Work-integrated Learning WIL) courses, e.g. Internships 1~5, in which students have direct contacts with industries, while 9 are induction courses, e.g. University life and career choice, Business Challenges of 21st century, to prepare students towards working life.
3. Basic data
The data has been collected from all 5473 undergraduate students who graduated in March of 2008 and 2009, --- 2739 and 2734 respectively. Of the total 5473, 3781 were male and
1692 were female from 7 faculties i.e. Economics, Business, Law, Foreign Languages, Cultural Studies, Science, and Engineering. From the original panel data of each student, we use annual GPAs, whether he/she has taken career education courses, and the employment outcome. Here is the brief description.
(i) Annual GPAs over 4 years: The average annual GPAs for the 4 years of undergraduate courses are 1.90, 1.74, 1.90, and 1.53. The 1st year’s GPA may be used to represent the student’s academic ability before coming to university. This is because we cannot trace detailed data on students’
pre-university academic performance --- we do not have a national examination to include in the data every high school leaver such as A levels and O levels in UK, and we assume that the 1st year GPA depends heavily on the pre-university achievement. The 3rd year’s GPA is used to identify the academic progress during the undergraduate years. The 3rd instead of the 4th year is used, due to a rather peculiar Japanese situation where many students manage to attain the necessary units to graduate by the end of 3rd year to spend almost an entire 4th year for job hunt, so that their 4th year’s GPAs do not reflect their academic ability.
(ii) Career education: the total number of registrations for these courses is 5132, with 1190 in WIL courses, which offer direct contacts with companies through internships, and 3942 in inductive courses, which introduce to students various aspects of working life. In terms of student number, 1789 took one career education course and 1275 took two or more, while 2409 took none.
(iii) Employment outcome: We look at this from two different angles. First, the students were asked upon graduation whether they have obtained full-time (or permanent) employment or, part-time (or temporary) employment or otherwise. Because of Japan’s life-time employment tradition students tend to prefer the full-time to part-time employment. Out of 5473 students, 4432 were in full-time employment, 462 were in part-time employment, 170 went to graduate school, and 409 with neither of these.
Second, the companies were categorized as Listed and
Unlisted, where the former tend to be with more prominent
companies and be preferred by students. 1423 students went
to listed companies and 2778 went to unlisted ones, while we
could not specify 1272 cases. Although it has no direct
significance to our analysis, the main industries in the
breakdown of 4432 students’ placements by industry are;
Finance and Insurance 949, Wholesale and Retail 922, Manufacturing 782, Information 359, Services 339. It needs to be mentioned that although these figures solely refer to the students at KSU, it is not very far from the general outlook of the Japanese students as a whole.
4. Hypotheses
The main theme of this paper is to determine the effects of career education on students’ academic performance during undergraduate years as well as on their employment outcome upon graduation. Therefore our main hypotheses would be;
Hypothesis 1: “Career education helps to obtain a good job.”
Hypothesis 2: “Career education raises academic performance.”
The first is a necessary requirement for the career education to exist. Even if it holds, however, some may feel that it does not help academic performance. For example, an emphasis on career education is sometimes not met by full support of academics in Japan because some feel that it does not bring about a positive and direct effect on academic performance. So it is crucial for the advocates of career education to prove it is not the case, i.e. to verify the hypothesis 2, to earn more support of their colleagues.
In order to prove an effectiveness of career education programme, there is one other hypothesis to check;
Hypothesis 3: “Good students do well at university, anyway.”
If this were true, all our effort to improve the students’
outcome would be meaningless, let alone the career education programme. So it is important to clarify that our effort is worthwhile by somehow negating this hypothesis.
In fact, this line of argument is all very familiar to labour economists by the concepts of “human capital investment”
and “signalling” in labour economics. Human capital investment is a concept to explain one’s decision to pay for education in the expectation that his/her productivity and wage will rise in future, just as in monetary investment. For example, one decides to go to university as long as his/her wage differential with a high school leaver is greater than the cost of university education he/she has to pay.
Some argue, however, that education is a credential rather than capital formation (or productivity raising) and consider it
as signalling. The idea is that people are different and we do not have perfect information about the difference among them, so that a job seeker needs an educational credential to
“signal” his/her productive ability, or equivalently a recruiting firm needs to “screen” the applicant’s productive ability.
There is a large volume of theoretical as well as empirical research in labour economics in this issue. (For example, see Becker 1964 or Mincer 1974)for the original work on human capital theory, Spence (1973) for an intuitive and clear introduction of signalling, and Borjas (2008) for introductory treatment of the both.)
Empirically, however, it is difficult to differentiate the human capital effect and signalling effect of education, since the both raise one’s employment outcome, i.e. one could get a good job based on receiving education because he/she becomes productive through human capital formation and/or because the prospective employer recognizes his/her innate productivity.
We therefore construct 3 hypotheses based on the concepts of human capital and signalling as follows;
Hypothesis 1: “Career education helps to obtain a good job.”
Career education helps to obtain a good job, through forming practical human capital skills and/or signalling the prospective employer his/her innate practical skills.
Hypothesis 2: “Career education raises academic performance.”
Career education helps to obtain high academic performance rather than the former preventing the latter.
Hypothesis 3: “Good students do well at university, anyway.”
If this holds, higher education acts a signal rather than human capital. Thus universities do not nurture students.
5. Variables
For estimation, we use following variables.
5.1. Dependent variables
(i) Employment outcome: measured by a binary choice dummy variable in terms of a job status with 1 if full-time and 0 if otherwise, or a company status with 1 if the company is listed and 0 if otherwise.
(ii) Academic performance: measured by average GPA in
the 3rd year instead of the 4th and final year. This is because many students obtain the required number of units for graduation by the end of the 3rd year, so that they can concentrate on job hunting in the final year.
5.2. Independent variables
(i) Faculty: a dummy variable for each faculty except for Engineering Faculty
One would naturally expect employment outcome to differ among students of different faculties due to the supply and demand interactions for labour markets with the special skills, although it is not easy to predict which faculty does better, i.e.
the signs of the coefficients. There may be also faculty based variation due to difference among the ability distributions of students by faculty.
(ii) Sex: a dummy variable with 1 if male and 0 if female Despite the Japan’s official declaration of equal opportunity for male and female in employment since 1985 and with its several amendments, female graduates still face employment discrimination in a form of what is known as
‘statistical discrimination’ in the labour economics literature.
This is based on two idiosyncratic aspects of female labour force in Japan. First, many female employees quit the job for marriage, expecting a baby or nurturing a small child, and come back to labour market afterwards, which generates Japan’s peculiar “M-shaped” labour participation curve only shared presently by few countries such as Korea. Second, this induces employers to give the priority to male applicants especially if any training at work is offered, since the female’s discontinuity at work could greatly reduce the effectiveness of such on-the-job training. So we would expect it to be positively significant. As for academic performance, there should not be an obvious reason to distinguish by sex.
(iii) Year of graduation: a dummy variable with 1 if 2009 and 0 if 2008
Employment prospects and outcomes are heavily influenced by the economic fluctuations. Particularly, one should be careful about the effect of the recent US subprime problem. Or we might see some subtle difference in an ability distribution of students from year to year.
(iv) Academic performance at the 1st year (GPA1) and the 3rd year (GPA3): GPA1 is used as a proxy to measure student’s academic level before entering university while GPA3 is used to measure student’s academic level he/she has
achieved at university. Generally, we expect they have positive effects on the dependent variables.
(v) Career education
This is the main theme of this research and we look at this from three angles because of the way we organize Career Education programme at KSU. First, we see if the number of courses a student takes matter. We expect that the more courses a student takes the better they perform academically and at job hunt. Second, we single out WIL courses to see if taking any is effective by using a dummy variable. Thirdly, the effect of inductive courses is examined with a dummy variable. As we work with career education programmes, we hope the effects on academic performance and employment outcome to be positive and significant.
6. Estimation and the results
Out of the total of 5473 students, we left out those without GPA results for 4 years in a row due to reasons such as study abroad or illness, to have 5160 samples. Regressions were estimated with employment status (i.e. Full-time or not), company status (i.e. listed or not), or GPA in the 3rd year as a dependent variable. The employment status regression has 4616 samples by leaving out 544 students who have opted for other activities such as going to graduate school, while company status regression has 3965 samples by leaving out 1195 students who have opted for other activities such as working for public sectors.
The causal relationship between dependent and independent variables were estimated using “Ordinary Least Square” method with a statistical package “EView.” The estimated equations were “Linear Probability Model” for employment outcome i.e. Job status and company status, and
“Linear Model” for academic performance i.e. GPA3. The results appear in Table I, II, and III respectively.
When the dependent variable is a binary choice as in our employment outcome, the model contains heteroskedasticity.
In such a case, usual t-values need to be replaced by
heteroskedasticity-robust t-values. The existence of homo-
skedasticity was rejected in all equations in Table I and II
using Breusch-Pagan-Godfrey test, and therefore the t-values
were replaced by heteroskedasticity-robust t-values, although
these t-values were very closed to the usual t-values, as it is
often pointed out. (See Wooldridge (2006) for the problem of
and solution to heteroskedasticity)
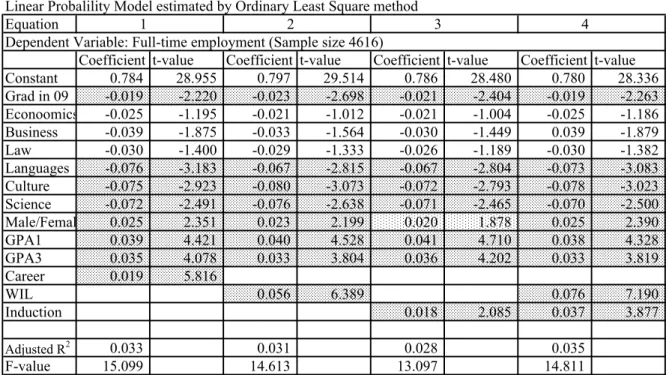
Table I shows the estimation results with employment status as dependent variable and a set of independent variables appear along the first column, with 4 equations to allow a variation in the definition of career education, i.e.
career education, WIL, and/or inductive courses. Several observations are worth noting. First, adjusted R square values to check the fitness of the model to data is around 3%, which is not particularly high --- textbook examples tend to give values between 60~90% for time series. However, it is not rare for a cross-section analysis with a sample of this large size to have this value. In any case, F-value below supports the validity of the estimation. Turning to the coefficients, most of them show t-values to imply significance at 5%, apart from the faculty difference for Economics, Business,
㻌and Law. The year of graduation seems to matter --- in equation 1, for example, if you graduate in 2009, your probability of obtaining a full-time employment is 1.9%
below those in 2008. The faculty difference seems to exist between engineering students and others with engineering students performing better than all others, as the coefficients are all negative. But the results are significant only for Languages, Culture, or Science students. Sex seems to affect the employment prospect with being male student significantly raising the probability by 2.2~2.5% in equations 1~4. This result was expected, although not notably high, with the existence of statistical discrimination in the graduate labour market in Japan.
Now turning to the variables of main interest, GPA’s seem to be significant factors for employment outcome.
Academically competent students with higher GPA1 and /or GPA3 do well for job hunt and GPA1 seems to have slightly bigger impact than GPA3, e.g. 0.039 and 0.035 in Equation 1.
It seems to suggest that both the pre-university achievement and university achievement raise the full –time employment probability. As far as career education is concerned, their effects are all positive and significant --- for example, one more career education course seems to raise the employment prospect by 1.9%. And WIL course is about twice as effective as inductive course, i.e. 7.6% and 3.7%. This last set of results confirms Hypothesis 1: “career education helps to obtain a good job.”
Table II is just the same as Table I except for the dependent variable. It is a company status rather than employment status.
General results are similar but somewhat weaker.
Table III shows the estimation results of regressing GPA3 on GPA1 and career education as well as students’ other traits.
The coefficients and t-values for the variables are quite similar over the 5 equations. The discrepancy in GPA3 due to graduation year may be caused by the marking inconsistency between 2008 and 2009, or by 2009 students being less academically competent than 2008 students --- this is a plausible hypothesis as the general academic level seems to continue falling. The faculty difference is a more worrying result. For example, the gap between students in Faculties of Culture and Economics in Equation 1 is 0.229 - (-0.104) = 0.333, which is a considerable size for GPA. Again this is either or both because of a difference in marking standard and students’ academic standard. It is an important issue but also outside of the scope of this paper. Male students seem to perform worse academically as the coefficients are all negative and significant --- a clear contrast to the employment cases of Tables I & II.
The estimate for GPA1 is very important for our purpose.
It says higher GPA1 implies higher GPA3 and the relationship is significant. More specifically, 1 point rise in GPA1 generates just below 0.6 point rise in GPA3. This supports Hypothesis 3: “Good students do well as university anyway,” not to full but to some extent, leaving some room for hard work during university years.
Finally, career education coefficients show different results
--- career education as a whole has no notable effect on GPA3,
WIL is positive and significant, and Induction courses are
negatively related to GPA3. The later may be due to that fact
that induction courses are sometimes taken as remedial
courses by students with low GPA. More importantly,
positive and significant coefficients on WIL in equations 3
and 5 support the Hypothesis 2: “Career education raises
academic performance.”
Linear Probalility Model estimated by Ordinary Least Square method
Equation 1 2 3 4
Dependent Variable: Full-time employment (Sample size 4616)
Coefficient t-value Coefficient t-value Coefficient t-value Coefficient t-value
Constant 0.784 28.955 0.797 29.514 0.786 28.480 0.780 28.336
Grad in 09 -0.019 -2.220 -0.023 -2.698 -0.021 -2.404 -0.019 -2.263 Econoomics -0.025 -1.195 -0.021 -1.012 -0.021 -1.004 -0.025 -1.186
Business -0.039 -1.875 -0.033 -1.564 -0.030 -1.449 0.039 -1.879
Law -0.030 -1.400 -0.029 -1.333 -0.026 -1.189 -0.030 -1.382
Languages -0.076 -3.183 -0.067 -2.815 -0.067 -2.804 -0.073 -3.083
Culture -0.075 -2.923 -0.080 -3.073 -0.072 -2.793 -0.078 -3.023
Science -0.072 -2.491 -0.076 -2.638 -0.071 -2.465 -0.070 -2.500
Male/Femal 0.025 2.351 0.023 2.199 0.020 1.878 0.025 2.390
GPA1 0.039 4.421 0.040 4.528 0.041 4.710 0.038 4.328
GPA3 0.035 4.078 0.033 3.804 0.036 4.202 0.033 3.819
Career 0.019 5.816
WIL 0.056 6.389 0.076 7.190
Induction 0.018 2.085 0.037 3.877
Adjusted R2 0.033 0.031 0.028 0.035
F-value 15.099 14.613 13.097 14.811
Linear Probalility Model estimated by Ordinary Least Square method
Equation 1 2 3 4
Dependent Variable: Listed Company (Sample size 3965)
Coefficient t-value Coefficient t-value Coefficient t-value Coefficient t-value
Constant 0.247 4.882 0.260 5.139 0.258 5.028 0.254 4.959
Grad in 09 -0.010 -0.650 -0.014 -0.954 -0.014 -0.911 -0.013 -0.856
Econoomics -0.001 -0.021 0.003 0.076 0.041 0.096 0.002 0.050
Business 0.030 0.696 0.038 0.894 0.041 0.957 0.036 0.844
Law -0.022 -0.518 -0.019 -0.445 -0.017 -0.401 -0.020 -0.456
Languages -0.106 -2.375 -0.096 -2.142 -0.094 -2.104 -0.098 -2.187
Culture -0.065 -1.385 -0.068 -1.431 -0.064 -1.351 -0.067 -1.418
Science 0.004 0.067 -0.001 -0.220 0.000 0.007 0.001 0.016
Male/Femal 0.027 1.472 0.024 1.291 0.021 1.169 0.024 1.328
GPA1 0.009 0.597 0.010 0.730 0.012 0.810 0.010 0.684
GPA3 0.031 2.167 0.030 2.084 0.032 2.214 0.030 2.085
Career 0.019 2.829
WIL 0.033 1.504 0.041 1.709
Induction 0.002 0.131 0.014 0.816
Adjusted R2 0.011 0.010 0.009 0.010
F-value 5.081 4.536 4.321 4.212
(Note) Significant at 5%
Significant at 10%
t-values: Heteroskedasticity-robust t-values Table I: Determining Factors of Employment Outcome by Employment Status
Table II: Determining Factors of Employment Outcome by Company Status
7. Conclusion
Let us conclude the paper by using the empirical results to verify the three hypotheses.
Hypothesis 1: “Career education helps to obtain a good job.” (Accept)
Career education, no matter how defined, showed a positive and significant effect on employment status. (Table I) However, once we use company status as an dependent variable the results were somewhat weaker. (Table II) As mentioned earlier it is not possible to conclude here that
career education acts as human capital forming or signalling.
But in either way it helps and therefore we accept Hypothesis 1.
Hypothesis 2: “Career education raises academic performance.” (Accept)
The estimation results for WIL in Table III support this hypothesis. Therefore, career education courses and more academic courses are not conflicting but can be complementary.
Hypothesis 3: “Good students do well at university.”
(Accept)
Linear Model estimated by Ordinary Least Square methodEquation 1 2 3 4 5
Dependent Variable: GPA3 (Sample size 5160)
Coefficien t-value Coefficien t-value Coefficien t-value Coefficien t-value Coefficien t-value Constant 0.860 18.004 0.856 17.851 0.858 18.018 0.878 18.232 0.865 17.974 Grad in 09 -0.047 -3.162 -0.046 -3.093 -0.048 -3.242 -0.051 -3.415 -0.050 -3.323 Econoomics -0.104 -2.586 -0.105 -2.624 -0.106 -2.641 -0.099 -2.472 -0.104 -2.591 Business -0.124 -0.308 -0.016 -0.395 -0.021 -0.524 -0.006 -0.147 -0.018 -0.446
Law 0.038 0.935 0.037 -0.905 0.032 0.796 0.038 0.939 0.033 0.808
Languages 0.130 2.989 0.126 0.885 0.124 2.854 0.136 3.135 0.127 2.914
Culture 0.229 4.960 0.229 4.953 0.217 4.713 0.226 4.895 0.217 4.706
Science -0.586 -1.190 -0.058 -1.174 -0.063 -1.278 -0.065 -1.320 -0.065 -1.320 Male/Female -0.110 -5.971 -0.108 -5.838 -0.101 -5.470 -0.111 -6.005 -0.102 -5.511
GPA1 0.593 51.645 0.592 51.328 0.585 50.725 0.593 51.687 0.586 50.711
Career 0.007 0.975
WIL 0.117 5.259 0.109 4.544
Induction -0.043 -2.828 -0.017 -1.006
Adjusted R2 0.397 0.398 0.400 0.398 0.400
F-value 377.911 340.212 344.647 341.381 313.408
(Note) Significant at 5%
Significant at 10%
Table III: Determining Factors of Acdemic Performance
Table III’s results support this view. Ideally, we would like education to offer equal opportunity to invest in human capital, in which case that GPA 1’s coefficient should not be significant --- how a student came to university (i.e. GPA1) does not influence how he/she leaves university (i.e. GPA3) Yet the reality is a positive and significant GPA 1, which supports Hypothesis 3. However, as the coefficient is clearly below 1, a signalling in education is complemented by human capital element.
So are we doing the right thing with career education? The answer seems to be affirmative with a slight suspicion that we are gathering already able students to simply give them signature of approval.
In concluding the paper, it is important to mention that the data used for this estimation is of KSU students only, which may have certain selection bias. It would be advisable not to take the results for granted but to apply a similar approach to one’s own data by adjusting to its specific environment. As for our future research, we have two further issues --- one is to merge these objective data with more subjective data such as those in Matsutaka, Tanaka, and Churton (2009), and the other is to compare the effectiveness of career education in different countries (see, for example, Tanaka and Carlson (2011))
ACKNOWLEDGEMENTS
An earlier version of this paper was presented in ASET conference at University of Leicester, UK in 2010, and I am grateful to Lisa Ward, of University of Huddersfield, and other particiopants, who provided useful comments and suggestions during and after the conference.
REFERENCES
Becker, G. (1964): Human Capital; A Theoretical and Empirical Analysis with Special Reference to Education, National Bureau of Economic Research.
Borjas,G. (2008): Labor Economics, 4th edition, McGraw-Hill International Edition.
Matsutaka, M., Tanaka, Y. and Churton, P. (2009): “Assessing the effectiveness of co-op education in Japan -A panel data analysis at KSU-,” presented as a referred paper at WACE conference in Vancouver.
Mincer, J. (1974): Schooling, Experience, and Earnings, National Bureau of Economic Research.
Spence, M. (1973): “Job Market Signalling,” Quarterly Journal of Economics, 87(3), pp.355-374.
Tanaka, Y. and Carlson, K. (2011): “An International Comparison of the Effect of Work-integrated Learning on Academic Performance: A statistical evaluation of WILs in Japan and Hong Kong,” presented as a referred paper at WACE conference in Philadelphia.
Wooldridge, J. (2006): Introductory Econometrics: A modern approach, 3rd edition, Thompson South-Western.
ᩥᢒ㘓㻌
ி㒔⏘ᴗᏛ䜻䝱䝸䜰ᩍ⫱◊✲㛤Ⓨ䝉䞁䝍䞊䛿2008ᖺ
3
᭶䛸2009
ᖺ3
᭶䛻༞ᴗ䛧䛯Ꮫ⏕5473
ྡ䛻㛵䛩䜛Ꮫᴗ ᡂ⦼䚸䜻䝱䝸䜰ᩍ⫱⛉┠ᒚಟ䛾᭷↓䚸ෆᐃඛ䛾䝕䞊䝍䜢 㞟ィ䛧䛯䚹ᮏㄽᩥ䛾┠ⓗ䛿䛣䜜䜙䛾䝕䞊䝍䜢䛳䛶䜻䝱䝸 䜰ᩍ⫱䛜Ꮫᴗᡂ⦼䛸ᑵ⫋≧ἣ䛻䛘䜛ᙳ㡪䜢᳨ド䛩䜛䛣 䛸䛷䛒䜛䚹ලయⓗ䛻䛿䚸䜻䝱䝸䜰ᩍ⫱䛜ᑵ⫋䛻᭷䛻ാ䛟 䛣䛸䚸䜻䝱䝸䜰ᩍ⫱䛜Ꮫᴗᡂ⦼䜢ྥୖ䛥䛫䜛䛣䛸䚸Ⰻ䛔ᡂ⦼䛷ධᏛ䛧䛯Ꮫ⏕䛿ᅾᏛ୰䛾ᡂ⦼䜒Ⰻ䛔䛣䛸䛜♧䛥䜜䛯䚹
䜻䞊䝽䞊䝗䠖䜻䝱䝸䜰ᩍ⫱䚸Ꮫᴗᡂ⦼䚸ᑵ⫋≧ἣ䚸⤫ィศ ᯒ㻌
㹝㹝㹝㹝㹝㹝㹝㹝㹝㹝㹝㹝㹝㹝㹝㹝㹝㹝㹝㹝㹝㹝㹝㹝㹝㹝㹝 2011ᖺ11᭶30᪥ཷ⌮
†⏣୰ᑀ: ࢟ࣕࣜᩍ⫱ࡀᏛᴗᡂ⦼ᑵ⫋≧ἣ࠼ࡿᙳ㡪ࡢ
ホ౯ 㸫༞ᴗ⏕ࢹ࣮ࢱᇶ࡙ࡃ⤫ィศᯒ㸫
ி㒔⏘ᴗᏛ⤒῭Ꮫ㒊࣭࢟ࣕࣜᩍ⫱◊✲㛤Ⓨࢭࣥࢱ࣮
603-8555 ி㒔ᗓி㒔ᕷ༊ୖ㈡ⱱᮏᒣ㻌 㻌