気候モデルの北半球高緯度陸域における地表気温変化トレンドの再現性評価
阿部 学1、野沢 徹2、小倉知夫3、高田久美子4
1国立極地研究所・国立環境研究所
2岡山大学、3国立環境研究所、
4国立極地研究所・国立環境研究所・海洋研究開発機構地球環境変動領域
Assessment of temporal trend in surface air temperature change in Northern High-latitude land region of climate models
Manabu Abe1, Toru Nozawa2, Tomoo Ogura3, Kumiko Takata4
1National Institute of Polar Research (NIPR), National Institute for Environmental Studies (NIES)
2Okayama University, 3NIES, 4NIPR, NIES, JAMSTEC RIGC
This study has investigated reproducibility of linear trend in surface air temperature (SAT) change over northern high-latitude land region from 1976 to 2005 in historical run by 31 climate models participated in CMIP5 (Coupled Model Intercomparison Project Phase 5). For each model, linear trend in seasonal mean SAT change during 1976-2005 was calculated to be compared with the observed trend. The observed SAT data used in this study are CRUTEM4 (Jones, et al. 2012), nansenSAT (Kuzmina, et al. 2008), and GISTEMP (Hansen, et al. 2010).
For linear trend averaged over the region (40N-80N), most of all the models underestimate increase in SAT in all season. In the average over the models, the underestimation of linear trend in winter (December-January-February) and spring (March-April-May) are greater, but that in fall (September-October-November) is the smallest. Figure 1 shows the Taylor diagrams (Taylor 2001) with CRUTEM4 as reference data. The spatial pattern correlation coefficients for all the models are quite small in all seasons, indicating the spatial pattern is not realistic. This result is also common in cases with the other observed data as reference data. Therefore, spatial pattern in the simulated linear trend of SAT change during 1976-2005 is unlikely to be realistic.
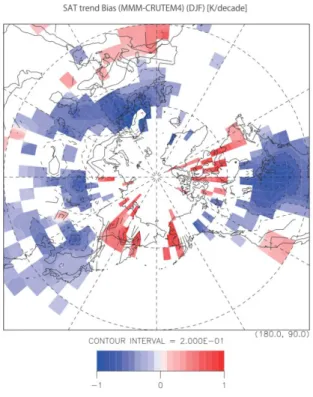
Further, we investigated the inter-model relationship in spatial pattern of the trend-bias. There are significant positive correlation coefficients for winter in all model pairs. Average and standard deviation in the correlation coefficient over the all pairs for winter are about 0.8 and about 0.08, respectively. In other seasons, most of all model pairs show a significant positive correlation coefficient, and the average in spring, summer, and fall are about 0.76, 0.74, and 0.67, respectively. Therefore, spatial patterns of trend-bias in all models are very similar to each other in each season. Also, this result indicates the models have a common spatial pattern of the bias in the linear trend of SAT. Figure 2 shows multi-model mean of the trend bias in winter SAT. The negative trend biases are found in wide regions from Europe to East Asia, except coast region of Eurasian continent near the Arctic Ocean, and Northeast America. Such a spatial pattern of the winter-bias is common among models.
Figure 1 Taylor Diagram for SAT trend over region (40N-80N) in four seasons. Reference data is CRUTEM4.
Acknowledgment
This study has been supported by “Green Network of Excellence” Program (GRENE Program) Arctic Climate Change Research Project ‘Rapid Change of the Arctic Climate System and Its Global Influences’ from Ministry of Education, Culture, Sports, Science & Technology (MEXT), Japan.
References
Jones, P. D., D. H. Lister, T. J. Osborn, C. Harpham, M. Salmon and C. P. Morice, Hemispheric and large-scale land-surface air temperature variations: An extensive revision and an update to 2010, Journal of Geophysical Research: Atmospheres, 117(D5), D05127, 2012
Kuzmina, S. I., O. M. Johannessen, L. Bengtsson, O. G. Aniskina and L. P. Bobylev, High northern latitude surface air temperature: comparison of existing data and creation of a new gridded data set 1900–2000, Tellus A, 60(2), 2008
Hansen, J., R. Ruedy, M. Sato and K. Lo, GLOBAL SURFACE TEMPERATURE CHANGE, Reviews of Geophysics, 48(4), RG4004, 2010
Taylor, K. E., Summarizing multiple aspects of model performance in a single diagram, Journal of Geophysical Research:
Atmospheres, 106(D7), 7183-7192, 2001
Figure 2 Multi-model mean trend bias of surface air temperature in DJF. Unit is K/decade.
Contour interval is 0.2. Colored grids indicate the standard deviation among models is smaller than absolute value of the trend bias.