Do EMU Countries Have the Same Business Cycles? : A Lesson for Regional Monetary Integration in East Asia
著者 Takaya Sadayoshi
journal or
publication title
Kansai University review of business and commerce
volume 9
page range 61‑84
year 2008‑03
URL http://hdl.handle.net/10112/12111
Do EMU Countries Have the Same Business Cycles?*
ー A Lesson for Regional Monetary Integration in East Asia SadayoshiTakaya
Abstract
This paper studies the synchronization of business cycles in the EMU and East Asia using a band‑pass filter. This is because from the point of view of the Optimum Currency Area criteria, this synchronization is an important factor in the introduction of a common regional currency. In this paper, policy coordination, such as fiscal constraints and cooperative monetary policies, is considered as an important factor in synchronization. Therefore, we suggest that policy coordination will be necessary if East Asia intends to introduce a common regional currency.
keywords: Synchronization of Business Cycles,
Economic and Monetary Union, Asian Monetary Integration Index
1. Introduction: synchronization of business cycles and the EMU
2. Estimation of the synchronization 3. Results of the estimation
4. Estimation for the synchronization of Asian business cycles
5. Lessons from the introduction of the Euro for Asian monetary cooperation
References
* This work was supported by JSPS KAKENHI, Grant‑in‑Aid for Scientific Research (B) (#18330052) and (C) (#17530253). This paper was presented at EUSA‑AP‑Japan December 10, 2005, and Western Economic Association I International 81st, July1, 2006.
61
62
1. Introduction: synchronization of business cycles and the EMU The introduction of the Euro in 1999 has affected the economic structure and characteristics of the countries using the Euro. These changes are manifested as a "convergence" of the economies of the member countries. These convergences include the following four aspects: (1) the convergence of institutions, (2) policy convergence, (3) the convergence of nominal variables, and (4) the convergence of real variables. Since the ratification of the Maastricht Treaty in 1993, several common institutions, for example, the European Central Bank (ECB), were established. Macroeconomic, monetary, and fiscal policies converged as a result of this treaty and the Stability and Growth Pact. In addition, the nominal economic variables, inflation rates, nominal long‑term interest rates, and nominal exchange rates converged in the late 1990s as a result of the convergence criteria. The former three aspects of convergence may be considered to produce real economic variables, a representative example of which is the real growth rate of the GDP or the industrial production.
Undoubtedly, if the Economic and Monetary Union of Europe (EMU) has achieved the convergence of real economic variables, it will be easy for the ECB to control the Euro area economy using a single monetary policy. Through the convergence of the real growth rate or the synchronization of business cycles, the ECB is able to implement a monetary policy aimed at absorbing the exogenous shocks throughout the Euro area. However, there are two controversial views regarding the common currency area: one is that synchronization is increased through intra‑trade intensity1, and the other is that synchronization is decreased through the centralization of a specific industry in a country. or a region2. The former is related to the Optimum Currency Area (OCA) criteria, which includes free labor mobility, the divergence of products, the openness of the member countries, etc. The latter is related to the economics of scale or spatial economics. In order to investigate the difficulties involved in policy
1 See Frankel and Rose {2002).
2 See Krugman (1991).
implementations, empirical studies on synchronization would be necessary both before and after the introduction of the Euro.
A recent study proposed the "endogeneity of the OCA," that is, the OCA criteria would be satisfied after the introduction of the common currency. If this hypothesis holds, the synchronization may have increased after 1999. If the increase in synchronization occurred after the introduction of the Euro, the endogeneity hypothesis is correct. Our study, too, contributes to the empirics of the "endogeneity of the OCA" hypothesis because it empirically analyzes the synchronization that occurred before and after the introduction of the Euro.
Previous studies on the synchronization of business cycles in the EMU include those conducted by Artis and Zhang (1995), Ramos et al. (2003), and Kalemli‑Ozcan et al. (2003). Artis and Zhang (1995) suggested that the formation of the Exchange Rate Mechanism (ERM) contributed to the synchronization in the EMU. On the basis of the evidence of country‑specific shock reduction, Ramos et al. (2003) argued that the synchronization was caused by policy coordination in the EMU. Kalemli‑Ozcan et al. (2003) suggested that the financial integration in the EMU reduces the symmetry of international macroeconomic fluctuations because of the increased risk‑sharing opportunity. Thus far, the pattern of the synchronization has been inconclusive.
However, the recent differences in the business cycles in the EMU, such as the Spanish economy boom and the recession of the German economy, are significant as they cannot be accommodated by the common monetary policy. If the difference diverges, the common economic policy may not be able to control economic fluctuations, and as a result, the Euro area will face the risk of sustainability.
Consequently, we will investigate business cycle synchronization using a rolling estimation to determine the changes in the synchronization. If the synchronization increases, the probability of sustainability may also increase. In contrast, if the synchronization decreases, the probability of sustainability may decrease.
64
Furthermore, the differences in the business cycles in some regions
—
with the exception of the EMU
—
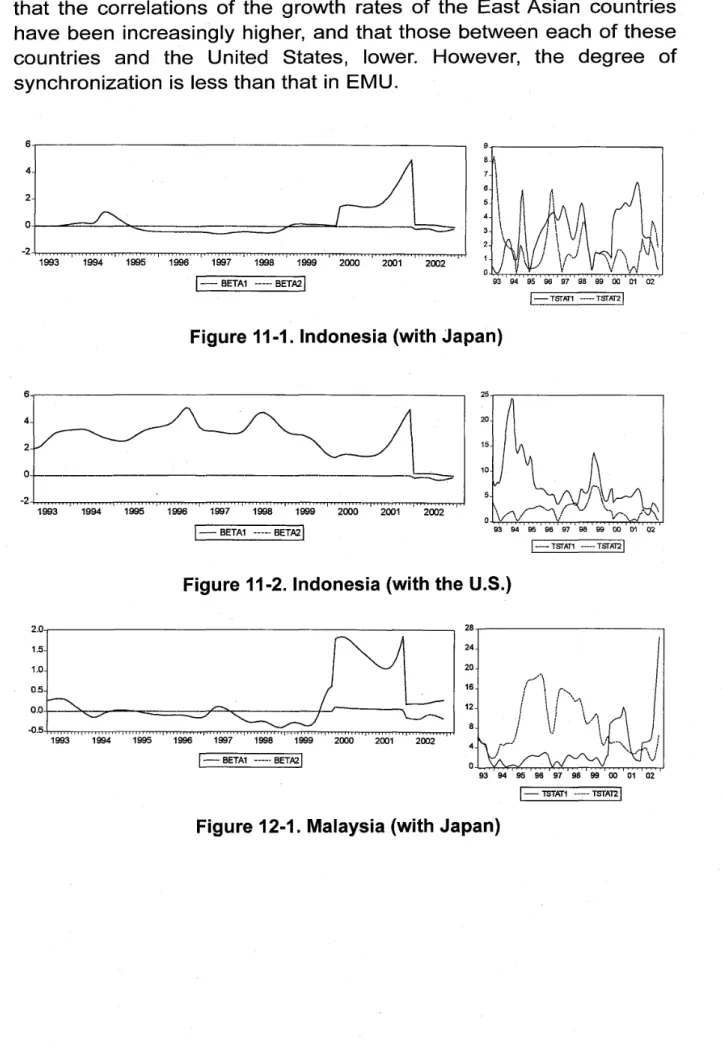
for example, East Asia, may cause currency crises. When the disequilibrium in the current account or the balance of payments increases as a result of the fundamentals of economy, speculators take advantage of opportunities to attack the currency on account of this disequilibrium.In this paper, we explore the synchronization of the business cycles in the EMU in order to investigate the methods of implementing economic coordination and/or cooperation in East Asia. In section 2, we present the methods used to estimate the synchronization. Section 3 presents the results of the estimation. Section 4 explains the estimation of the synchronization in East Asia, and in section 5, we conclude our investigation and indicate the course of future economic coordination in East Asia.
2. Estimation of the synchronization Data
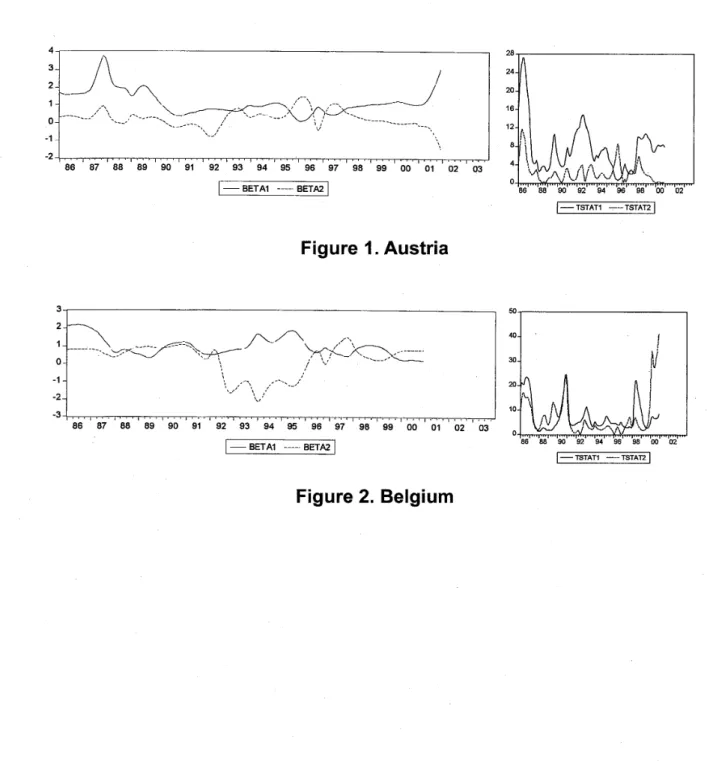
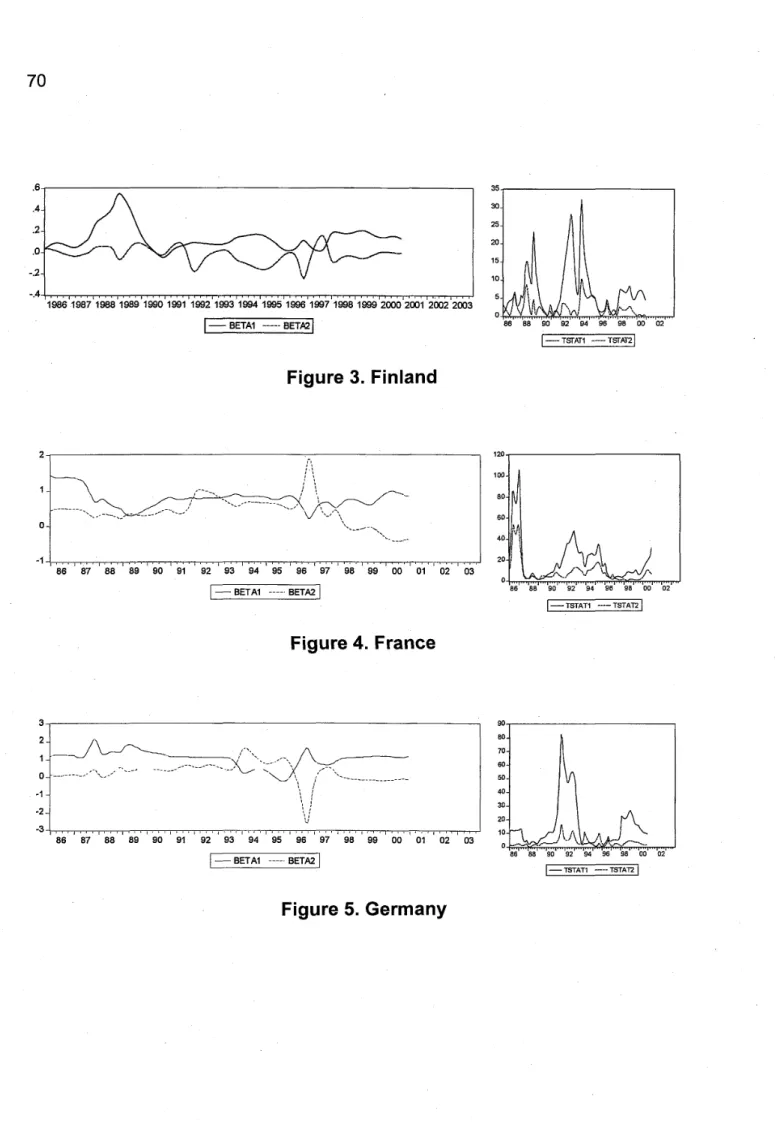
The rolling OLS method as we mentioned above is applied to the industrial production series of selected major EMU countries. In particular, the data used in the empirical analysis are the monthly growth rates of the industrial production from 1986: 1 to 2003: 12, drawn from the International Financial Statistics CD‑ROM by the International Monetary Fund. The European countries investigated in this paper are Austria (AT), Belgium (B), France (F), Germany (DE), Ireland (IR), Italy (IT), the Netherlands (NE), Portugal (P), Spain (E), and the United Kingdom (UK). The Asian countries investigated in this paper are Korea (K), Indonesia・(IN), Malaysia (M), the Philippines (PH), and Thailand (TH). The aggregate variable for the Euro area industrial production used in the estimations is derived from the values reported in the ECB monthly data.
Modeling the growth cycles
In this study, we use a band‑pass filter to model the business cycles. In particular, the Christiano‑Fitzgerald full sample asymmetric filter is applied because of its generality.
There are several types of frequency filters that can be applied to business cycles: the Baxter‑King (BK) filter, the Christiano‑Fitzgerald (CF) fixed‑length symmetric filter, and the Christiano‑Fitzgerald (CF) asymmetric full sample filter. These filters are used to isolate the cyclical component of a time series by specifying a range for its duration. The band‑pass filter is a linear filter that calculates a two‑
sided weighted moving average of̲ the data wherein the cycles in a
"band," given by a specified lower and upper bound, are "passed"
through or extracted, and the remaining cycles are "filtered" out.
The fixed‑length symmetric filters employ a fixed lead/lag length. In this filter, the fixed number of lead and lag terms to be used while computing the weighted moving average must be specified. The symmetric filters are time‑invariant since the moving average weights depend only on the specified frequency band and not on the data. The BK filter is less effective than the CF filter; these two filters differ in the objective function used to select the moving average weights.
The BK filter is obtained by band‑pass filtering the time series of the GDP growth to eliminate all the frequencies of the data that are higher or lower than the business cycle frequencies.
The filter BPF(n, m, j) is a weighted moving average of the order j, such that
五=
Laiyt j (1)l=—j
where y denotes growth rate, and suffix t represents time, and a weight. The weights are the Fourier transform of the frequency domain representation of the series, in which the frequencies higher than 2TT/m and lower than 2TT/n are set to zero. 2 [Note: See Editor's Note #4.] The control size of the symmetric moving average filter is then fixed at 12. For this reason, while employing the BK filter, artificial data is added at the beginning and the end of the series before performing a moving‑average filtering using autoregressive (AR) backcasts and forecasts.
In contrast, the asymmetric full sample CF filter is the most general type of filter, in which the weights on the leads and lags are allowed to
66
differ. The asymmetric filter is time‑variant, with the weights both depending on the data and changing for each observation.
While choosing between these two methods, it should be noted that the BK filter requires the same number of lead and lag terms for every weighted moving average. Thus, a filtered series computed using observations of the leads and lags would omit observations from both the beginning and the end of the original sample. In contrast, the asymmetric filtered series does not have this requirement, and can be computed to the extremes of the original sample. Consequently, we employed the CF asymmetric filter in our study.
AT BE FR DE lR IT NE PR ES UK ATBEFRDEJRITNEPRESUK
Table 1. Correlation Matrix
Correlation Matrix (1986Jan. ‑1992Dec.)
AT BE FR DE JR IT NE PR ES UK
1.000
0.459 1.000
0.635 0.893 1.000
0.872 0.612 0.612 1.000
‑0.490 0.226 0.050 ‑0.190 1.000
‑0.034 0.628 0.684 0.063 0.582 1.000
0.554 0.122 0.219 0.583 ‑0.349 ‑0.056 1.000
0.779 0.007 0.118 0.728 ‑0.489 ‑0.386 0.616 1.000
0.089 0.273 0.356 0.275 0.248 0.484 0.272 0.067 1.000
‑0.179 0.405 0.204 0.055 0.836 0.478 ‑0.167 ‑0.236 ‑0.105 1.000 Correlation Matrix (1993Jan.‑1998Dec.)
AT BE FR DE IR IT NE PR ES UK
1.000
0.709 1.000
0.923 0.670 1.000
0.837 0.618 0.911 1.000
0.099 0.020 ‑0.037 0.020 1.000
0.874 0.805 0.912 0.745 0.119 1.000
0.486 0.269 0.633 0.723 0.443 0.590 1.000
0.193 0.627 0.128 0.195 0.617 0.372 0.300 1.000
0.940 0.702 0.932 0.894 ‑0.018 0.863 0.594 0.124 1.000
0.507 0.017 0.549 0.420 0.163 0.501 0.580 ‑0.304 0.582 1.000