Patterns of kindergarten leaders' instructional coaching and their association with instructional leadership
PAN-Yuejuan YANG-Qingqing WU-Niwen LIU-Shanshan Faculty of Education, Beijing Normal University
Abstract: Instructional coaching is viewed as an effective means of professional development and a vital managerial component. The present study used a sample of 1071 teachers from 99 kindergartens in Chinese contexts and found that the framework combining group and dyadic coaching behaviours and relationships could reliably and validly capture variations in instructional coaching received by teachers.
Five profiles of instructional coaching were identified, and the majority of kindergarten leaders' instructional coaching perceived by teachers in the Chinese context was featured as a moderate behaviour/authoritative relationship or a high behaviour/authoritative relationship. The variations across these five profiles make a significant difference in the effectiveness of kindergarten leaders' instructional leadership as perceived by teachers. Comparatively speaking, coaching behaviours are more closely associated with instructional management, while coaching relationships are more closely associated with emotion and value building. In addition, it is relatively easy for kindergarten leaders to provide more group coaching but difficult to change dyadic coaching, and the authoritative relationship is the most difficult element to change.
Key words: kindergarten leader, Instructional coaching, Instructional leadership, Latent profile analysis, measurement scale
Introduction
Considerable evidence has shown that kindergarten teacher quality has significantly positive impacts on child outcomes in early years (Burchinal, Cryer, Clifford, &
Howes, 2002). However, the quality of the kindergarten teacher workforce lags far behind social expectations, and improving teacher quality has become a common challenge for early childhood education policy and practice across the world (OECD, 2006). In the last decade, there has been an increasing interest in instructional
coaching because of its potential to improve teacher effectiveness (Joyce & Showers, 2002). Coaching has become a popular strategy for schools to provide teachers with opportunities for contextual, job-embedded, individualized and sustained professional development (Neufeld & Roper, 2003; Denton & Hasbrouck, 2009).
Coaching has been identified as a vital component and representative behaviour of effective leadership (Hamlin, Ellinger & Beattie, 2006). The OECD's comparative review of school leadership identifies a focus on supporting, evaluating and
developing teacher quality as the core of effective leadership (Schleicher, 2012).
Effective leaders are expected to play the role of coach, although coaching skills might not come naturally to all organizational leaders (Goleman, 2000). To select,
develop and train kindergarten leaders and promote their instructional leadership and coaching requires more conceptual and empirical clarification about what constitutes instructional coaching, how to determine and distinguish between good and poor instructional coaching, and what kind of instructional coaching will be perceived as high leadership. However, although coaching has been discussed mostly in the context of sports, leadership and organizational management, little is known about features and patterns of instructional coaching and its association with leadership in the educational field, even less in early childhood education. The present study will fill the gap in instructional coaching in early childhood education literature by examining the following research questions:
a. How does one measure kindergarten leaders' instructional coaching?
b. What patterns of instructional coaching exist among kindergarten leaders experienced by teachers?
c. How does instructional leadership differ across patterns of instructional coaching?
Methods Sampling
Because Chinese early childhood education exploits the multi-level management system and local authorities are responsible for funding and developing early childhood education, early childhood education policies and developmental modes vary across counties and districts. Hence, we only sampled kindergartens in one district to guarantee having the same policy environment. For reasons of accessibility and feasibility, we collected the data in the district of Panyu in Guangzhou city, Guangdong province. Panyu district lies in the south-central part of Guangzhou, whose Gross Domestic Product ranks fifth in the 11 districts of Guangzhou. A random stratified sampling approach was applied according to a list of Panyu District kindergarten records, which included a total of 318 kindergartens: 30.8% public kindergartens and 69.2% private kindergartens, with 74.1% of private kindergartens being nonprofit. According to the proportion shown on the list, 120 kindergartens were randomly selected to participate in the study and 1532 teachers agreed to complete web-based questionnaires after signing informed consent forms. A total of 1258 valid questionnaires were retrieved. Given that it takes time for teachers to become familiar with the instructional coaching behaviours and instructional leadership of their leader in order to provide reliable answers, teachers whose had worked less than 1 year in the current kindergarten were excluded from the final sample. The final sample comprised 1071 teachers from 99 kindergartens, where 32.3%
(n=32) were public kindergartens and 67.7% were private kindergartens, and 70.1%
(n=47) were nonprofit private kindergartens.
Measures
Instructional coaching scale (ICS). Based on the aforementioned theoretical framework and empirical evidence regarding the features of instructional coaching, the research team developed a scale to assess kindergarten leaders’ (including principals, deputy principals and instructional directors who are responsible for instructional coaching within kindergartens) instructional coaching behaviours and the
relationships experienced by teachers. Specifically, we developed our instructional coaching measure according to the division of coaching behaviours, i.e., group coaching and dyadic coaching, and the nature of the relationship in the coaching process, i.e., authoritative/democratic. Therefore, 25 items were developed to describe the instructional coaching behaviours, which were supposed to involve three dimensions: Group Coaching (four items), Dyadic Coaching (sixteen items), and authoritative relationship (five items). The participants were asked to rate the extent to which the statement matched their real experience in the workplace on a scale ranging from one (totally disagree) to seven (totally agree).
Principal Instructional Management Rating Scale (PIMRS). To assess the instructional leadership of kindergarten leaders perceived by teachers, the research team adapted the Principal Instructional Management Rating Scale by Hallinger and Wang (2015). The PIMRS has been systematically validated among diverse populations around the world, including Chinese teachers (Antoniou & Lu, 2017), and proved to have good face, content, and construct validity, reliability and internal consistency. Under the principle of unchanging the meaning of items in the original scale, we revised some statements according to the specific management behaviours of kindergarten leaders. For example, the item “recognize students who do superior work with formal rewards such as honour roll or mention in the principal’s newsletter”
was adapted to “recognize children’s superior achievement or behaviour by posting information on bulletin boards or hallways in kindergartens”. The scale used in the current study still comprised 50 items and incorporated three dimensions, i.e., Defines the School Mission (DSM), Manages the Instructional Programme (MIP) and Develops a Positive School Learning Climate (DPSLC). The ratings for each item ranged from one (totally disagree) to seven (totally agree). Six items were removed due to low loadings or cross-loadings in Confirmatory Factor Analysis. In addition, their contents might not be typical in Chinese kindergartens when thoroughly reviewed. The remained 44 items reached satisfactory fit indices in Confirmatory Factor Analysis: χ2=7305.64, df=899, RMSEA=0.075 (90 Percent C.I: 0.074, 0.077), CFI=0907, TLI=0.902, SRMR=0.035. Internal consistency for the ten items in the DSM dimension was 0.973, for the fifteen items in the MIP dimension 0.976, and for the nineteen items in the DPSLC 0.967. The average scores for all items in each dimension were calculated to represent the dimensional scores.
Data analysis
To justify the internal validity of the developed ICS, as well as generate the best factor structure for the ICS, a series of exploratory factor analysis (EFA) and confirmatory factor analysis (CFA) was conducted. First, as suggested by Gerbing and Hamilton (1996), it was better to perform the EFA and CFA in different samples; thus the full sample was randomly split using SPSS 22.0 so that approximately 50% (N=536) of the teachers formed the learning sample for the EFAs, and the remaining formed the cross-validation sample for CFA. All EFAs and CFA were performed using Mplus 7.4.
A robust maximum likelihood (MLR) estimator was chosen because of its applicability to certain degrees of multivariate nonnormality in the data. The geomin rotation criterion was utilized for EFAs due to the uncertainty of the scale’s true
loading structure (Asparouhov & Muthén, 2009). A series of criteria was used to evaluated the goodness of fit for the EFAs and CFA: the p-value of chi-square (χ2; Hari, Anderson, Tatham, & Black, 2006), the Comparative Fit Index (CFI; Bollen, 1989), the Tucker-Lewis Index (TLI; Bollen, 1989), the root mean square error of approximation (RMSEA; Swanson & Hoton, 2005), and the standardized root mean squared residual (SRMR; Pintrich, Smith, García, & McKeachie, 1993). A non-significant p-value of χ2 represents a good fit. However, the χ2-value can be influenced by sample size (Hair, Anderson, Tatham, & Black, 2006). Given the relatively large sample size in both learning and cross-validation samples, a significant value was to be expected. The values of CFI and TLI >0.90 indicate an adequate model fit and above 0.95 a good model fit. The RMSEA values ≤0.08 can be interpreted as a good fit; ≤0.05 indicates a very close fit. The SRMR should have a value of ≤0.05.
The factor analyses proceeded in three steps. In Step 1, EFAs specifying several factors were conducted to identify the optimal factorial solutions with best fit-indices for the ICS. The number of examined factors was determined by the eigenvalue over Kaiser’s (1960) criterion of one. In Step 2, the items in the identified optimal model were reviewed, and items with double loadings >0.30 and loading <0.40 were dropped in sequence. Every time an item was dropped, an additional EFA based on the model identified in Step 1 was applied with the learning sample. In Step 3, CFA with the cross-validation sample was performed based on the models identified in previous steps. During the entire process, theory interpretability functioned as an important guideline when considering which items to keep and which ones to remove (Henson & Roberts, 2006).
Based on the structures identified in EFAs and CFA, a latent profile analysis (LPA) was further applied using Mplus 7.4 to explore the number of latent classes of instructional coaching, the membership in each latent class, and the profiles of the latent classes that may exist. The average dimensional scores of the items in the identified factors were used as indices for the LPA. One-class up to eight-class models were examined to identify the number of latent classes that best fit the data. Four indices were reviewed to compare the goodness of fit of these models: the Akaike information criterion (AIC; Akaike, 1973); Baysian information criterion (BIC;
Schwarz, 1978); the sample size adjusted BIC (aBIC; Sclove, 1978); entropy (Peugh
& Fan, 2013); and the Lo-Mendell-Rubin likelihood ratio test (LMR-LRT; Peugh &
Fan, 2013). For the AIC, BIC and ABIC, the lower values indicate a better-fitting model. The values of entropy closer to 1 indicate a better classification in a model. A significant p-value of LMR-LRT indicates the k-1 latent class model was inferior compared with the k latent class model. Moreover, the parsimony and interpretability of the identified profiles were considered when determining which is the ideal model.
After the number of latent classes was determined from the LPA, we exported the class membership variable into an output file and then examined the variances across the classes on the three dimensions of instructional leadership. An ANOVA was conducted in SPSS 22.0, with the Brown-Forsyth test used to adjust for unequal variances due to likely different sample sizes across the latent classes, and a
Game-Howell adjustment was executed for post hoc tests.
Results
Factor analyses of the Instructional Coaching Scale
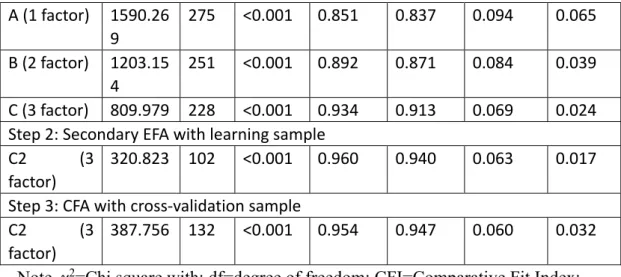
Step 1: The first five eigenvalues in the initial EFAs with the learning sample were 15.834, 1.987, 1.207, 0.700, 0.613. Therefore, for the following examination of the factorial structure of the ICS, we tested the fitness of one- to three- factor models to the data. As shown in Table 1 (see Step 1), three-factor model (C) fitted well in the learning sample, with all indices superior to the one-factor and two-factor models.
Step 2: The factor loadings in the three-factor model were reviewed, items 3, 5, 6, 8, 9, 15, 24, 25 were discerned double-loading over 0.30. These items were removed on order according to the degree of cross-loading and the magnitude of loading value, except for item 3 (“Organize and accompany teachers to prepare lessons in groups”).
We kept this item because it represents an important form of group coaching in kindergarten instructional coaching practice. The additional EFA with the retained 18 items still yielded three factors with eigenvalues over 1. The fit indices for the three-factor model (C2) shown in Table 1 (see Step 2) indicated a good fit in the learning sample.
Step 3: CFA of Model C2 (from Step 2) with the cross-validation sample was conducted. The fit indices for this model is presented in Table 1 (see Step 3) and indicates that the three-factor model with 18 items had a good fit across all indices.
Conceptually, Model C2 was closely aligned with our theoretical framework of instructional coaching, with the identified factors and the items included in each factor clearly interpreting the supposed structure, namely, Group Coaching, Dyadic Coaching and Authoritative Relationship. Figure 1 shows the CFA model, reflecting the correlations between factors, the underlying items for each factor, and standardized factor loadings for each item on corresponding factors. The factor loadings ranged from 0.774 to 0.888, from 0.853 to 0.934, and from 0.627 to 0.882 for Group Coaching, Dyadic Coaching and Authoritative Relationship, respectively.
Given the high factor correlations identified in the three-factor CFA model, especially for Group Coaching and Dyadic Coaching (r=0.863), a further discriminant validity test using the Bootstrap confidence interval method with Mplus 7.4 was conducted. As suggested by Ping (2004), the Bootstrap confidence interval method is an appropriate way of examining discriminant validity when the paired correlations among latent factors are high. The discriminant validity is supported if the standardized confidence intervals of paired correlations do not include the value of 1 (Bagozzi & Phillips, 1982). As seen from Table 3, the values of 1 were not included within the standardized confidence intervals for the three paired correlations, which provided support for the discriminant validity of the three-factor model.
Table 1 Fit Indices for Exploratory and Confirmatory Factor Analyses with Cutoff Criteria for Fit Indicated Parenthetically
Model χ2 df P CFI
(>0.900) TLI (>0.900)
RMSEA (<0.08)
SRMR (<0.05) Step 1: Initial EFAs with learning sample
A (1 factor) 1590.26 9
275 <0.001 0.851 0.837 0.094 0.065
B (2 factor) 1203.15 4
251 <0.001 0.892 0.871 0.084 0.039
C (3 factor) 809.979 228 <0.001 0.934 0.913 0.069 0.024 Step 2: Secondary EFA with learning sample
C2 (3
factor)
320.823 102 <0.001 0.960 0.940 0.063 0.017
Step 3: CFA with cross‐validation sample
C2 (3
factor)
387.756 132 <0.001 0.954 0.947 0.060 0.032 Note. χ2=Chi square with; df=degree of freedom; CFI=Comparative Fit Index;
TLI=Tucker-Lewis Index; RMSEA=Root Mean Square Error of Approximation;
SRMR=Standardized Root Mean Squared Residual.
Figure 1. Three factor models for the Instructional Coaching Scale
Note. Groupco=group couching; indivco=individual coaching; authori=authoritative Descriptive statistics and internal consistency of the Instructional Coaching Scale
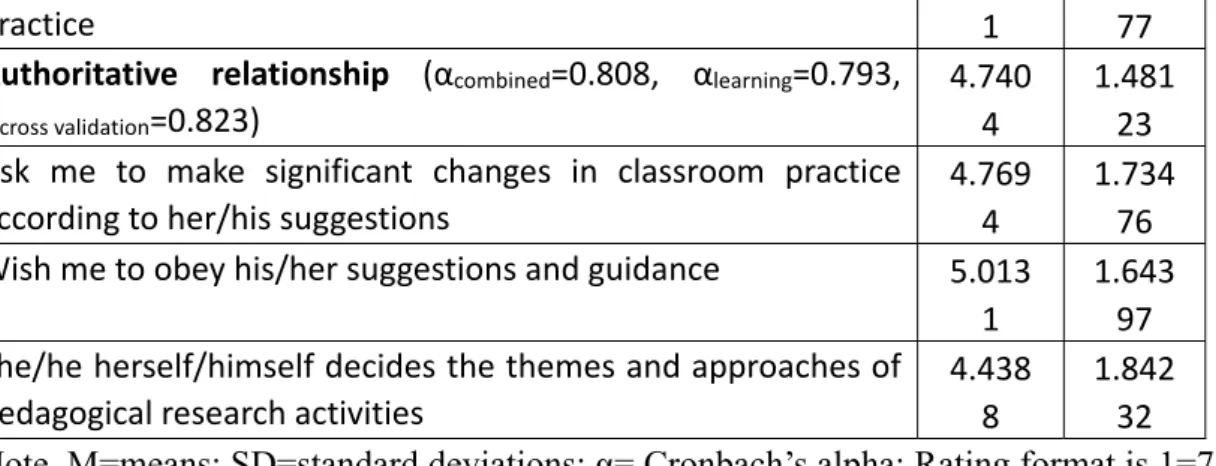
Descriptive statistics for items and internal consistency estimates for subdimensions are presented in Table 4. The results suggest satisfied internal consistency for the Instructional Coaching Scale. The means for all items and subdimensions show widespread differences. In general, the scores for the group coaching items were higher than those for the dyadic coaching, while the scores for authoritative relationship were relatively low compared with the other two subdimensions.
Table 2 Descriptive statistics and internal consistency
Items M SD
Group Coaching (αcombined= 0.869, αlearning= 0.853, αcross validation=0.883)
5.6223 1.3844 4 Organize training lectures/workshops for teachers 5.579
8
1.661 25 Organize seminars for teachers to study and discuss together 5.934
6
1.429 80 Organize and guide teachers to plan and study lessons in
groups
5.268 0
1.873 10 Organize teachers to discuss and reflect in groups after on‐site
observation
5.706 8
1.541 31 Dyadic Coaching (αcombined=0.980 , αlearning= 0.980, αcross
validation=0.981)
5.430 4
1.552 18 Assist me with analysing and interpreting young children’s
developmental states
5.480 9
1.702 49 Explicitly point out the problems in my classroom practice 5.540
6
1.678 33 Provide resources for my job and professional development 5.490
2
1.735 19 Encourage and inspire me to explore solutions to the problems
in my job and professional development
5.506 1
1.662 03 Listening to and carefully treating the questions, ideas, and
opinions I proposed
5.492 1
1.708 60 Concern about and support for my other needs, except for
improving classroom practice
5.349 2
1.811 54 Encourage me to explore my own model of classroom practice 5.520
1
1.678 71 Recognize my advantages in classroom practice 5.423
0
1.659 69 Know exactly what I need for professional development 5.211
0
1.746 11 Help me understand advances in theories and practices
through case studies, demonstrations, etc.
5.385 6
1.693 79 Most of her/his suggestions can be applied to classroom 5.336 1.605
practice 1 77 Authoritative relationship (αcombined=0.808, αlearning=0.793,
αcross validation=0.823)
4.740 4
1.481 23 Ask me to make significant changes in classroom practice
according to her/his suggestions
4.769 4
1.734 76 Wish me to obey his/her suggestions and guidance 5.013
1
1.643 97 She/he herself/himself decides the themes and approaches of
pedagogical research activities
4.438 8
1.842 32 Note. M=means; SD=standard deviations; α= Cronbach’s alpha; Rating format is 1=7, where 1= totally disagree and 7=totally agree.
Latent profiles of instructional coaching
Table 3 shows the fit indices of the LPA model with the varying number of classes from one to eight. The value of AIC, BIC and ABIC continued to decrease as the number of classes increases. This trend was expected, as the Chi-square-based statistics were sensitive to the complexity of the model. Although the LMR-LRT values remained statistically significant for each model except for the eight-class model, which suggested the seven-class model might be favoured, the three-class model showed the highest entropy, followed by the five-class model. After closely examining the member proportion and graphical representations of each latent class belonging to the three-class, five-class and seven-class models, the five-class model was chosen as the best solution, as it showed a better balance when given a comprehensive consideration of fit indices, model parsimony and model interpretability.
Figure 2 further represents member proportion and the estimated means of the identified five classes. The profile of Class 1 generally showed the lowest level of instructional coaching of all three components: very low group coaching, very low dyadic coaching, and low authoritative relationship. Approximately 11.01% (n=118) of the sample were divided into Class 1. The main difference between the profiles of Class 1 and Class 2 was the relatively higher group coaching of Class 2, which had the smallest proportion of the sample at 3.18% (n=34). The profile of Class 3 represented the medium level of instructional coaching, with mediocre values across the three components, and represented approximately 25.40% (n=272) of the sample.
Both the profiles of Class 4 and Class 5 showed relatively higher levels of group coaching and dyadic coaching, the main difference being in authoritative relationship, with Class 4 showing the highest and Class 5 the lowest authoritative relationship.
Approximately 53.97% (n=578) of the sample were classified into Class 4, while only 6.44% (n=69) belonged to Class 5.
Table 3 Fit statistics of LPA models
Models AIC BIC aBIC Entropy LMRLR
One class 13688.729 13719.553 13700.494
Two classes
10323.074 10372.838 10341.076 0.895 0.0000
Three classes
9923.804 9993.472 9949.006 0.909 0.0000
Four classes
9779.089 9868.663 9811.491 0.886 0.0000
Five classes
9666.002 9775.482 9705.606 0.894 0.0059
Six classes 9518.320 9647.705 9565.124 0.866 0.0060 Seven
classes
9450.523 9599.814 9504.528 0.877 0.0240
Eight classes
9380.569 9549.765 9441.775 0.884 0.0815
Note. AIC= Akaike information criterion; BIC= Baysian information criterion;
ABIC= the sample size adjusted BIC; LMRLR= Lo-Mendell-Rubin likelihood ratio test.
Figure 2. Five profiles on the three dimensions of instructional coaching
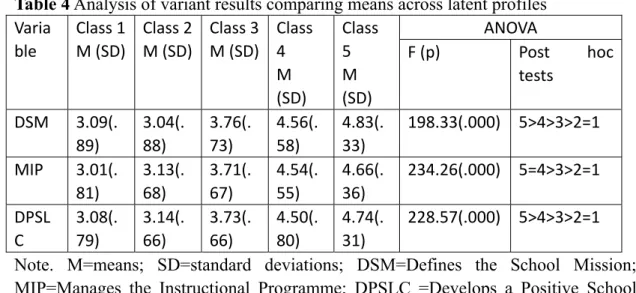
Variance of instructional leadership across patterns of instructional coaching Having determined the latent profiles of the five classes of instructional coaching, the variations in instructional leadership perceived by teachers were examined across the five classes. Descriptive statistics and the results of ANOVA analysis are summarized in Table 4. In general, statistically significant differences were found between profiles regarding the three components of instructional leadership. Specifically, teachers from Class 5 (high group coaching, high dyadic coaching, low authoritative relationship)
0 1 2 3 4 5 6 7
GROUPCOACHING DYADICCOACHING AUTHORITATIVE
Class 1 11.0%
Class 2 3.4%
Class 3 25.4%
Class 4 52.6%
Class 5 7.6%
were more likely to rate a higher level of instructional leadership on Defines the School Mission and Develops a Positive School Learning Climate, followed by Class 4 (high group coaching, high dyadic coaching, high authoritative relationship), Class 3 (medium group coaching, dyadic coaching and authoritative relationship). The level of Manages the Instructional Programme was perceived as higher by teachers from Class 5 and Class 4, compared with those of Class 3. Teachers from Class 2 (high group coaching, low dyadic coaching, low authoritative relationship) and Class 1 (low group coaching, dyadic coaching and authoritative relationship) tended to perceive the instructional leadership of their leaders as lowest, with no significant difference between these two classes. These results indicated that higher dyadic coaching and lower authoritative relationship contributed to higher levels of instructional leadership perceived by teachers.
Table 4 Analysis of variant results comparing means across latent profiles Varia
ble
Class 1 M (SD)
Class 2 M (SD)
Class 3 M (SD)
Class 4 M (SD)
Class 5 M (SD)
ANOVA
F (p) Post hoc
tests
DSM 3.09(.
89)
3.04(.
88)
3.76(.
73)
4.56(.
58)
4.83(.
33)
198.33(.000) 5>4>3>2=1
MIP 3.01(.
81)
3.13(.
68)
3.71(.
67)
4.54(.
55)
4.66(.
36)
234.26(.000) 5=4>3>2=1
DPSL C
3.08(.
79)
3.14(.
66)
3.73(.
66)
4.50(.
80)
4.74(.
31)
228.57(.000) 5>4>3>2=1
Note. M=means; SD=standard deviations; DSM=Defines the School Mission;
MIP=Manages the Instructional Programme; DPSLC =Develops a Positive School Learning Climate. Rating format is 1=7, where 1= totally disagree and 7=totally agree.
Discussion and Conclusion
The present study defined and measured the process of instructional coaching in terms of behaviours and relationship and examined the association between patterns of instructional coaching and leadership. The framework combining group and dyadic coaching behaviours and relationships could reliably and validly capture variations in instructional coaching experienced by teachers. Five profiles of instructional coaching were identified, and variations across these five profiles make a significant difference in the effectiveness of kindergarten leaders' instructional leadership as perceived by teachers.
Structure and Measurement of Kindergarten Leaders' Instructional Coaching The instructional coaching process comprises both relationships and behaviours. The present study found that the framework combining both behaviours and relationships could reliably and validly account for the difference in kindergarten leaders' instructional coaching, and instructional leadership varied significantly across different profiles of instructional coaching. This finding suggests that a combination
of group and dyadic coaching behaviours and relationships is a key feature of effective instructional coaching and leadership. This finding is in line with previous studies. Coleman, Sharp and Handscomb (2016) found that leaders in high-performing children's centres demonstrated the ability to display both group and individualized consideration to motivate and support staff development, for instance by supporting formal training and encouraging reflective practice and shared learning.
The dyadic and group coaching could fulfil different purposes and require different coaching behaviours. Dyadic coaching is more effective in addressing individual teachers' needs and providing individualized support to promote reflective practice, while group coaching is more effective in promoting communication and co-construction of shared understanding. These two modes of coaching behaviour can complement each other, and thus both are needed. Therefore, the evaluation, monitoring, training and improvement of instructional coaching should attach significant importance to both relationships and group and dyadic coaching behaviours.
Profiles of Kindergarten Leaders' Instructional Coaching Perceived by Teachers in Chinese context
Five profiles were identified among Chinese kindergarten teachers, and the majority of these teachers belong to profile 3 (moderate behaviour and relationship) and profile 4 (high behaviour and relationship). Profile 5 scored high in two dimensions of coaching behaviours but low in the dimension of authoritative relationship. However, this profile only has a percentage of 7.6%. Most kindergarten leaders in the Chinese context naturally assume authority over teachers in the coaching process, though the social culture in mainland China has experienced a dramatic transformation since the 1978 open-door policy. Therefore, kindergarten leaders should free teachers from compliance to authority and build an equal-status learning organization, and then transform their mode of leadership into distributed leadership (Harris et al. 2007).
Association Between Profiles of Instructional coaching and Instructional Leadership
Coaching behaviours and relationships play different roles in instructional leadership. On the one hand, coaching behaviour is the prerequisite element of instructional coaching. In this study, the profiles from 1 to 4 changed significantly in their group and dyadic coaching behaviours, which leads to a significant rise in instructional leadership. In addition, profiles 4 and 5 had similar levels of two types of coaching behaviours but significant differences in authoritative relationship. However, the leadership of profiles 4 and 5 is significantly higher than in the other three profiles.
These findings suggest that coaching behaviours are prerequisites to improving instructional leadership and that changes in a coaching relationship can have significant impacts on instructional leadership only if coaching behaviours reach a certain level. On the other hand, the elements of the coaching process are associated with components of instructional leadership in different ways. The difference between profiles 4 and 5 lies in the authoritative relationship score, and only leads to a significant rise in the dimensions Defines the School Mission and Develops a Positive School Learning Climate of leadership, except for Manages the Instructional
Programme. Comparatively speaking, coaching behaviours are more closely associated with instructional management, while a coaching relationship is more concerned with emotion- and value-building.
And dimensions of instructional coaching do not develop at the same pace across the five profiles. In carefully examining the features of each profile, we found that group coaching rises significantly from profiles 1 to 2, but that dyadic coaching rises significantly until profile 3. In addition, the authoritative relationship scores get higher and higher as kindergarten leaders more frequently provide group and dyadic coaching from profiles 1 to 4. This suggests that it will be easier for kindergarten leaders to provide more group coaching, but difficult for them to change dyadic coaching, and the authoritative relationship is the element most difficult to change.
Dyadic coaching posed a greater challenge to leaders' abilities to accurately diagnose and better understand individual needs in practical situations and to provide individualized support for teachers. Thus it is comparatively easier to change group than dyadic coaching. Moreover, authoritative relationship was rooted in cultural values about social status and social interactions. In traditional Chinese culture, the positions and roles in the social structure determined an individual's obligations and rights (Liang, 1986); those with administrative power and academic expertise, or those who are simply older, have authority over others in social interactions, and compliance with authority is emphasized. Consequently, it is more difficult to transform an authoritative relationship. Therefore, the empowerment programme for kindergarten leaders could follow a pathway or trajectory whereby group coaching comes first, followed by dyadic coaching and relationships.
References
Akaike, H. . (1973). Information theory and an extension of the maximum likelihood principle. International Symposium on Information Theory, 1, 610-624.
Antoniou, P. , & Lu, M. . (2017). Evaluating the measuring properties of the principal instructional management rating scale in the Chinese educational system.
Educational Management Administration & Leadership, 174114321770028.
Asparouhov, T., & Muthén, B. (2009). Exploratory structural equation modeling.
Structural Equation Modeling, 16, 397–438.
Aubrey, C. , Godfrey, R. , & Harris, A. . (2013). How do they manage? an investigation of early childhood leadership. Educational Management Administration & Leadership, 41(1), 5-29.
Bagozzi, R. P., & Phillips, L. (1982). Representing and testing organizational theories:
a holistic construal. Administrative Science Quarterly, 27(3), 459-489.
Bollen, K. A. . (1989). Structural equations with latent variables. New York, New York, John Wiley and Sons, 1989, 35(7), 289-308.
Brown, S. , & Grant, A. . (2010). From grow to group: theoretical issues and a practical model for group coaching in organisations. Coaching An International Journal of Theory Research & Practice, 3(1), 30-45.
Burchinal, M. R., Cryer, D., Clifford, R. M., & Howes, C. (2002). Caregiver training and classroom quality in child care centers. Applied Developmental Science, 6(1), 2–11.
Coleman, Sharp, & Handscomb. (2016). ‘leading highly performing children’s centres: supporting the development of the ‘accidental leaders’. Educational Management Administration & Leadership, 44(5).
Denton, C. A. , & Hasbrouck, J. . (2009). A description of instructional coaching and its relationship to consultation. Journal of Educational & Psychological Consultation, 19(2), 150-175.
Gerbing, D. W. , & Hamilton, J. G. . (1996). Viability of exploratory factor analysis as a precursor to confirmatory factor analysis. Social Science Electronic Publishing, 3(1), 62-72.
Hair, J. F., Anderson, R. E., Tatham, R. L., & Black, W. (2006). Multivariate data analysis. Upper Saddle River, NJ: Prentice-Hall.
Hallinger, P. & Wang, W. C. (2015), Assessing instructional leadership with the Principal Instructional Management Rating Scale, Springer International Publishing Switzerland, p173.
Henson, & R., K. . (2006). Use of exploratory factor analysis in published research:
common errors and some comment on improved practice. Educational &
Psychological Measurement, 66(3), 393-416.
Hu, L., & Bentler, P. M. (1995). Evaluating model fit. In R. H. Hoyle (Ed.), Structural equation modelling: Concepts, issues, and applications (pp. 76–99). Thousand Oaks, CA: Sage Publications.
Joyce, B. & Showers, B. (2002). Student achievement through staff development. (3rd ed.) Alexandria, Virginia: ASCD.
Kaiser, H. F. (1960). The application of electronic computers to factor analysis.
Educational and Psychological Measurement, 20, 141–151.
Liang, Z. P. (1986). Status society and ethical law (Shen Fen She Hui yu Zhong Guo Fa Lv). Beijing: Reading, 3, 36-42. (in Chinese)
Neufeld, B., & Roper, D. (2003). Coaching: A strategy for developing instructional capacity—Promises & practicalities. Washington, DC: Aspen Institute Program on Education and the Annenberg Institute for School Reform.
OECD. (2006). Starting strong ii: early childhood education and care. Oecd Publishing, 9(4), I-216.
Peugh, J. , & Fan, X. . (2013). Modeling unobserved heterogeneity using latent profile analysis: a monte carlo simulation. Structural Equation Modeling A Multidisciplinary Journal, 20(4), 616-639.
Ping, R. A. . (2004). On assuring valid measures for theoretical models using survey data. Journal of Business Research, 57(2), 125-141.
Pintrich, P. R. , Smith, D. A. F. , Garcia, T. , & Mckeachie, W. J. . (1993). Reliability and predictive validity of the motivated strategies for learning questionnaire (mslq). Educational and Psychological Measurement, 53(3), 801-813.
Schleicher, A. . (2012). Preparing teachers and developing school leaders for the 21st century: lessons from around the world. General Information, volume 2012(8),
112.
Schwarz, G. (1978). Estimating the dimension of a model. The Annals of Statistics, 6, 461–464.
Sclove, S. L. . (1987). Application of model-selection criteria to some problems in multivariate analysis. Psychometrika, 52(3), 333-343.