土壌の物理性 第134号 平成28年12月20日発行(年3回発行) 昭和45年7月31日 学術刊行物承認 ISSN 0387-6012
土壌の物理性
Journal of the Japanese Society of Soil Physics
第 134 号 2016 年 12 月
土壌物理学会
Japanese Society of Soil Physics
土壌の物理性
第 134 号 2016 年 12 月
目 次
巻頭言
塩沢 昌 . . . 1
論 文
Long-term temporal changes in micromorphology of cattle manure compost pellets mixed with soils
H. KUBOTERA, T. YAMANE, Y. WAKIYAMA and Y. ARAKAWA . . . 5
畑地灌漑特集
宮本輝仁·取出伸夫 . . . 15論 文
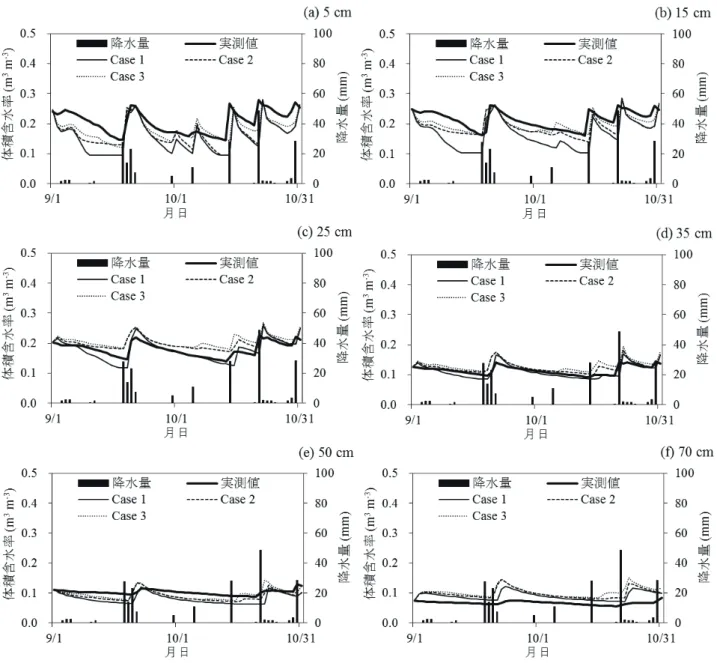
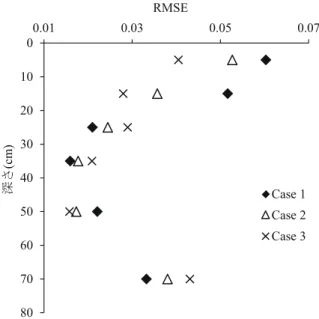
畑地における作物根の分布と土壌面蒸発の変動を考慮した 土壌水分動態解析と消費水量の定量化
弓削こずえ·阿南光政 . . . 17
畑地用水計画のためのHYDRUS-1Dを用いた
土壌水分移動解析における土壌水分特性パラメータの推定例
中村公人·大串祥子·池浦康広·田中宣多 . . . 25
古典を読む
B.W. EAVIS著 「土壌の物理的条件が幼植物根の生育に与える影響
I.砂質壌土における乾燥密度と水分状態により影響される力学的抵抗,
通気性,水分利用の難易度·利用可能性」
佐藤泰一郎 . . . 41
資 料
Improving the impact of soil science by reconsidering the interactions of data, models, and decisions — An ongoing discussion during the 2016 Darcy lecture tour
T.P.A. FERR ´E . . . 51
土粒子
これまでの歩み,わが恩師たち
山下祐司 . . . 61
会務報告
. . . 63編集後記
. . . 69表紙写真の説明
畑地では,様々な灌漑手法で土壌に供給された水分が蒸発や作物根の吸収などによって消費される.消費さ れた水分を無駄なく補い,作物にストレスを与えないような畑地灌漑を行うには,土壌水分動態を解明し,
消費水量を精度よく求めることが必要である.今号より掲載される土壌物理学の知見を活用した畑地灌漑特 集をお楽しみ下さい.
第 14 回( 2016 年度)土壌物理学会(論文賞)選考結果
土壌物理学会 学会賞選考委員会 委員長 溝口 勝 学会賞選考委員会として下記の論文を論文賞としてふさわしいと決定しました.
1 .小島 悠揮 (東京大学大学院農学生命科学研究科)
三石 正一 ( AINEX. Co., LTD. )
溝口 勝 (東京大学大学院農学生命科学研究科)
2 .対象論文
気象 · 土壌観測データと現地画像をリンクした農地 ICT モニタリングの有効性 — 高冷地 キャベツ畑における解析事例 , 土壌の物理性 , 第 131 号 , p. 5–13, 2015.
3 .推薦理由
本研究は,近年進歩が著しいフィールドモニタリング技術を駆使し,気象 · 土壌観測デー タと現地画像をリンクした農地 ICT モニタリングの有効性を嬬恋のキャベツ畑で検証した 論文である.数値データと画像データをリンクすることで,数値データをより深く解釈で きることを実証した点が興味深い.フィールド研究に対する新しい手法の適応事例として 重要な研究である.
論文の質としては全体的に荒削りな感があるが,読者に「自分も測ってみたい」と思わ せる勢いが感じられる.今後,こうした方法による現場解析は増やす必要があり,その意 味では今後の研究の可能性を与える論文として評価できる.
以上の理由により,対象論文は第 14 回土壌物理学会賞(論文賞)に値するものと認め,
ここに推薦する次第である.
本結果は 2016 年 10 月 29 日に開催された評議員会ならびに総会にて全会一致で承認され,総会後
に授賞式が開催されました.
第 14 回( 2016 年度)土壌物理学会(ポスター賞)受賞者
土壌物理学会 学会賞選考委員会 委員長 溝口 勝 開催日: 2016 年 10 月 29 日
会 場: 2016 年度土壌物理学会大会ポスターセッション会場
(京都市:京都大学吉田キャンパス農学部総合館)
以下の発表が会員および選考委員会による投票によりポスター賞に選ばれました.
⃝ 業 績: TDT センサーを用いた諫早湾干拓土中の塩分モニタリング 著 者:平嶋雄太 · 牧野弘樹 · 弓削こずえ · 宮本英揮
⃝ 業 績:宇宙線中性子観測に基づく盛土斜面の土壌水分観測 著 者:牧野弘樹 · 平嶋雄太 · 末次大輔 · 宮本英揮
⃝ 業 績:浸透過程にある 3 種の不飽和土における窒素の吸着と硝化 著 者:中西真紀 · 渡辺晋生
⃝ 業 績:土壌のマクロ団粒化が酵素による土壌有機態窒素の加水分解に及ぼす影響 著 者:福桝純平 · Shaw Liz · 森 也寸志
⃝ 業 績:土壌パイプが閉塞した際の斜面の水文応答
著 者:山崎琢平 · 井本博美 · 濱本昌一郎 · 西村 拓
130 号の訂正とお詫び
土壌物理学会編集委員長 Yanagawa et al. の論文「 Comparison of drought tolerances in a root water uptake model for two co-occurring grass species in Mongolia 」において下記のような誤りがありました.お詫びいたし ますとともに訂正をお願いいたします.
4 ページ 左 48 行目
(誤)
represented by the root length density (cm
−2)
(正)
represented by the root length density ρ (cm cm
−3)
131 号の訂正とお詫び
土壌物理学会編集委員長 荒生らの論文「湛水下の水田表層土における太陽光の透過性と全窒素量の変動」において下記の ような誤りがありました.お詫びいたしますとともに訂正をお願いいたします.
Fig. 5 (エラーバー)
(誤) (正)
131 号の訂正とお詫び
土壌物理学会編集委員長 小島らの論文「気象 · 土壌観測データと現地画像をリンクした農地 ICT モニタリングの有効性
— 高冷地キャベツ畑における解析事例」において下記のような誤りがありました.お詫びいたし ますとともに訂正をお願いいたします.
Fig. 3 説明文
(誤)
葉濡れセンサ出力と相対湿度.
Output of leaf wetness sensor and relative humidity.
(正)
葉濡れセンサ出力と降水量.
Output of leaf wetness sensor and precipitation.
Fig. 4 説明文
(誤)
9 月 7 日から 9 月 11 日まで無降雨期間の葉濡れセンサ出力と降水量.
Output of leaf wetness sensor and precipitation during no rainfall days (9/7/2008 – 9/11/2008).
(正)
9 月 7 日から 9 月 11 日まで無降雨期間の葉濡れセンサ出力と相対湿度.
Output of leaf wetness sensor and relative humidity during no rainfall days (9/7/2008 – 9/11/2008).
9 頁 右 22 行目
(誤)
332.7 mm で,蒸発散量を大きく上回っていた.
(正)
554.7 mm で,蒸発散量を大きく上回っていた.
132 号の訂正とお詫び
土壌物理学会編集委員長 齊藤らの論文「表層地盤におけるフィンガー流の発生と物質輸送に関する数値実験」において下 記のような誤りがありました.お詫びいたしますとともに訂正をお願いいたします.
Table 1 r の単位
(誤)
mm hr
(正)
mm hr
−1Fig. 11 説明文
(誤)
Sk
waと a
′Lの関係.
Relationship between S
waand a
′L.
(正)
S
waと a
′Lの関係.
Relationship between S
waand a
′L.
J. Jpn. Soc. Soil Phys.
土壌の物理性
No. 134, p.1∼p.3 (2016)
物理の普遍性と現象の多様性
塩沢 昌
1物理現象を支配する法則と物質の物理特性には普遍性がある.力の釣り合い(作用と反作用)や質量·エネルギー 保存則などの物理法則は地球上の,いや宇宙のどこでも同様に成立するし,水や空気の粘性·密度·表面張力·熱伝導 率など物質の特性は,宇宙のどこでも同様である.そして,全ての物理現象は,物理法則と物質の物理特性によって 説明され,人が理解できるかどうかは別にして,説明できない不思議な現象は存在しない.土の中の物理現象も全く 同様である.土壌中でしか成立しない物理法則や物質特性は存在しない.ダルシー式や溶質拡散などの特有の基本式 は,水の粘性や分子の熱運動など,より基本的な物質特性からその根拠が説明されるが,そういう本質的なことは普 通のテキストにはほとんど書かれていないので,自分でよく考えて納得することが大切である.
環境科学としての土壌物理学における重要な現象で,支配メカニズムを理解するのが難しいのは,蒸発(植物の蒸 散を含む)だと思う.身の周りで生じているありふれた現象であるが,蒸発速度E(蒸発表面における水蒸気フラッ クス)がどのように決まるかを理解するのは容易ではない.蒸発速度は二つの物理法則に支配される.一つは,大気 境界層における熱物質輸送が上下の空気の混合によって生じるというメカニズムで,大気の混合速度を示す交換係数 Khを比例定数として,蒸発表面と上空との水蒸気濃度差(ρs−ρa)に比例して水蒸気が,温度差(Ts−Ta)に比例し て顕熱が輸送されるという輸送式で表される.これは乱流拡散の結果として誘導される.もう一つの支配法則は,蒸 発表面において熱収支式が満たされなければならないという制約条件である.すなわち,液状水が水蒸気に相変化す
るには2450 J g−1もの大きな潜熱が必要で,蒸発で消費される潜熱に等しい熱が別途,供給されなけれなければなら
ない,ということである.ここで決定的に重要なのが,大気の飽和水蒸気濃度ρ∗が温度T の関数(下に凸の増加関 数)であるという水蒸気の特性である.この特性曲線ρ∗(T)を介して,①水蒸気輸送式,②顕熱輸送式,③熱収支式 が同時に満たされるように表面温度Ts(未知数)が自動調整され,Eが決まる.ρ∗(Ts)を線形近似して,上記3式の 連立一次式をEについて解いたのが,ペンマン·モンティース式である.
著者は,学生に蒸発のメカニズムを理解させるために,以下の問題を考えさせることにしている.問題1:「相対湿 度100%の室内にある水面から蒸発が生じるか」,問題2:「野外の蒸発は風が強いほど大きくなるか」.問題2.は簡単 ではなく,これを説明できれば蒸発のメカニズムの理解は十分と言える.大気中の水蒸気輸送式だけをみれば,風が 強いほどKhが大きくなるので蒸発は大きくなると思ってしまう.この問題を正しく理解するのに大切なことは,蒸 発が継続するには熱源が必要だということである.野外環境における蒸発の熱源は二つある.一つは,表面温度が気 温より低下する場合に空気との温度差によって大気から与えられる顕熱であり,空気の相対湿度が100 %より低下し ているために生じる.蒸発のもう一つの,そしてより重要な熱源は,太陽を熱源とする正味放射(純放射)である.
Fig. 1 ρ∗(T)と蒸発の駆動力.
前者では,顕熱の供給がKhに比例するので,E もKhに比例する.一方,大気の湿度が飽和で 純放射のみによる蒸発を考えると,表面温度Ts は気温Taよりも上昇し,顕熱も潜熱も表面か ら大気に向かう方向になり,純放射が顕熱と潜 熱に配分される形で熱収支が成立する.Khが 大きくなると,Tsが低下してρ∗(Ts)も低下す るが,顕熱と潜熱の配分割合は変わらず,Eも 顕熱もKhの影響を受けない.ペンマン·モン ティース式は,純放射によるE(第1項)と大 気の相対湿度低下によるE(第2項)からなり,
第2項は風速が大きいほど大きいKhに比例す るが,第1項は純放射と気温だけで決まり,Kh を含まないため風速に依存しないのである.
1東京大学大学院 農学生命科学研究科
2 土壌の物理性 第134号 (2016)
以上により,濡れた表面からのE(ポテンシャル蒸発)を決める気象要因は,第一に日射量,第二に気温であり,風 速は,とくに相対湿度が高い湿潤地域の場合,重要ではない.
では,ポテンシャル蒸発のE はどの程度の値であろうか.これは地球の熱収支と大気循環から平均値を概算でき る.太陽からの放射の一部が地表に到達して地表を加熱して温度を上昇させ,純放射が顕熱と潜熱に配分され対流に よって大気上空に運搬され,大気上空から長波放射として宇宙空間に放出されて,地球の熱収支が保たれる.大気圏 外の太陽に垂直面の日射量(太陽定数)は1366 W m−2である.これを一日に積算し,球の表面積と断面積との比
(=4)で割って地球表面平均とし,蒸発潜熱で割って蒸発水深に換算すると12 mm d−1である.このうち短波放射と して地表に達して熱になるのは50 %で,地表の長波放射収支の結果として20 %は長波放射で上空に向い,純放射は 大気圏外日射の30 %とされている.地球の平均気温15◦Cでの潜熱と顕熱への配分割合はペンマン·モンティース 式よりおよそ2 : 1なので,Eの地球平均は約2.5 mm d−1と算定できる.
次に,土壌表面の乾燥が進んだ場合の蒸発低下現象を考えよう.土壌表面の乾燥状態は土壌水移動の結果として決 まるが,表面の水ポテンシャルψwの低下が相対湿度hrを低下させ,表面と大気との湿度差で決まる蒸発を低下させ る.これを支配する重要な特性が水蒸気の水ポテンシャルψwと相対湿度hrとの関係である.hr(ψw)は指数関数で あるが,hrとlog(−ψw)との関係をグラフに描けば,乾燥による蒸発低下がわかる.すなわち,ψwが永久シオレ点 のpF 4.2に低下してもhr=0.99でほぼ飽和であり蒸発はほとんど低下せず,pF 5.2でhr=0.9,pF 6.0でhr=0.5, pF 7.0でhr=0.00なので,例えば大気の相対湿度がhr=0.5の場合,土壌表面の水分状態がpF 5.0∼pF 6.0におい て乾燥による蒸発速度の著しい低下があり,日射による加熱がなければpF 6.0で蒸発が停止することがわかる.この ようにhr(ψw)により,一般に乾燥が進むのに蒸発速度が低下しない恒率蒸発段階と蒸発速度が低下する減率段階が存 在するという重要な現象を説明できる.hr(ψw)は,土壌物理学で最も重要な式と言ってよいが,この関係式は,水ポ テンシャルの原理的な定義「等温等空気圧下で,容器内の純水を基準状態としてその微少量を測定状態に移すための 可逆的な仕事を移した水の単位量当たりで示したもの」に基づいて説明できる.熱力学の基本式ではあるが,これも 熱力学の教科書に納得できる十分な説明がないように思うところで難しく,自分で考えて納得することが大切である.
土壌水のポテンシャルエネルギーには,基準状態と測定状態(定義する状態)のとり方によってマトリックポテン シャル(ψm:土の中の土壌溶液と平衡する土の外の土壌溶液が示す圧力),浸透ポテンシャル(ψo),水ポテンシャル
(ψw=ψm+ψo)の三つの主要なポテンシャルエネルギーが定義され,それぞれ水移動における役割が異なるのであ るが,何れも,基準状態と測定状態との間で微少量の水を移す「可逆的な仕事」によって定義される.この原理的な 定義の背景には熱力学第2法則にある.すなわち,所定の外的条件下(等温等空気圧)で系の状態変化から引き出せ る「仕事」(自由エネルギー)は,系内の可逆的な(言い換えると準平衡状態の)物質移動に対しては保存されるが,
現実の物質移動は非可逆過程であり,熱になって散逸する分,低下するためである.熱力学はエネルギーがやりとり される二つの基本形態である「熱と仕事」の関係についての科学であるが,ここには二つの基本法則しかない.著者 の流儀で簡単にいえば,熱力学第1法則は仕事と熱がエネルギーとして等価であることを主張し,第2法則は仕事と 熱が等価ではないことを主張するものである.この法則が必要条件として多様な現象を制約している.熱力学法則は 重要ではあるが,必要条件を与えるにすぎず,多様な個別の物理現象が熱力学だけで決まるのではない,という理解 は大切だと思う.
水ポテンシャルについて一つ指摘しておきたい.「水移動は水ポテンシャルの高い方から低い方に生じる」という
「法則」は物理学には存在しない,誤解である.土壌中の液状水は力(圧力勾配と重力)によって移動し,水蒸気は濃 度の低い方に拡散する.土壌中に塩濃度差があれば液状水は水ポテンシャルが高い方にも移動するし,温度の違いが あれば水蒸気は水ポテンシャルの低い方から高い方向にも(すなわち,高温側から低温側に)拡散する.境界条件の 変動に対して系内の水ポテンシャルが均一な平衡状
態になろうとするが,これは個々の具体的な制約条 件下で,溶質の拡散,熱移動,水移動など多様な熱物 質移動によって生じる.すなわち,土壌内の温度差 は熱移動(主に熱伝導と潜熱輸送)を,土壌水中の溶 質濃度差は溶質拡散を,水蒸気濃度差は水蒸気拡散 を,水の圧力(マトリックポテンシャル)差と重力 は液状水の移動をもたらし,根の半透膜を介しては 植物と土壌水との水ポテンシャル差による根の吸水 が生じる.この多様な熱物質移動の結果として,温 度が均一で,土壌水中の水理ポテンシャルおよび溶 質濃度が均一で,「土壌–植物」系を含めて水ポテン
シャルも均一な平衡状態に向かおうとするのである. Fig. 2 相対湿度と水ポテンシャルとの関係.
巻頭言 3 土壌物理学,土質力学,水理学,気象学などの学問分類は人の都合で勝手に分けたにすぎず,研究対象の自然に区分 があるわけではない.客観的に実在するのは,全てが互いに関連する,物質の諸現象が構成する唯一の自然界であり,
そこでの物理法則と物質特性は普遍的で,「学問分野による違い」はあり得ない.自然や社会を理解するには,個々の 知識を関連づけて全体を構成することが必要である.百科事典のような知識がいくらあっても,関連のないバラバラ なものであれば死んだ知識でほとんど役立たない.人が「分かった」と納得するのは,新たな認識がそれまでの自分 の知識と関連がついて全体の体系の中に位置づけられることである.物理現象のメカニズムを理解するには,具体的 な問題をいろいろな側面から自分の頭で考え抜くことが不可欠で,それはこの上なく楽しいことである.
デュアルヘッドイン フィルトロメータ
アイネクス株式会社(⽇日本総代理店)
〒144-0035 東京都⼤大⽥田区南蒲⽥田2-16-1 NOFテクノポートカマタセンタービル
TEL:03-5713-0388 FAX:03-5713-1388 Web site:www.ai-nex.co.jp
VP-4 温度・相対湿度・気圧センサー UMS T8 テンシオメータ
VP-4は温度,相対湿度,
気圧を測定する⼩小型のセ ンサーです.湿度の変化 に素早く反応し温度を正 確に測定します.SDI-12 による制御も可能です.
デュアルヘッドインフィルトロメーターは全⾃自動で現場 飽和透⽔水係数(Kfs)を測定する装置です.
■ 技術仕様
測定範囲 +100 ~− 85 kPa 精 度 ± 0.5 kPa シャフト直径 25 mm 供給電圧
UMS社のT8テンシオメータ がEm50に接続できるように なりました.
T8は外部補⽔水機能が付いて いるので圃場から抜かない でカップへの補⽔水が可能で す.
■ 技術仕様
FOG II デジタル⼟土壌 カルシメーター
FOG IIデジタル⼟土壌カルシメーターは6N塩酸(HCl)を⽤用 いて⼟土壌中の全炭酸塩含有量を測定する装置です.
■ 技術仕様
■ 技術仕様 相対湿度 0 ~100 %
温 度 − 40 ~ 80 ℃ 気 圧 49~109 kPa ケーブル長 5 m
測定単位 %CaCo3
測定範囲 0~100 %CaCo3 精 度 0.5 %CaCo3 浸潤速度範囲 0.0038~115 cm/hr
圧力水頭範囲 0~40 cm 動作温度 0~50 ℃
J. Jpn. Soc. Soil Phys.
ͷཧੑ
No. 134, p.5∼13 (2016)
Long-term temporal changes in micromorphology of cattle manure compost pellets mixed with soils
Hideo KUBOTERA
1,2, Tsuyoshi YAMANE
1, Yasuyuki WAKIYAMA
1and Yusuke ARAKAWA
1,3Abstract: Compost pellets (PC) are different from non- pelletized composts in various properties including supply and retention of nutrients and production of greenhouse gases because of the micromorphology of PC. Therefore, it is important to micro-morphologically characterize PC for its proper utilization. We investigated long-term changes in the micromorphology of cattle manure PC after its applica- tion in a soil. The PC grains were applied in a three-types soil core containing a Lowland soil, a Yellow soil, and an Andosol. The soil cores were buried in a field plot of its soil type. After 1, 6, and 18 months, the soil core was sliced into thin sections after solidifying with a polyester resin for the cross-sectional observation. Decomposition of the compost was also investigated using a glass-fiber filter bag method. Results from the investigation were as follows. 1) Weight residual ratio and carbon residual ra- tio of PC decreased rapidly in the first 6 months, and after that the decomposition became slower. 2) With the decom- position of PC, their shape was preserved, whereas their volume decreased. Estimated volume residual ratio of PC was 28 % for Lowland soil, 43 % for Yellow soil, and 39 % for Andosol after 18 months. Voids corresponding to the volume loss of PC by decomposition was formed around each PC grain. 3) PC mixed with the Yellow soil were cross-sectionally divided into curved segments by cracks whereas this separation was not observed in the Lowland soil and Andosol. 4) Internal microstructure of PC did not show a clear temporal change from 1 month to 18 months in any of the examined soils. Microstructure type was mas- sive microstructure to subangular blocky microstructure, with poor separation of peds.
Key Words: compost pellets, decomposition, micromor- phology, thin sections, burial experiment
1. Introduction
Compost pellets (hereafter PC: pelletized compost) are
1Kyushu Okinawa Agricultural Research Center, NARO. 2421 Suya, Koshi, Kumamoto, 861-1192, Japan.
2Present address: Central Region Agricultural Research Center, NARO.
2-1-18 Kannondai, Tsukuba, Ibaraki, 305-8666, Japan.
3Present address: Kyushu Okinawa Agricultural Research Center, Miyakonojo Research Station, NARO. 6651-2 Yokoichicho, Miyakonojo, Miyazaki, 885-0091, Japan, Corresponding Author: Hideo KUBOTERA 20165݄9डߘɹ20169݄24डཧ
obtained by the compression of compost using a disk pel- leter or extruder machine after pulverization and mois- ture content adjustment. PC has various advantages over regular compost of easy handling, homogeneous nutri- ents, longer-term storage, and lower transportation costs (Yakushido, 2002), and therefore, is becoming increas- ingly popular among farmers. Although constituents of composts are concentrated as the moisture decreases with the pelletization, concentration of major components such as total nitrogen, phosphate, and potassium on dry matter base, is similar to that of the compost before it is pelletized (Kano et al., 1997; Hara, 2005; Araki et al., 2007). How- ever, PC is different from non-pelletized compost with re- spect to properties such as nitrogen mineralization (Araki et al., 2007), phosphate efficiency (Arakawa, 2012), re- tention and leaching of inorganic ions (Haraguchi et al., 2008), and production of greenhouse gases (Inoue and Shibukawa, 2008; Yamane and Yamada, 2009; Yamane et al., 2011). These differences can be ascribed to the mor- phological characteristics of PC, especially the internal mi- crostructure that can be quite different from regular com- post. Morphological characteristics of PC can affect var- ious physical and chemical phenomena such as retention and leaching of ions, redox status, and microbial activities.
Therefore, studying the morphology of PC is important to investigate unique properties of PC and further improve ef- fective application methods. However, there are limited studies how the micromorphology of PC changes after ap- plying PC in a field.
We developed a technique for observing the micromor- phology of PC, which employs the thin section method used in soil micromorphology studies. With this technique, we investigated internal micromorphology of cattle ma- nure compost PC that were collected from an Andosol field at 1 to 31 days after application (Kubotera et al., 2009). As a next step, we further applied our thin section method to the cattle manure PC that was packed in polyvinyl chlo- ride pipes with three representative cultivated soils of the Kyushu Okinawa region, after long-term (1 to 18 months) burial treatment as reported in this paper. Our objectives in the current research were, 1) long-term investigation, 2)
6 ͷཧੑɹୈ134߸ɹ(2016)
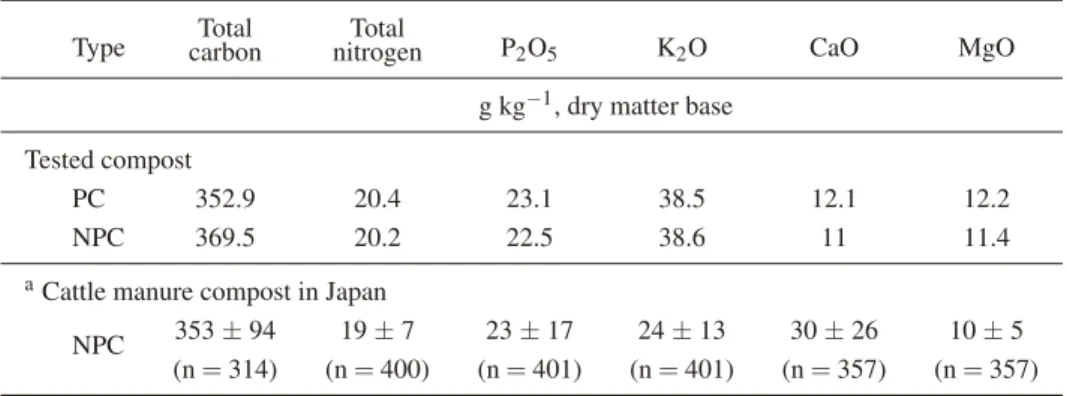
Table 1 Chemical composition of the pelletized compost (PC) and non-pelletized compost (NPC) used in the experiment.
Type Total Total
P2O5 K2O CaO MgO
carbon nitrogen
g kg−1, dry matter base Tested compost
PC 352.9 20.4 23.1 38.5 12.1 12.2
NPC 369.5 20.2 22.5 38.6 11 11.4
aCattle manure compost in Japan
NPC 353±94 19±7 23±17 24±13 30±26 10±5
(n=314) (n=400) (n=401) (n=401) (n=357) (n=357)
aData from Yamaguchi et al. (2000) is shown. Average±SD
studying the morphology of PC for different soil types, and 3) observation of PC and soils under undisturbed natural condition.
2. Materials and methods
2.1 PC for experiment
We prepared PC for the experiment from cattle (primar- ily milk cows) manure compost produced in a composting plant in Yamaga City, Kumamoto Prefecture. The chem- ical composition of the PC and its parent material, non- pelletized compost (hereafter NPC), are shown in Table 1. Total carbon and total nitrogen contents were measured by the dry combustion method using a Vario EL, Elemen- tar. Phosphorus content was measured using the molyb- date yellow method, while potassium content was mea- sured using the flame emission method. Calcium and mag- nesium were measured by ICP-AES after digestion with nitric-perchloric acid. As per the data from literature (Ya- maguchi et al., 2000), this PC was similar in chemical com- position to the commonly available Japanese cattle manure compost. In addition, the chemical composition of PC and NPC were similar.
The compost was air-dried in a greenhouse and pulver- ized, followed by addition of water to yield an approxi-
mate water content of 0.27 kg kg−1, before pelletization was done using a disk pelleter with holes of 5 mm in diam- eter. After the pelletizing, the PC was air-dried again in a greenhouse until about 0.10 kg kg−1water content. Shape of the PC after the air-drying was columnar, and its size was 4.8 mm in diameter and 7.4 mm in height (average of 30 grains). Average weight was 0.159 g per grain.
2.2 Field burial experiment
The experiment was conducted with three representative cultivated soils of the Kyushu Okinawa region: a Lowland Paddy soil (hereafter “Lowland soil”), a Yellow soil, and an Andosol. We collected topsoil samples of Lowland soil, Yellow soil, and Andosol from experimental fields of Saga Prefectural Agriculture Research Center in Saga City, Na- gasaki Agricultural and Forestry Technical Development Center in Isahaya City, and Kyushu Okinawa Agricultural Research Center in Koshi City, respectively. The soils were air-dried and passed through a 4 mm mesh sieve, and their core samples were prepared as follows.
Polyvinyl chloride pipes of 2.5 cm bore diameter were cut into approximately 2 cm long pieces, and a piece of root restriction sheet was pasted onto one opening of each pipe piece to serve as the bottom cover. Root restriction sheet is a polyester cloth that can keep the sample from intrusion of roots, worms and insects although the air and
Fig. 1 Preparation of core samples with PC.
จɿLong-term temporal changes in micromorphology of cattle manure compost pellets mixed with soils 7 water can permeate. These pipes were then half-filled with
one of the soils, and 5 grains of PC were laid sideways on the soil (Fig. 1). Next, the pipes were filled with addi- tional soil and pasted with another piece of root restriction sheet as the top cover. Hereafter, we refer to these as “core samples.”
Three types of soils without air-drying were packed about 15 cm deep in square plots (1 m×1 m) that were separated using concrete boards up to a depth of 1 m, in the experimental field of Kyushu Okinawa Agricultural Re- search Center, Koshi City. Core samples of each soil were buried vertically at a depth of 5 cm on May 25, 2011. The plots were kept bare with manual weeding. Two core sam- ples from each soil plot were collected periodically. The samples collected at 1 month, 6 months, and 18 months after the burial were used for micromorphology observa- tions.
In addition to the core sample burial experiment, we con- ducted a burial experiment using the glass-fiber filter pa- per bag method (Saito, 1997), in order to investigate the decomposition of composts. We took around 4 g of PC samples, and weighed them precisely. And then we mixed them with 15 g of air-dried soils. The mixture was en- wrapped using an envelope of glass-fiber filter paper to pre- vent contamination of samples with outer soils. The filter paper is resistant to microbial decomposition and therefore is preservable in soils for a long period. This envelope was then covered with a root restriction sheet in order to pre- vent the intrusion of worms and insects. Samples that con- tained the NPC instead of PC, and control samples with- out any compost, were also prepared in the same manner for the comparison of decomposition rates. Samples were buried in the plots of each soil on March 30, 2011, and collected periodically at 1, 3, 6, 12, and 18 months after the burial. Weight residual ratio and carbon residual ratio were measured by the method of Saito (1997) as follows.
The collected samples were air-dried, weighed and pulver- ized finely. Then the moisture content was measured by weighing a portion of the sample before and after the oven drying at 105◦C. Total carbon content of the samples was measured by the dry combustion method using a Vario EL, Elementarr. Weight residual ratio and carbon residual ratio were calculated as follows:
Weight residual ratio(%) =W2−W1 W0 ×100
Carbon residual ratio(%) =W2×C2−W1×C1 W0×C0 ×100 WhereW0is the dry weight (g) of PC and NPC that was
enclosed in an envelope, andC0is the initial carbon content (g kg−1) per dry sample of PC and NPC.W1andC1 are the dry weight and carbon content of whole contents in an envelope of control sample without PC and NPC, andW2 andC2are those of a sample with PC and NPC.
2.3 Preparation of thin sections
Thin sections were prepared following Kubotera et al.
(2009) as follows. A collected core sample was air-dried and placed in a paper cup. Polyester resin mixed with ben- zoyl peroxide dissolved in acetone was poured in the cup, and the core sample was saturated with it by de-aerating in an airtight container using a vacuum pump. Next, the cup was placed in a drying oven and the temperature was gradually raised from 45◦C to 65◦C in order to solidify the resin. The solidified block of soil was cut out from the pipe using a jigsaw and a cutting machine (Maruto In- strument MC-110) equipped with a rotary blade. A cross- sectional cut was then made in the solidified soil block at the mid-height using the rotary blade. The cutting posi- tion was particularly crucial for the experiment. Because, if it was not proper, some PC grains would be lost from the thin section. Furthermore, the cutting plane needed to be located close to the central axes of PC grains, because the micromorphology might be different at the center and at the edge of PC. Therefore, we compared the condition of the two pieces, and the one that had the cut plane near the central axis of the PC was selected for further analyses. If the condition of both cut pieces was not good, we prepared a new solidified sample using another core sample from the first step of resin impregnation. The cut plane was pol- ished using the Carborundum, a silicon carbide abrasive compound. Different grain sizes of the compound, # 100,
# 300, # 600, and # 1000, were used in the ascending or- der (from coarse to fine). The polished plane was pasted on a slide glass using epoxy adhesive, and it was cut using the rotary blade to obtain samples of 1 mm thickness or less. The samples were polished repeatedly using the com- pound, until the internal voids and solids parts of the pellets became clearly observable and the solid parts turned from dark green to dark orange in color, when observed under a microscope.
As stated above, in case the quality of in-process or completed thin sections was not good, we discarded them and prepared new thin sections from another core sample.
However, in some cases, the second thin section also had a problem. For example, Lowland soil 1 month thin section shown in Fig. 4 contained only 4 grains and the PC in left edge was too thin by overpolishing. In such cases, obser- vation and morphological analysis was conducted only for the remaining, good-condition grains.
2.4 Micromorphology investigation
Micromorphology observation in low magnification was
8 ͷཧੑɹୈ134߸ɹ(2016)
Fig. 2 Weight residual ratio of PC and NPC measured using glass-fiber filter paper bag method.
Error bars were added in order to show the SD (n=2). However, all error bars were hidden under the markers because SD was smaller than 4 % in all samples.
Fig. 3 Carbon residual ratio of PC and NPC measured by glass-fiber filter paper bag method.
Error bars were added in order to show the SD (n=2). However, most of the error bars were hidden under the markers because SD was smaller than 7 % in many samples.
conducted using scanned images of the thin sections. The voids that were formed around the PC after a long burial period were measured as follows. We printed the image of a thin section, cut out the pellets and the voids with scissors, and measured its weight (a grams). The voids around the pellets were then cut away, and the weight of the cutouts was measured (b grams). b/a was the ratio of pellet area to the total area of pellets and surrounding voids. Volume is proportional to the cross-sectional area raised to the three second power, therefore, we considered (b/a)3/2as the volume ratio of a pellet to the total space including the surrounding void. In this paper, we refer to the value of 100×(b/a)3/2as “volume residual ratio” (%).
Micromorphology observation in high magnification was done using photographs obtained by a digital cam- era attached to a microscope. We took a photograph of size 1.97 mm × 1.58 mm at the center of PC, for all 5 grains within each core sample. As stated above, if some PC grains were lost or in bad condition, five pho- tos were taken for the remaining good-conditioned grains.
We measured the area ratio of voids in PC using a freeware named “lia 32 for Windows 95”, developed by Yamamoto K. (http://www.agr.nagoya-u.ac.jp/~shinkan/LIA32/index-
e.html) as follows. We opened the image file for each photo using this software and collected the color data from 50 points among voids and 50 points among solids. Based on these color data, the software classified all the 3871488 pixels in one image, as either a void or a solid. Ratio of the number of void pixels or solid pixels to the total number of pixels (3871488) was assumed to be the area ratio of each phase.
3. Results and discussion
3.1 Decomposition rate of compost
Weight residual ratio and carbon residual ratio are shown in Fig. 2 and Fig. 3, respectively. Weight residual ratios at 1, 3, and 6 months after the burial were 89 % – 98 %, 87 % – 94 %, and 66 % – 80 %, respectively. The temporal de- crease became slower after 6 months, and the weight resid- ual ratio of PC at 18 months was 60 % in Lowland soil, 62
% in Yellow soil and 59 % in Andosol. The residual ratio for NPC was 56 % in Lowland soil, 62 % in Yellow soil and 50 % in Andosol. Although differences among the types of soils and compost were not clear, NPC in Andosol at 6 months (66 %), 12 months (56 %), and 18 months (50
จɿLong-term temporal changes in micromorphology of cattle manure compost pellets mixed with soils 9
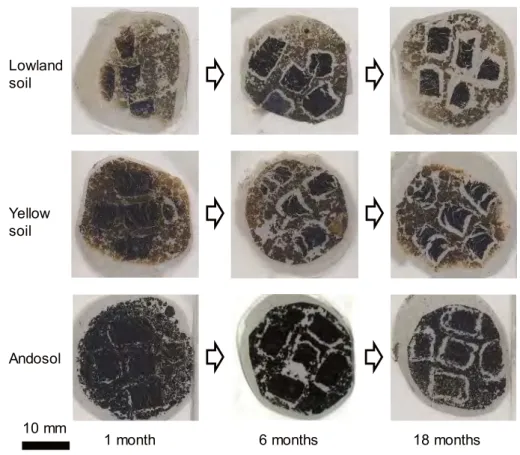
Fig. 4 Micromorphology of whole core samples.
%) showed relatively lower values in comparison with the other samples (73 % – 80 % at 6 months, 65 % – 72 % at 12 months, and 56 % – 62 % at 18 months).
Carbon residual ratio also showed a rapid decrease in the first 6 months, followed by a slower decrease in subsequent periods. In the first 3 months, the ratio was higher for NPC samples than for the PC samples. However, it decreased rapidly and became 4 % – 7 % smaller for NPC than for PC at 6 months or later. As for the soil types, Andosol had lower values than for Lowland soil and Yellow soil in the later periods and carbon residual ratio of Andosol at 6, 12, and 18 months was 53 % – 59 %, 50 % – 56 %, and 38 % – 46 %, respectively, whereas Lowland soil and Yellow soil had values in the range of 62 % – 75 %, 61 % – 71 %, and 45 % – 52 %, respectively.
Carbon residual ratio showed a slightly larger decrease between 12 and 18 months than between 6 and 12 months, which was probably due to the differences in soil temper- ature across these periods. Average air temperature be- tween 6 and 12 months (October 2011 to March 2012) was 10.7◦C in Kumamoto City (Japan Meteorological Agency, 2012), whereas that between 12 and 18 months (April to September 2012) was 23.5◦C. Therefore, decomposition of compost in the latter period is expected to be more rapid than in the former period.
As seen from the trends for weight and carbon resid- ual ratio, compost decomposition occurred rapidly in the first 3 months and became slower thereafter. Residual ra-
tio of weight and carbon for PC after 6 months was slightly higher than that of NPC, and Andosol samples showed lower values in comparison with Lowland soil and Yellow soil.
3.2 Micromorphology of thin sections
Micromorphology of thin sections under low magnifica- tion is shown in Fig. 4. Coarse voids formed between the PC surface and soil had a tendency to increase in size over time. As shown in Fig. 5, the outer rim of the voids (i.e.,
Fig. 5 Similarity in the shape of PC surface and surrounding voids. Red line and yellow line respectively indicate the outer rim and inner rim of the voids between the PC and soil. (Lowland soil 18 months sample, lower left grain).
10 ͷཧੑɹୈ134߸ɹ(2016)
Fig. 6 Residual ratios of weight and volume of PC.
Volume residual ratio ( %)=100×(b/a)3/2 a: area of PC and the voids around PC in photo.
b: area of PC in photo.
the boundary between voids and soil, indicated by a red line in Fig. 5) showed shapes similar to the inner rim (i.e., the boundary between PC and voids, the yellow line in Fig.
5). As a result, the shapes of PC and the voids surrounding it were nearly the same. This fact suggested that the de- composition of PC in soils occurred from the outer rim, and the loss of outer layers of PC had left the voids with shapes similar to the initial PC. Relationship between the weight residual ratio and the volume residual ratio (defined in the materials and methods section) is shown in Fig. 6. Both the ratios were closely related and the relationship was similar across Lowland soil, Yellow soil, and Andosol. The deter-
minant coefficient of linear regression was 0.789 (n = 9).
This result indicated that the volume of PC in the fields decreases over time along with the decrease in weight due to decomposition, and the loss of volume causes the for- mation of voids between PC surface and the surrounding soil.
Deformation of PC with time depended on soil type. In the case of Lowland soil, the void formation at the outer rim was a primary change, while transformation of PC, for- mation of internal cracks, or change in the surface smooth- ness of PC were not notable. In Yellow soil, cross-sectional cracks formed and the PC became partially divided. In ad- dition, the divided PC parts were curved and arch-shaped at 18 months. Andosol showed morphological characteristics similar to Lowland soil. Unlike Lowland soil, however, the surface of PC showed roughness at 18 months.
3.3 Internal micromorphology of PC
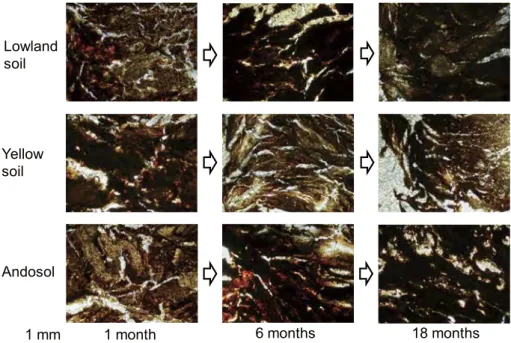
We selected 1 representative photo from 5 micrographs of PC in each thin section, and showed them in Fig.7.
These photos were selected according to the following cri- teria: 1) having a non-extreme (neither the largest nor the smallest) area ratio of voids among the five photos, and 2) having a micromorphology that seemed representative of the five photos. Terms of soil micromorphology descrip- tion (Stoops, 2003) are used henceforth, following the ex- ample of Kubotera et al. (2009).
Although the microstructure of PC was not uniform across the grains and the observed areas, solid phase was dominant in all photos and area of voids was generally small. Dominant types of voids were zigzag planes (e.g., seen in the right half of Lowland soil, 1 month photo)
Fig. 7 Internal micromorphology of PC.
จɿLong-term temporal changes in micromorphology of cattle manure compost pellets mixed with soils 11
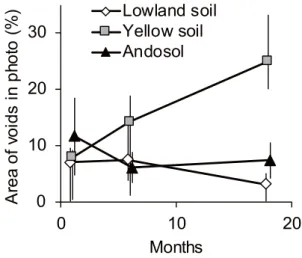
Fig. 8 Temporal changes in the ratio of internal voids in PC. Error bars indicate SD (n=5). Horizontal position of each plot was slightly changed from the accurate value (1, 6, 18 month) in order to make error bars visible.
and curved planes (e.g., seen in Yellow soil, 6 months photo). In addition, vughs (irregular-shaped and not inter- connected voids) with a round or oval shape were also ob- served (e.g., in Andosol, 18 months photo). Packing voids that were interconnected and caused a separation of peds were scarce. A coarse void in the left edge of Yellow soil, 18 months photo (Fig. 7), was a part of the cracks that di- vided PC. The type of microstructure was mainly massive microstructure, and subangular blocky microstructure, in which the peds were poorly separated. Area ratio of the voids at 1 month was 7.0 %, 7.9 %, and 11.6 % in Low- land soil, Yellow soil, and Andosol, respectively (Fig. 8).
Temporal change in the voids ratio showed no clear ten- dency in Lowland soil and Andosol. On the other hand, the voids ratio increased to 14.2 % at 6 months and to 25.0
% at the end of 18 months in Yellow soil. This was not due to an increase in planes or vughs in the solid phase, but was instead caused by coarse cracks, as seen in the 18 months photo (Fig. 7). The internal micromorphology of PC between 1 and 18 months after the burial showed no clear tendency with either the soil type or the time, ex- cept for an increase of voids volume in Yellow soil, which was related to the generation of coarse cracks in PC. We propose two hypotheses on the reason why micromorphol- ogy of PC was similar in the three examined soils: 1) de- composition rate of compost was not remarkably different among the examined soils as shown in the grass-fiber filter paper bag experiment, and 2) interior portion of PC was isolated from the soils, especially after the coarse voids were formed around PC grains, and therefore the internal micromorphology was not subject to the influence of outer soil, as assumed by Hara et al. (2003). However, these hypotheses should be examined by further study.
Kubotera et al. (2009) described the micromorphol-
ogy of cattle manure PC that was collected from an An- dosol field between 1 to 31 days after application. The results showed that the solid phase was separated by var- ious degrees and formed peds of crumbs and granules at 4 days after application. Dominant microstructure types were subangular blocky, while partly crumb and granular microstructures were also observed. Area ratio of voids was 14.0 %, 14.7 %, and 18.0 % at 1, 4, and 31 days after application, respectively.
Our current study documented the micromorphology of PC after a burial period longer than that of Kubotera et al. (2009). Although microstructure type showed a re- semblance to the data recorded by Kubotera et al. (2009), the separation of peds was poor, and partial formation of crumb or granular microstructures was not observed. Area ratio of voids after 1 month was also smaller in compari- son with Kubotera et al. (2009). This difference might be related to the burial conditions, i.e., Kubotera et al. (2009) applied PC to a field with a rotary cultivator, whereas we enclosed PC and soils in pipes and buried them without any physical disturbance.
4. Conclusion
We obtained some results concerning the morphological changes in PC after its application to soils from a burial experiment for 18 months and micromorphology obser- vations using thin sections. The outer shape and internal microstructure of PC were preserved, suggesting that the properties of PC related with micromorphology such as the microbial habitats could be long-term persistent in a soil. At the same time, voids between the PC and soils corresponding to the volume loss and initial shape of PC were formed. These voids might influence the water and air permeability of soils, especially when the PC grains are interconnected with tubular voids formed after the death and decomposition of plant roots that have a tendency to gather around PC (Arakawa et al., 2012). In addition, cracks formed in PC observed in the Yellow soil might also similarly contribute flows in a soil. Further studies regard- ing function and sustainability of these voids, influence of soil types on deformation of PC, and long-term changes in soil water and air permeability after for the PC application should be conducted.
Acknowledgements
Soil samples were provided by Norio Ootsuka (Saga Prefectural Agriculture Research Center) and Masashi Fu- jiyama (Nagasaki Agricultural and Forestry Technical De- velopment Center). Akihiro Tanaka, Yusuke Asai, Yuichi Takakura, Hiroyuki Ito, Masaki Noguchi, Kimiyo Mat-
12 ͷཧੑɹୈ134߸ɹ(2016) suoka, and Sayoko Hirayama (Kyushu Okinawa Agricul-
tural Research Center (KARC), NARO) assisted in the preparation and analysis of samples, and the maintenance of field plots. Takashi Kusaba (KARC, NARO) gave us valuable support of various kinds during the overall study period. Shoko Miyazaki (Nihon University) helped us in void measurement. We sincerely thank all of them.
This study was financially supported by a research project
“Development of mitigation and adaptation techniques to global warming in the sectors of agriculture, forestry, and fisheries” sanctioned by Ministry of Agriculture, Forestry and Fisheries. Budget from research projects 210a3, 151a3, and 151a1 of NARO was also used.
References
Arakawa, Y. (2012): Pelletization of composted manure improves the phytoavailability of contained phosphorus. Jpn. J. Soil Sci.
Plant Nutr., 83: 249–255. (in Japanese with English summary) Araki, M., Yamamoto, T., Koyama, F. and Mizda, Y. (2007): Influ- ence of Livestock Feces Compost Molding on Nitrogen Min- eralization. Bull. Fukuoka Agric. Res. Cent., 26: 31–34. (in Japanese with English summary)
Hara, M. (2005): Study on processing technology of the pelletized compost using swine manure and it’s characteristic of fertilizer efficiency. Bull. Agric. Res. Div. Mie Pref. Sci. Technol. Pro- mot. Cent., 8: 1–71. (in Japanese with English summary) Hara, M., Ishikawa, H. and Obata, H. (2003): Efficiency of pel-
letized compost as a fertilizer. Jpn. J. Soil Sci. Plant Nutr., 74:
453–458. (in Japanese with English summary)
Haraguchi, N., Arakawa, Y., Tanaka, A., Kusaba, T., Yakushido, K. and Yamada, I. (2008): A new method for measuring early nutrient release pattern from manure compost using sand col- umn and its application to some kinds of cattle manure com- post. J. Jpn. Soc. Soil Phys., 110: 37–51. (in Japanese with
English summary)
Inoue, K. and Shibukawa, H. (2008): Nitrous oxide emission from upland soils applied pelletized poultry manure compost. Jpn.
J. Soil Sci. Plant Nutr., 79: 181–182.(in Japanese)
Japan Meteorological Agency (2012): Amedas, Climatic data in the past. Available at http://www.data.jma.go.jp/obd/stats/
etrn/index.php (confirmed at 19. Apr. 2016)
Kano, M., Toyoshima, K., Ohashi, H., Masuda, T., Tanaka, A., Fukutome, Y. and Fujitomo, E. (1997): Experiments on blending and granulating livestock feces compost. Bull. Aichi.
Agric. Res. Cent., 29: 299–304. (in Japanese with English summary)
Kubotera, H., Yamane, T., Wakiyama, Y. and Arakawa, Y. (2009):
Micromorphological observation of pelletized cattle compost using thin sections. Jpn. J. Soil Sci. Plant Nutr., 80: 522–525.
(in Japanese)
Saito, M. (1997): Decomposition of organic matter under field condition (method of glass fiber filter paper burial). In Edito- rial Committee of Methods of Soil Environment Analysis (ed.) Methods of Soil Environment Analysis, pp. 120–123. Hakuyu- usha, Tokyo. (in Japanese)
Stoops, G. (2003): Guidelines for Analysis and Description of Soil Thin Sections, pp. 57–69. SSSA Inc., Madison.
Yakushido, K. (2000): Methods for composting of milk cow waste and pelletization of compost. Kyushu Nogyo Kenkyu, 62: 19–
24. (in Japanese)
Yamaguchi, T., Harada, Y. and Tsuiki, M. (2000): Basic DATA of animal waste composts. Misc. Publ. Natl. Agric. Res. Cent., 41: 1–178. (in Japanese)
Yamane, T., Wakiyama, Y. and Kubotera, H. (2011): Nitrous ox- ide emissions from nitrogen-enriched cattle manure compost pellets applied to an Andosol. Jpn. J. Soil Sci. Plant Nutr., 82:
234–238. (in Japanese)
Yamane, T. and Yamada, I. (2009): Nitrous oxide emissions from cattle manure compost pellets applied to Andosols. Jpn. J. Soil Sci. Plant Nutr., 80: 403–407. (in Japanese)
จɿLong-term temporal changes in micromorphology of cattle manure compost pellets mixed with soils 13
ཁ ࢫ
ଯංϖϨοτʢPCʣɼཆͷอ࣋ڙڅಛੑԹࣨޮՌΨεൃੜͳͲͷ༷ʑͳಛੑ͕ඇܕͷଯංͱҟ ͳ͓ͬͯΓɼͦΕඍࡉܗଶʹىҼ͢Δͱߟ͑ΒΕΔ͕ɼPCͷඍࡉܗଶʹؔ͢Δݟগͳ͍ɽͦͷ
ͨΊɼPCͷඍࡉܗଶಛੑͷղ໌దਖ਼ͳར༻Λߦ͏্ͰॏཁͰ͋Δɽͦ͜Ͱɼะʹࢪ༻ͨ͠PCͷ
ղʹ͏ඍࡉܗଶͷܦ࣌తมԽΛௐࠪ͢ΔͨΊɼڇ;ΜଯංͷPCΛभԭೄҬͷදతͳߞ
Ͱ͋Δɼԫ৭ɼࠇϘΫͱڞʹԘԽϏχʔϧʹ෧ೖ͠ɼะʹຒઃͯ͠ɼ1݄ɼ6݄ɼ18݄ ޙͷඍࡉܗଶΛथࢷݻԽബย๏Ͱ؍ͨ͠ɽ·ͨղΛΨϥεણҡΖࢴຒઃ๏Ͱௐࠪͨ͠ɽͦͷ݁
Ռɼ1) PCͷॏྔଘͱૉଘ࠷ॳͷ6݄ͰͦΕͧΕ73 % – 80 %ͱ58 % – 75 %·Ͱݮগ͠ɼ Ҏޙղ͕Լͯ͠ɼ18݄ޙʹͦΕͧΕ59 % – 62 %ͱ46 % – 52 %ʹͳͬͨɽ2)ղʹ
͍PC࠷ॳͷܗͱ૬ࣅܗΛอͬͨ··ମੵ͕ݮগͨ͠ɽ18݄ޙͷମੵଘͰ28 %ɼԫ৭
Ͱ43 %ɼࠇϘΫͰ39 %ͱͳͬͨɽମੵͷݮগʹରԠ͢Δྔͷ͕ܺPCͷपғʹܗ͞Εͨɽ3) ԫ৭ͱࠞ߹ͨ͠PCΫϥοΫʹΑͬͯྠΓํʹஅ͞Εɼۂ͕ͬͨஅยʹͳͬͨͷʹର͠ɼ
ͱࠇϘΫͰ͜ͷஅݟΒΕͳ͔ͬͨɽ4) PC෦ͷඍࡉܗଶશͯͷʹ͓͍ͯຒઃ1∼ 18݄ͷؒͰ໌ྎͳܦ࣌มԽΛࣔͣ͞ɼඍࡉߏܕશࢼݧظؒɼนঢ়ߏʢmassive microstructureʣ ͳ͍͠ϖουͷ͕ѱ͍ѥ֯մঢ়ߏʢsubangular blocky microstructureʣͩͬͨɽ
ΩʔϫʔυɿଯංϖϨοτɼղɼඍࡉܗଶɼബยɼຒઃࢼݧ
型番 HSC-20
⼟壌の物理性(三相分布)の測定は、感覚的な⼟づくりをより科学的に ⾏う目安を与えてくれます。
従来から用いられてきた100mlの⼟壌採取用コアを4個使用し表層から 20cmまでの⼟壌を採取出来るように改良したものです。
簡便で精度の⾼い試料採取を⾏い定期的な⼟壌の物理性モニタリングを ⾏うことで、保⽔性、通気性のバランスが取れた⼟づくりを⾏うことができます。
※本製品は(独)農業環境技術研究所との共同研究による成果です。
製造販売元 製造販売元 製造販売元 製造販売元
-
-
-
- 弊社ホームページ 弊社ホームページ 弊社ホームページ 弊社ホームページ
www.fujiwara-sc.co.jp本本
本本 社社社社 〒〒〒〒114114114114----002400240024 東京都北区⻄ケ原0024 東京都北区⻄ケ原東京都北区⻄ケ原東京都北区⻄ケ原1111----46464646----16161616 営業部営業部
営業部営業部 TEL 03TEL 03TEL 03TEL 03----3918391839183918----8111 FAX 038111 FAX 038111 FAX 03----39188111 FAX 03 391839183918----8119811981198119 千葉千葉
千葉千葉 営業所営業所営業所営業所 TEL 0438TEL 0438TEL 0438TEL 0438----64646464----0800 FAX 04380800 FAX 04380800 FAX 0438----640800 FAX 0438 646464----0820082008200820 つくば営業所
つくば営業所 つくば営業所
つくば営業所 TEL 029TEL 029TEL 029TEL 029----840840840----1250 FAX 029840 1250 FAX 0291250 FAX 0291250 FAX 029----840840840----1255840 125512551255
J. Jpn. Soc. Soil Phys.
土壌の物理性
No. 134, p.15∼16 (2016)
畑地灌漑への数値解析の応用
宮本輝仁
1· 取出伸夫
2畑地灌漑は畑作物に必要な水分を人為的に供給するこ とである.畑地に供給された水分は,土層の持つ水分保 持能力によって保持されて作物に使われる他,土壌面蒸 発により失われる.また,土層の水分保持能力以上の水 分が供給されると,重力作用により下層へ浸透してしま う.特に,湿潤地帯に属するわが国では,畑地に降った 雨の一部は深部浸透しやすく,干天時や地下水位が浅い 場合などには,下層から根群域への上向きの水分移動が 生じるなど複雑な土壌水分動態を示す.そのため,より 精度の高い水分消費量の算定には,植物の吸水量に加え てそれぞれの畑地固有の土壌水分動態を考慮する必要が ある.
作物の栽培方法も様々なものが農業現場では使われて いる.たとえば,果樹栽培で行われているマルチ栽培と ドリップ灌漑を併用した土壌水分管理技術や,水田の転 換畑利用を可能にする地下水位制御技術なども農業現 場で普及してきている.これらの栽培方法では,畑地の 一部分のみ灌漑が行われたり,また,弾丸暗渠の施工に より土層条件もより複雑となったりしている.このよう に作物栽培において土壌水分動態を予測し,適切な土壌 水分管理を行っていくためには,より複雑な土層·境界 条件のもとでの土壌水分動態の予測が必要となってきて いる.
不飽和土壌中の水分·物質移動のモデル化と数値解析 は,土壌物理学の得意とするところであり多くの研究蓄 積がある.これまでにも「古典を読む」でBuckingham
(1907)をはじめ,Gardner et al.(1922),Richards(1931) などを取り上げて紹介してきた通り,欧米において畑地 の水管理と土壌水分動態を科学的に捉えようとする試み は並行して発展してきた.また,わが国においても,土 壌物理学と畑地灌漑はお互いに貢献しながら発展して きており,これまでの経緯は筑紫·長(1984)や長谷川
(2012)で紹介されている.このように,基礎学問とし ての土壌物理学の応用場面の一つとして、畑地灌漑や畑 地の水管理も捉えることができる.
1 Institute for Rural Engineering, NARO , 3-1-1 Kannondai, Tsukuba, Ibaraki 305-8517, Japan. Corresponding author:宮本輝仁,国立研究開 発法人 農研機構 農村工学研究部門
2 Graduate School of Bioresources, Mie University, 1577 Kurima- Machiya, Tsu 514-8507, Japan.
2016年12月2日受稿 2016年12月2日受理
近年,水分·溶質移動汎用プログラムが整備され,土壌 物理学が応用される周辺分野においても,道具として利 用できるようになってきている.数値解析にもとづく土 壌水分動態解析は,より複雑な土壌水分移動の把握に有 効な手法である.特に畑地における水管理にかかわる試 験·研究をしている研究者·技術者にとって,より効率 的な水管理を検討できるようになることが期待される.
しかし,わが国の畑地灌漑が行われている農業現場に 土壌水分移動解析を適用しようとした場合,まだ多くの 解決すべき課題がある.たとえば,土層条件によっては 多量の降雨や灌水があると計算が収束しない場合がある こと,圃場の土層条件が不均一であり土壌水分特性パラ メータの推定が難しいこと,解析対象とする土壌の境界 条件を設定する際に作物の種類や圃場条件(畝やマルチ の有無等)についても考慮が必要なこと,下層の情報が 限られているときの下部境界条件の設定や地表面からの 蒸発量と蒸散量の評価が難しいことなどが挙げられる.
さらに,砂地の圃場や亀裂の発達した転換畑では土壌水 分特性が極端で,現場のモデル化自体に様々な工夫が必 要である.
このように畑地灌漑を目的にした土壌水分動態解析に は多くの土壌物理的な課題は多いが,土壌物理学会にお いても,数値解析に関する具体的な問題点についてあま り議論がなされてこなかったと思う.これは、新しい数 値解析手法の適用や特殊な物理現象のモデル化に多く の興味が注がれ,既存の汎用プログラムの利用には,あ まり関心が示されてこなかったことも一因である.しか し,畑地灌漑という具体的な場面に数値解析を応用する 際に生じる様々な課題を克服するには,高度な解析技術 が要求され,それらの解決方法に関する有益な情報を共 有していくことは今後益々重要となると思われる.そこ で,編集委員会では新たな試みとして,応用場面を明確 にした汎用プログラムを用いた研究成果についても,土 壌の物理性の投稿規定に記されている「独創性があり,
土壌の物理性に関する技術の進歩に寄与すると見なされ るもの」として積極的に評価することを検討した.
本特集では,畑地灌漑が行われている農業現場への数 値解析の応用をテーマに執筆をしていただき,数値解析 の応用と課題や対処方法について議論する素材を提供い ただいた.弓削論文は,畑地灌漑計画で計画消費水量を
16 土壌の物理性 第134号 (2016) 算定するための現場試験である土壌水分減少法と数値解
析による算定方法について議論する.中村論文は,水分 量変化の計算値を用いて土壌水分減少法による日消費水 量を求めるために,畑地圃場の水分量変化を再現する土 壌水分特性パラメータ推定手法について論じる.Hassan 論文では,灌漑スケジューリングへの植物成長の数値モ デルと天気予報を利用した数値解析の応用について議 論する.坂井論文では,暗渠と弾丸暗渠が直交する地下 水位制御システム導入圃場を対象に3次元的な排水過 程の再現方法や弾丸暗渠の役割について論じる.宮本論 文では,マルチ栽培が行われている圃場のモデル化にお ける境界条件の設定の仕方やマルチの役割について議論 する.
本号では,弓削論文と中村論文を掲載し,次号以降に 他の論文を掲載する予定である.また,補足資料を公開 できる体制が整った土壌物理学会のホームページを利用 して,それぞれの論文内容の理解の助けとなるよう,ま た,数値解析の現場適用上の課題などについて更なる改 良·発展がなされるよう,計算プロジェクトなどの補足
資料を公開していく予定である.本特集を機会に,数値 解析の現場適用に関する研究がなされ,土壌の物理性へ の論文投稿が増えるとともに,学会員間の議論が深まる ことを期待したい.また,本特集へのご意見,提案を編 集委員会までお寄せいただければ幸いである.
引用文献
Buckingham, E. (1907): Studies on the movement of soil mois- ture. U. S. Dept. Agr. Bur. Soils Bul., 38: 1–61.
筑紫二郎,長 智男(1984):畑地潅漑.土壌の物理性, 50: 16–19.
Gardner, W., Israelsen, O.W., Edlefsen, N.E. and Clyde, H.
(1922): The capillary potential function and its relation to ir- rigation practice. Phys. Rev., 20: 196.
長谷川周一(2012):日本の土壌物理研究の歴史を振り返る.土壌 の物理性, 120: 5–14.
Richards, L.A. (1931): Capillary conduction of liquids through porous mediums. Physics, 1: 318–333.