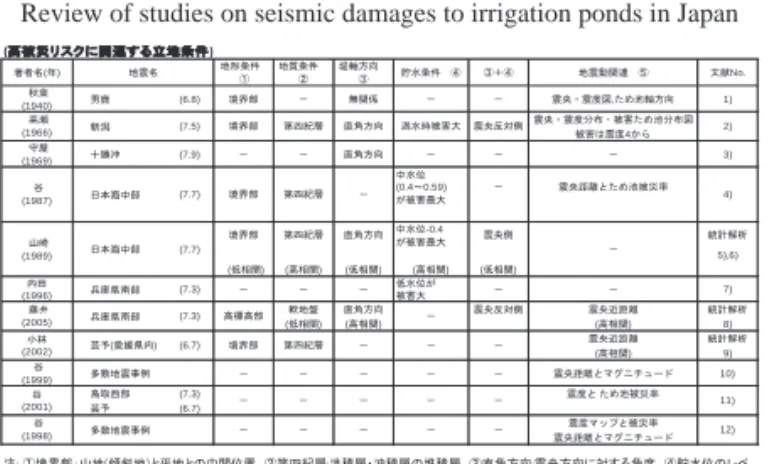
農村工学研究所技報 第216号
所 長
小 泉 健
企 画 管 理 部 長
山 本 徳 司
審 議 役
笹 山 淳 治
技術移転センター長
奥 島 修 二
農地基盤工学研究領域長
小 林 宏 康
施設工学研究領域長
毛 利 栄 征
水利工学研究領域長
中 達 雄
資源循環工学研究領域長
増 本 隆 夫
農村基盤研究領域長
小 川 茂 男
編 集 委 員 会
編 集 委 員 長
山 本 徳 司
委 員
友 正 達 美
〃
渡嘉敷 勝
〃
濵 田 康 治
〃
吉 本 周 平
〃
國 光 洋 二
事 務 局
児 玉 正 文
OF
THE NATIONAL INSTITUTE FOR RURAL ENGINEERING No. 216
KOIZUMI Takeshi Director-General
YAMAMOTO Tokuji Director, Department of Planning and General Administration SASAYAMA Junji General Administration Coordinator
OKUSHIMA Shuji Director, Technology Transfer Center
KOBAYASHI Hiroyasu Director, Agricultural Environment Engineering Research Division MOHRI Yoshiyuki Director, Facilities and Geotechnical Engineering Research Division NAKA Tatsuo Director, Hydraulic Engineering Research Division
MASUMOTO Takao Director, Renewable Resources Engineering Research Division OGAWA Shigeo Director, Rural Development and Planning Research Division
EDITORIAL BOARD
Chairman:YAMAMOTO Tokuji Members:TOMOSHO Tatsumi
TOKASHIKI Masaru HAMADA Koji YOSHIMOTO Shuhei KUNIMITSU Yoji Secretary KODAMA Masafumi
農工研技報 216 1 ~ 7, 2014
震災からの復旧過程における農業用水の 塩分濃度モニタリング
友正達美 * 谷本 岳 * 内村 求 *
*農地基盤工学研究領域用水管理担当
キーワード:地震,地盤沈下,農業用水,塩分濃度モニタリング,電気伝導度,水稲
Ⅰ 緒 言
平成23年東北地方太平洋沖地震の発生から2年を経過
し,被災農地の復旧は,被害の大きかった沿岸部や河川 沿岸が中心となりつつある。こうした沿岸部や河川沿岸 では,水門等の水利施設が津波で損壊し,さらに地盤沈 下によって,河川への塩水浸入が見られる。こうした河 川が農業用水の水源となっている場合,塩水浸入は農地 の復旧や営農再開の大きな妨げとなる。筆者らは,北上 川下流左岸の皿貝川を対象に,2012年5月から9月まで 農業用水の電気伝導度(EC)観測による塩分濃度モニ タリングを行い,ECは時間的な変動が大きいことから,
モニタリングは営農再開の時点だけでなく,継続的に行 うこと,また塩害を回避するためにリアルタイムでEC の観測値がわかる方法で行うことの必要性を明らかにし た(友正ら,2013)。
本稿では,その後継続して行っている塩分濃度モニタ
リングの2013年9月までの結果,および2013年5月から
試行している塩害回避のためのリアルタイムのモニタリ ングの結果を報告する。また,これまでの調査結果を踏 まえて,震災後の被害調査,復旧,営農再開の各段階に 応じたモニタリングの方法について検討する。
Ⅱ 塩分濃度モニタリングの対象と方法
2.1 モニタリングの対象
農業用水の塩分濃度モニタリングの対象は,北上川下 流左岸の支流,皿貝川の下流である(Fig.1)。2011年3 月11日の東日本大震災の津波により,北上川との合流 点(北上川河口より上流3.0km)にある月浜第一水門が 被災し,周辺一帯の農地は冠水した。北上川下流の地盤 は平均で約0.8m沈下した(遠藤ら,2011)。
その後,2011年6月に月浜第一水門が応急復旧,2013
年3~4月に付帯する防潮水門が復旧した。皿貝川下流
左岸の大長尾(月浜第一水門より上流2.4km),小長尾(月 浜第一水門より上流3.3km)で農業用水を取水する水田 では,2012年5月から水稲作が再開された。営農再開時 には農業用水の塩分濃度に異常がないことが確認されて
いたが,出穂後の2012年8月には農業用水が原因と見ら れる塩害が発生した(Fig.2)。
これを受けて,翌2013年の水稲作について,宮城県 では,皿貝川下流左岸の水田に代替水源として北上大堰
(北上川河口から上流17.2km)で取水した農業用水を送 水し,大長尾,小長尾における皿貝川からの取水を停止 する対策を取った。この水田は,震災以前から実施中の 土地改良事業により,北上大堰からの用水に切り替える 計画となっており,皿貝川右岸の幹線水路から大長尾,
小長尾の中間付近で左岸側に送水するサイホンが建設済 みであった。そのため,このサイホン出口に仮設の管路 を設置して大長尾,小長尾に送水することが可能であっ た。しかしながら,更に皿貝川の上流左岸の曽呂美(月 浜第一水門より4.5km)では,地形勾配からサイホンか らの送水が困難なため,皿貝川からの取水が継続された。
Fig.2 2012年に発生した水稲の塩害 Rice damaged from salt water, in 2012 Fig.1 皿貝川とモニタリング地点の位置 Location of Sarakai River and EC monitoring points
2.2 モニタリングの方法
a ECロガーによるモニタリング
大長尾,小長尾では,2012年5月より,ECセンサー と観測データを蓄積するロガーが一体となったECロ ガー(Hobo社製U-24,測定範囲0~15mS/cm,精度±3%)
による農業用水のモニタリングを行っている。ECロガー は大長尾,小長尾の取水地点に各2個ずつ,設置時(2012
年5月16日)の水面から深さ0.8m(浅部),2.0m(深部)
とし,10分間隔でECを記録した。なお,浅部のECロガー
の位置は,大長尾,小長尾でポンプに接続している取水 ホースの呑み口高さと概ね一致させている。
b ECデータ送信システムによるモニタリング 2013年に皿貝川からの取水を行う曽呂美では,塩分 濃度が上昇した場合に取水を停止する用水管理を行うこ とを意図して,新たにECデータ送信システムを導入し,
2013年5月15日よりモニタリングを開始した。
ECデータ送信システムは,ECを観測し,その値を指
定したメールアドレスにメールで送信するものである
(Fig.3)。これによって,用水管理者はECの観測値をリ
アルタイムで把握でき,それに応じた用水管理を行うこ とができる。
ECデータ送信システムはECセンサー,メール送信器,
電源から構成される。ECセンサー(東邦マーカンタイ ル社製AQUA watcher,測定範囲0.05~100mS/cm,精度
±0.5%+0.001mS/cm)は,取水するホースの先端付近(水
深約1.2m)に設置した。EC観測の時間間隔,メールの
送信間隔はそれぞれ任意に設定できるが,用水管理者と 協議して,メール受信の回数があまり多すぎず,かつ,
用水管理を行う上で実用的な頻度として,試行的に1時 間間隔,毎正時に観測しメール送信することとした。電 源は外部からの電力供給を必要としないよう,太陽光パ ネルとバッテリーを使用した。
c EC に応じた用水管理の検討
曽呂美におけるECデータ送信システムによるリアル タイムのモニタリングの結果に応じて,具体的にどのよ うな用水管理を行うかを検討した。
水田かんがい用水におけるECの基準としては,農業
(水稲)用水基準では0.3mS/cm以下となっている。ま
た,島根県が行った試験では1.5mS/cm以上でコシヒカ リ等の収量に大きな影響があった(道上ら,1998)。ま たIRRIでは2.0mS/cm以上はかんがいに適さないとして いる(IRRI,2009)。
皿貝川からの取水の場合,2012年かんがい期の塩分 濃度モニタリングの結果(友正ら,2013)から,農業 用水基準(水稲)の0.3mS/cmを基準とすると,取水可 能な日数が少なくなりすぎる怖れがあった。そのため,
塩害による減収をなるべく回避するという観点から,
1.5mS/cm以上の場合に原則として取水停止,2.0mS/cm
以上の場合に取水停止することとした。農業用水の塩分 濃度がこの基準を超えても,かんがい時に田面に湛水が あれば希釈されるため,直ちに水稲が高濃度の塩水にさ らされるわけではない。しかし,田面湛水の有無や量は 水田の水管理によって異なるため,用水管理上安全側の 措置として,これらの基準で取水を停止することとした。
また,用水管理者がメールでECが基準を超えたこと を把握してから,実際に取水を停止するまでには,施設 を操作する者への連絡,移動等に一定の時間を要し,こ の間に基準値を超える用水が水田に送水される。特に夜 間は,メールの確認遅れなどにより,対応までの時間が 長くなるおそれがある。そのため,ECが上記の1.5mS/
cmに達する以前に,用水管理者,耕作者の双方が,取 水停止に備える準備段階を設けることとした。この取水 停止に向けた準備に入る基準値は,ECの作物への影響 ではなく,用水管理の作業上の目安とする値である。こ こでは,2012年のECのモニタリング結果,および概ね 1時間程度で用水管理上の対応が可能との聞き取り結 果に基づいて,試行的に1.0mS/cmに設定した。以上の 検討に基づいて作成した,ECに応じた用水管理の案を Table 1に示す。
Ⅲ 塩分濃度モニタリングの結果
a ECロガーによるモニタリングの結果
2012年5月から2013年9月までの,大長尾,小長尾で
のECロガーによる塩分濃度モニタリングの結果をFig.4 に示す。全体的な経過としては,2012年は測定開始後 にECは2.0mS/cmを超えて大きく上昇するようになった。
翌2013年の3月から4月にかけてECは大幅に低下し,5 月以降は前年より全体的に低い水準で推移した。
ただし,2013年5月以降に,ECの上昇が全く見られ なくなったわけではない。2013年5月から9月のECの
Fig.3 ECデータ送信システム EC data-mail sending system
EC(mS/cm) 用水管理
1.0以下 (通常通りに取水)
1.0~1.5
取水停止に備える準備段階。EC上昇の速度、用水管理上の対応時間 を考慮してこの範囲を設定する。更なるEC上昇に即応できるよう、夜 間かんがいの停止、農家への注意喚起などを行う。
1.5~2.0 減収が発生する濃度。異常渇水時を除き、原則として取水を停止する。
2.0以上 塩害が発生する濃度。取水を停止する。
Table 1 ECに応じた用水管理(案)
Irrigation management plan according to EC level of water
推移をFig.5に示す。大長尾では,7月1日から2日にか けて,2.0mS/cmを超えるECの上昇が観測された。同時 期に小長尾では7月2日に1.2mS/cmの最大値を観測した。
b ECデータ送信システムによるモニタリングの結果 ECデータ送信システムを設置した曽呂美では,シス テムの運用を開始した2013年5月15日以降,9月30日 までECは最大値で0.3mS/cmと低い水準で推移した。そ の最大値を記録した,7月1日の大長尾,小長尾,曽呂 美の観測値の推移をFig.6に示す。
7月1日に大長尾では2.0mS/cmを超えるECの上昇が 観測されたているが,曽呂美では0.3mS/cmとECの変動 はほとんど見られていない。
こうした経過から,曽呂美ではTable 1のECに応じた 用水管理(案)は実施に移されることはなく,また,か んがい用水が原因と考えられるような塩害の発生も見ら れなかった。
Ⅳ 考 察
4.1 EC の変動に関係する要因とモニタリングの重要性
Fig.4に示したECの推移から,皿貝川への塩水浸入は,
2013年3月~4月の月浜第一水門に付帯する防潮水門の 復旧によって,大きく減少したと考えられる。ただし,
Fig.5に示したような一時的なECの上昇が見られること
から,塩水浸入が完全に防止されたわけではない。皿貝 川および北上川下流周辺では,河川堤防,水門等の復旧,
改修工事が現在も継続して実施されており,今後も,こ れらの進捗によって塩水浸入の起こりやすさが変化する 可能性がある。
また,皿貝川への塩水浸入の有無や程度に関連する要 因として,潮汐や降雨が考えられる。2013年のかんが い期における日最大潮位(最寄りの鮎川)の推移と,大 長尾においてECが1.0mS/cmを超えた期間をFig.7に示す。
ECが1.0mS/cmを超えた時期は,潮位上昇から5~6
日後に発生しているが,他方,5月~9月の期間中に最 も高い潮位となった7月下旬の前後にECの上昇が見ら れないなど,その対応関係は明確ではない。
かんがい期間中の最寄りのアメダス地点(雄勝)にお ける2012年,2013年,平年の旬別降水量をFig.8に示す。
2013年は7月上旬まで少雨傾向,7月中旬に大きな降
雨量が観測され,それ以降は平年に近い傾向で推移した。
Fig.7において,2013年の7月下旬の前後に,大長尾で
Fig.4 大長尾,小長尾におけるECの推移(2012年5月~2013年9月)
Trend of EC at Ohnagao and Konagao May.2012-Sep.2013
Fig.6 2013年7月1日のECの推移 Trend of EC on July 1 2013
Fig.5 大長尾,小長尾におけるECの推移
(2013年5月~9月)
Trend of EC at Ohnagao and Konagao during irrigation period
潮位が高い時期においても1.0mS/cmを超えるECの上昇 が見られなかった理由として,この大きな降雨量が影響 した可能性が考えられる。
皿貝川最下流の月浜第一水門の操作は,内外水位差に 基づいて行われており,潮位の変動の他,降雨流出によ る北上川本川,皿貝川の流量によって影響を受ける。そ のため,年ごとによって異なる降雨は,潮位と共に塩水 浸入に影響を及ぼすと考えられるが,その過程は複雑で ある。2012年は6月中旬に大きな降雨がありそれ以降は 少雨傾向であった。2013年は7月下旬以降の降雨量は概 ね平年並みであった。月浜第一水門に付帯する防潮水門 が復旧した2013年も皿貝川下流ではFig.5に示したよう な塩水浸入が観測されているが,今後,2012年のよう に夏期に少雨傾向になった場合,塩水浸入がどのように 変化するかは不明である。塩水浸入がどこまで到達する かについても,皿貝川の河床勾配が下流部で1/2,000か ら1/3,000と非常に小さく(宮城県,2003),地形的条件 から判断することは難しい。
このように,農業用水の取水河川への塩水浸入には,
周辺の水利施設の復旧の状況,潮位,降雨等の要因が影 響しており,その程度や範囲を事前に予測することは難 しいことから,実際のモニタリングに基づいて,復旧計
画の策定や,用水管理を実施することが重要と考えられ る。
4.2 ECデータ送信システムによる用水管理の有効性 ECデータ送信システムを設置した曽呂美では,前述 の通りTable 1の基準に達するようなECの上昇は観測さ れず,取水停止等の具体的な用水管理は行われなかった。
しかしながら,聞き取りでは,用水管理者はECデータ 送信システムの有効性を高く評価しており,少なくとも 2014年のかんがい期初めまでの継続的なモニタリング を希望している。曽呂美では,塩害が発生した翌年に同 じ水源から取水せざるを得なかったことから,リアルタ イムでモニタリングを行いながら取水できたことの安心 感は大きいとのことであった。
次に,もし今後,曽呂美でECの上昇があった場合,
Table 1の用水管理が行うことが可能かどうかを,Fig.6
の2013年7月1日の観測値から検討する。大長尾(浅部)
でのEC上昇は,1.0mS/cmを超えてから1.5mS/cmに達 するまで約2時間,1.5mS/cmから2.0mS/cmに達するま
で約2時間を要した。前述のように,用水管理者はメー
ルでECの上昇を知ってから,概ね1時間で対応可能で ある。そのため,EC上昇がこれ以上早くならなければ,
試行した毎正時のデータ送信の設定で,Table 1のECに 応じた用水管理は可能と考えられる。
更に,もし仮に,曽呂美より下流の大長尾,小長尾で 代替水源が確保できず,皿貝川からの取水を継続せざ るを得なかった場合,ECデータ送信システムによる用 水管理によって,水稲作が可能であったかを検討する。
Fig.5から,大長尾では,ECが7月に一時的に2.0mS/
cmを超えており,ECデータ送信システムによる用水管 理が行われていた場合,取水が完全停止となったのは 7月1~2日の2日間のみであったと考えられる。また,
小長尾では,2013年かんがい期間中のECの最大値は
1.2mS/cmであり,ECがこれ以上上昇しない間に取水す
るよう農家に注意喚起が行われた程度で,取水停止等に は至らなかったと考えられる。
以上のことから,塩水浸入の懸念がある場合,農業用 水の安全を確認しつつ取水したり,塩分濃度が上昇した 場合に取水を停止する等の用水管理を行ったりする場合 に,ECデータ送信システムによるリアルタイムのモニ タリングは有効な方法であると言える。
ただし,上記の考察はあくまで結果論であって,月浜 第一水門の防潮水門の復旧によって,皿貝川への塩水浸 入がどの程度抑止できるかは,2013年のかんがい開始 の時点では不明であった。従って,代替水源の確保が可 能な場合は,それが第一の選択肢であり,ECに応じた 用水管理は次善の対策である。
4.3 復旧段階に応じたモニタリングの方法
2012年5月からの継続的なモニタリングによって,塩
Fig.8 かんがい期の降水量(雄勝)
The precipitation at Ogatsu during irrigation period 2013 Fig.7 2013年かんがい期の日最大潮位(鮎川)と 大長尾におけるECの上昇時期
The highest tide levels in a day at Ayukawa and high EC days at Ohnagao monitoring point during irrigation period 2013
水浸入は,潮汐,降雨等の変動だけでなく,農地の復旧 と同時並行で進められている周辺の河川堤防,水門等の 復旧・改修によって影響を受け,変化していく実態を捉 えることができた。また,地震によって大きく沈下した 地盤そのものが,余効変動によって徐々に隆起する現象 が観測されており(飛田ほか,2012),今後,塩水浸入 に影響を及ぼすことも考えられる。
従って,塩分濃度モニタリングは,農地の復旧後,営 農再開の時点で安全確認のために行うだけでは不十分で あり,震災発生後の復旧の段階ごとに,必要に応じて方 法を変えながら継続して行う必要がある。
その際,モニタリングの実施には,機器の入手の難易,
時間,予算,マンパワー等,災害後の様々な制約を考慮 しなければならない。そこで,復旧段階に応じたモニタ リング方法について検討する。
Table 2に,用水管理者および著者が,調査対象の皿
貝川およびその周辺の被災地で実際に使用しているEC モニタリング機器について,経験的に感じられた特徴お よび適した使用方法を示す。
モニタリングの目的,機器の特性,制約要因等を考慮 すると,各段階に応じておおよそ以下のようなモニタリ ング方法が望ましいと考えられる。
a 調査段階
震災発生後は,取水施設本体の被害状況の把握と同時 期に,農業用水の水質,特に塩水浸入の有無と程度を把 握することがモニタリングの主な目的となる。取水地点 で塩水浸入が確認された場合は,深さ方向の濃度分布を 把握するとともに,周辺の主要な地点に計測対象を広げ,
調査時点での塩水浸入の規模と範囲を概定する必要があ る。モニタリング方法としては,準備しやすい,携帯型 EC計による,ある調査日の一斉観測が一般的であろう。
その後,塩分濃度の時間的,季節的な変動を把握する ため,継続的な塩分モニタリングを行うことが望ましい。
観測地点は,取水地点の他,主要な水路,河川との合流 点付近などを選定する。観測水深は,用水の取水深さの
他,塩水浸入を観測しやすい河床,水路床付近に設定す る。モニタリングの結果から,農業用水の水源を,塩分 濃度が常に高く使用できない水源,塩分濃度上昇が一時 的に上昇する水源,塩分濃度上昇のおそれの少ない水源,
等に区分して,復旧計画の策定に反映させることができ る。機器としては,携帯型EC計でも可能であるが,多 地点での継続的なモニタリングを行うにはマンパワーが 不足しやすい。主要な観測点にECロガーを設置すれば,
機器コストは必要であるが,モニタリングに必要なマン パワーを大幅に節約できる。
b 復旧段階
復旧計画の策定において,塩分濃度が常に高い水源は,
代替水源の確保が必要となる。塩分濃度が一時的に上昇 する水源は,代替水源を確保することが望ましいが,そ れが難しい場合,塩分濃度が高い時だけ使用を停止する 用水管理のためのモニタリング方法を検討する。その際,
取水河川の水利施設の復旧等によって,将来的に塩水浸 入の解消が期待できる場合には,本調査で導入したよう な,ECデータ送信システムを導入して,その結果を用 水管理に反映させる方法でよい。しかし,将来にわたっ て一時的な塩水浸入の解消が期待できない場合には,モ ニタリング機器を取水施設の一部に組み込んで,ECに 応じた用水管理を自動的に行うような,恒久的な施設整 備を行うことがより望ましい。
農地復旧の進捗が相対的に早く,復旧計画の策定まで に充分な塩分濃度モニタリングの期間がない場合,2012 年に皿貝川で経験したような,営農再開時に予期してい ない塩分濃度の上昇に備える必要がある。復旧工事の実 施期間中も含めて,取水周辺でECロガーや携帯型EC計 による定期的なモニタリングを行い,取水地点には安全 確認のためECデータ送信システムを設置することが望 ましい。塩水浸入が観測された場合には,対策を取り入 れた復旧計画へと変更する。
c 営農再開段階
事前に塩分濃度が一時的に上昇することが分かってお り,かつ代替水源が確保できない場合は,ECに応じた 用水管理のために,また,塩分濃度上昇のおそれの少な い水源では取水の安全確認のために,ECデータ送信シ ステムを設置する。また,周辺の復旧工事の進捗,地 盤の余効変動による隆起・沈降の影響を把握するため,
ECロガーや携帯型EC計による定点観測でモニタリング
を実施する。
数年程度モニタリングを継続し,将来的にも塩水浸入 の懸念がないと判断されればモニタリングを終了する。
なお,モニタリング終了後の機器類は,次に復旧を進め る地区に移設して使用することができる。
機器 特徴 適した使用方法
携帯型EC計
・観測値は測定時にリアルタイム でわかる。
・観測点、観測頻度が多くなると労 力を要する。
・被災直後の広域的な概 査
・特定の地点での定期的 な安全確認
ECロガー
・観測値はまとめて回収するため リアルタイムではわからない。
・観測点、観測頻度が多い場合に 労力を節約できる。
・設置数に応じてコストを要する(1 カ所8万円程度)
・復旧前後を通じた長期的 な観測
ECデータ送信 システム
・観測値はリアルタイムで遠隔地 でもわかる。
・機器、設置、通信にコストを要す る(1カ所年間100万円程度)
・営農再開後の安全確認
・流域の復旧が進捗する まで短期的な用水管理
・安全が確認されたら撤 去、他の地区に移設 ECで自動制御する
取水施設
・観測値に応じて送水の停止、再 開を自動的に行う。
・塩水侵入が長期的に続く 場合の用水管理
Table 2 ECモニタリング機器の特徴と適した使用方法 Features and typical usage of EC monitoring instruments
Ⅴ 結 言
北上川下流左岸の津波被災地を対象に,2012年5月 から農業用水の塩分濃度モニタリングを行った。また 2013年5月から新たにECデータ送信システムを導入し て用水の安全性の確認を行い,ECに応じた用水管理の 案を作成した。その結果,農業用水への塩水浸入は,河 川の水利施設の復旧の進捗により変化することが明らか になった。また,農業用水への塩水浸入の懸念がある場合,
ECデータ送信システムによる用水管理が有効であるこ とが確認された。更に,これらの結果から,震災復旧に おける調査,復旧,営農再開の各段階においての,塩分 濃度モニタリングの望ましい方法について検討した。
なお,この調査を行うにあたり,宮城県および北上川 沿岸土地改良区の関係者各位には多大なご協力をいただ いた。記して謝意を表する。
参考文献
遠藤希実,大沼克弘,天野邦彦(2011):東北地方太平洋沖地 震に伴う地盤沈下が汽水域植生に与える影響の分析,河川技
術論文集,18,53-58.
IRRI (2009): Rice Knowledge Bank, Rice Doctor, Salinity,
http://www.knowledgebank.irri.org/RiceDoctor/information-sheets- mainmenu-2730/deficiencies-and-toxicities-mainmenu-2734/
salinity-mainmenu-2753.html
道上伸宏,伊藤淳次(1998):水稲‘コシヒカリ’‘ときめき
35’の塩分耐性,近畿中国四国農業研究センター,1998年度
(平成10年度)近畿中国農業研究成果情報,生産環境推進部会,
http://www.naro.affrc.go.jp/org/warc/research_results/h10/kankyo/
cgk98074.html.
宮城県(2003):北上川(1)流域河川整備計画,2,
http://www.pref.miyagi.jp/uploaded/attachment/42691.pdf 飛田幹男,木村久夫(2012):余効変動の推移と今後の隆起・
沈降の見通しについて,地震予知連絡会会報87,535-538,
http://cais.gsi.go.jp/YOCHIREN/report/kaihou87/12_10.pdf 友正達美,坂田賢,内村求(2013):平成23年(2011年)東北
地方太平洋沖地震により地盤沈下した取水河川における農業 用水の塩分濃度モニタリングの必要性,農工研技報214,25- 30.
受理年月日:平成25年12月5日
Salt Concentration Monitoring of Irrigation Water During the Recovery Process from the Earthquake Disaster
TOMOSHO Tatsumi*, TANIMOTO Takeshi* and UCHIMURA Motomu*
*Agricultural Environment Engineering Research Division, Irrigation Management
Summary
Salt concentration of irrigation water from a river in the ground subsidence area by the 2011 off the Pa- cific coast of Tohoku Earthquake is monitored by using the electric conductivity (EC) loggers at 2 points, and an EC data-mail sending system for irrigation management at 1 point. An irrigation management plan according to EC level monitored by the EC data-mail sending system is prepared.
The EC of irrigation water became lower after the restoration of the water gate at downstream, before the 2013 irrigation period. During 2013 irrigation period, the EC level was low for the most time, but raised once over 2mS/cm at the downstream.
The result of EC monitoring suggests that the EC data-mail sending system is useful for irrigation man- agement in the area where the EC of water is not sure after resume of farming. In the disaster-struck area, salt cocentration monitoring should be continued according to the recovery process. The outline of the effective monitoring for the each recovering stage is discussed.
Keywords : earthquake, ground subsidence, irrigation water, salt concentration monitoring, electric con- ductivity, rice
農工研技報 216 9 ~ 19, 2014
Numerical Estimation of the Vertical Fecal Coliforms Distribution in Reservoirs
HAMADA Koji*, SHIRATANI Eisaku**, KUBOTA Tomijiro* and HITOMI Tadayoshi*
*Hydraulic Engineering Research Division, Water Environment
**Department of Planning and General Administration, Senior Research Coordinator Keywords: vertical one-dimensional layer model, fecal coliforms, vertical profile
Ⅰ Introduction
Fecal contamination of irrigation water is responsible for the spread of many contagious diseases (WHO, 2006), and agricultural activity can increase infection risks for farmers and consumers of crops. Fecal bacteria in human and ani- mal waste may contain some pathogenic organisms on rare occasions. Some agricultural reservoirs in Japan (particularly those in the middle reaches of river basins) receive runoff from residential areas and stock farms, and such runoff is at a risk to contaminating of fecal bacteria in irrigation water. Accordingly, understanding the dynamics of fecal bacteria in such reservoirs is critical for the prevention and management of fecal contamination of irrigation water.
Fecal coliforms (FC), which have been utilized as indicators of fecal contamination, have been shown to exhibit ver- tical fluctuations within an agricultural reservoir (Hamada et al., 2010). Vertical profiles describing FC concentration are used in the management of reservoir intake, and it is possible that differences in intake depth may result in differ- ences in risk for farmers and consumers of crops, yet the mechanisms underlying the vertical distribution of FC remain unknown. Therefore, further studies are required to improve understanding of the distribution of fecal bacteria.
Ecological modeling is one of the most effective means of investigating the ecological mechanisms at work in the water environment. Previously, ecological models incorporating the behavior of fecal bacteria have been adapted for investigation of wastewater treatment plants (e.g., Suh et al., 2009), coastal lagoons (e.g., Steets and Holden, 2003), and lakes (e.g., Canale et al., 1993). However, previous studies have targeted primarily the horizontal and temporal distribu- tions of fecal bacteria in water bodies and have neglected to consider the vertical distributions of fecal bacteria in water bodies in any great detail.
Many numerical models have been developed for the investigation of reservoirs and lakes, including one-dimension- al, vertical/horizontal two-dimensional, and three-dimensional models. All models developed previously are associat- ed with some advantages and disadvantages, although an appropriate model can usually be selected according to the specific aims of a given study. Fecal bacteria such as coliforms move through water bodies in two ways: they can be considered to be free-floating or particle-attached types (Chapra, 1997). In this context, it is important to consider the movements of such particles within reservoirs when constructing vertical profiles of fecal bacteria. Aki et al. (1981) used a vertical one-dimensional model to simulate a vertical turbidity profile in a reservoir, and vertical one-dimension- al models have been used widely for the simulation of vertical water quality profiles in reservoirs and lakes. For exam- ple, Momii and Ito (2008) used such a model for the simulation of water temperature in a reservoir in Japan. In general, vertical one-dimensional models have achieved positive results in reservoir settings, demonstrating their applicability for investigation of the mechanisms controlling the vertical distribution of FC in reservoirs.
In the present study, the vertical distribution of FC is simulated using a vertical one-dimensional layer model. In par- ticular, FC are separated into free-floating and particle-attached fractions to simulate the effects of differences on densi- ty of free-FC or flocks, particle size and sensitivity for solar radiation.
Ⅱ Model Structure
2.1 Vertical one-dimensional layer model
The present study adopts a vertical one-dimensional layer model that was designed to calculate temperature and can simulate the distribution of indicators of fecal bacteria. Figure 1 illustrates the framework of the model. The reservoir in the model is constructed from horizontally partitioned layers and the model calculates flow, heat, and mass balanc- es in each layer. Surface areas and storage volumes are calculated as functions of water depth based on rating curves.
Although the number of layers is fixed and all layers exhibit equal thickness, this thickness is not fixed, and it is deter- mined by each calculation step according to the water level the reservoir.
The basic equations adopted to describe flow, heat, and mass conservation in the model at height z are as follows.
∂
∂Av= −
t qin qout, (1)
∂
∂ =
(
−)
− ∂∂( )
+ ∂∂ ∂∂
+ ∂
∂ T
t A q T q T
A z vAT D
A z A T
z cA
in in out
T
w
1 1 1
ρ zz
( )
Aφ, (2)
∂
∂ =
(
−)
− ∂∂( )
+ ∂∂ ∂∂
+ ∂
∂
( )
C
t A q C q C
A z vAC D
A z A C
z z wC
in in out C
1 1 ++µC
. (3)
Here, v is the vertical velocity of water (m h-1), A is the horizontal water area of the reservoir (m2), and qin and qout are the inflow and discharge, respectively, of the reservoir (m3 h-1). T is water temperature in the reservoir (°C), Tin is the water temperature at the inflow (°C), DT is a heat diffusion coefficient (m2 h–1), ρw is water density (g cm-3), c is the spe- cific heat of water (4.184 kJ kg–1 degree–1), ϕ is radiation heat (J m–2 h–1), C is water quality in the reservoir (mg L-1 or MPN (100 mL)-1), Cin is water quality at the inflow (mg L-1 or MPN (100 mL)-1), DC is a water quality diffusion coeffi- cient (m2 h–1), μ is the specific reaction rate (d-1), and w is the settling velocity (m h–1).
2.2 Inflow and discharge
Inflow and discharge for each layer are calculated according to a Gaussian distribution using inflow depth and dis- charge depth as mode depths following equations as entrainment flows. Inflow depth is determined by comparing water densities between the inflowing river and each layer, assuming that water density at the inflow corresponds to that of the inflowing river. Water intake depth is determined using the actual depth of the intake from the reservoir. Accordingly,
q A z z A z z
i o i o
i o
i o i o
/ /
/
/ /
exp exp
= −
(
−)
−
(
−)
2 2
2
2δ 2δ2
⋅
∫
bottom dz Qsurface
i o/
,
(4) where qi/o is inflow/discharge (m3 h-1), zi/o is inflow/discharge height (m), Qi/o is total inflow/discharge (m3 h-1), and δi/o is the flow thickness associated with inflow/discharge (m). Equations 5 and 6 describe inflow and discharge, respectively:
qout,
qin, Tin, Cin
z
Vn, Tn, Cn Vn-1, Tn-1, Cn-1
V2, T2, C2 V1, T1, C1
V3, T3, C3
・
・
・
・
・
・
↑↓
↑↓
↑↓
↓
Evaporation Precipitation
Solar radiation
qout,z AdvectionConvection
Diffusion Settling
Fig.1 Vertical one-dimensional layer model of reservoir
δ
θ ε
in qin
G g
=
1 3 92
12
. ,
(5)
δ
θ ε
out qout
G g
=
1 3 92
13
. ,
(6)
ε ρ
= − 1 ρ
w
d w
dz , (7)
where δin and δout represent the flow thickness associated with inflow and discharge, respectively (m). Additionally, G is the Froude number for axisymmetric flow (-), θ is the aperture angle of the intake (rad), g is gravity acceleration (m s-2), and ε is the density gradient (m-1). The horizontal speed of water at height z, u (m h-1), is calculated using the values of qin(z) and qout(z) determined by equation 4:
u q q s A
in out
= +
3600 , (8)
where s is the thickness of the layer under consideration (m).
2.3 Diffusion coefficient
The diffusion coefficient is computed according to the Munk−Anderson formula (Munk and Anderson, 1948):
D D
T C R
i
= =
+ 10
1 10 , (9)
where Ri is the gradient Richardson number and is defined as R g
z u
i z
w
= − ∂ w
∂
∂
∂
ρ
ρ 2
.
(10) ρw is approximated using the following equation, which is based on Lemmon (2011).
ρw=4 3298333 10. × −5 3T −8 1864490 10. × −3T2+6 2139784 10. × −2T+9 998. 44914 10× 2 . (11)
2.4 Mixing process
The specific water density for each layer is calculated according to equation 11. If the specific water density gradient between layers becomes positive (i.e., ∂ρw ∂ >z 0 ), two neighboring layers are mixed. If the specific water density gra- dient fails to stabilize after the mixing of the two layers, mixing is repeated with the increasing of number of mixing layers until the specific water density gradient becomes stabilized.
2.5 Settling velocity
As for particles, flows are calculated according to the characteristic curve method. The settling velocities of particles are calculated according to Stocks’ law, as follows:
w Dp p w g
= 2
(
−)
18
ρ ρ
η ,
(12) where Dp is particle diameter (m), ρp is particle density (g cm-3), and η is water viscosity (Pa s).
2.6 Ecological model of fecal coliforms (FC) as an indicator of fecal contamination
Both FC and total coliforms (TC) are used as indicators of fecal bacteria, although FC are typically associated with higher cultivation temperatures. Nevertheless, biological reactions involving FC are assumed to be controlled by similar mechanisms to those involving TC. In natural water bodies such as rivers and lakes, it has been shown that the reactivi-
ty of TC (and thus of FC) is limited only by their loss rates (Chapra, 1997), which can be described as follows.
∂
∂C= = − t µC k Cb
, (13)
where C represents FC concentration (in MPN (100 mL)-1) and kb is the total loss rate (d-1).
In the present study, the total FC loss rate is assumed to be the same as that of TC, which has been described previ- ously (Mancini, 1978; Thomann and Mueller, 1987; Chapra, 1997):
k
m z z e
b
T s
sur
m zsur z
= × +
−
(
−)
− − −
0 8 1 07
0 55 1
20 0 55
. . '
. ( )
. ( )
αφ
, (14)
where α is a proportionality constant (-), ϕs’ is surface light energy (ly h-1), m is suspended solids concentration (mg L-1), and Zsur is the height of the water surface (m). The first term on the right-hand side of equation 14 represents the base mortality rate, whereas the second term represents the rate of loss due to solar radiation (i.e., UV disinfection).
This latter term is described by the Beer–Lambert law, using the relationship between extinction and suspended solids presented by Di Toro et al. (1981).
In the model, FC are divided into two types: a free-floating type (F-FC), and a particle-attached type (P-FC). Loss rates of F-FC due to solar radiation are represented by the second term in equation 13. Similarly, loss rates of P-FC due to solar radiation are typically based loosely on equation 13, although these rates are generally reduced owing to the interception of light before it reaches the particles under consideration. In the present study, the model incorporates a reduction factor (0.5) based on the assumption that particles are ball-shaped and that P-FC are attached uniformly to the surfaces of particles.
2.7 Solar radiation heat
At the water surface, heat loss occurs through evaporation, conduction, and reverse radiation. The net heat loss at the surface, ϕL, is defined as
φL=φe+φ φc+ ra , (15) where ϕe, ϕc, and ϕra are heat loss by evaporation, conduction, and reverse radiation, respectively. All heat loss values are given in kcal m–2 h–1.
The empirical equations adopted for the calculation of heat losses correspond to those of Rohwer and Swinbank (Tsanis et al., 2007):
φe φc W ρw ew R ea a b L c
+ =
(
× + ×)
−
+
− −
1 710965 10 1 027689 10
100
5 5
. . TT T T
e R e
a
w a a
+
(
−)
−
269 1
100 .
,
(16)
φra=0 97. k
(
T+273 15.)
4−0 937 10. × −5(
Ta+273 15.)
6(
1 0 0 17. + . n)
, (17)
where W is wind speed (m s-1), Ta is air temperature (°C), ew is saturated vapor pressure at T (hPa), ea is saturated vapor pressure at Ta (hPa), Ra is relative humidity (%), Lb is the difference in enthalpy between the vapor and liquid states (kcal kg-1), k is the Stefan–Boltzmann constant (4.87654 × 10⁻⁸ kcal m–2 h–1), and n is cloudage (-).
The difference in enthalpy between the vapor and liquid states (Lemmon, 2011) is approximated by the following equation:
Lb =597 7383 0 5671. − . T . (18)
Heat produced by solar radiation penetrates into the lake water and decays according to the Beer–Lambert law:
φ = −
(
1 αr) (
1−β φ)
sexp−λ(
zs−z)
, (19) where ϕs is solar radiation at the water surface zs (kcal m–2 h–1), αr is reflectance at the water surface (≈ 0.06), β is ab-sorbance at the water surface (≈ 0.5), and λ is a decay coefficient (m–1).
2.8 Water–sediment interactions
Particles settling to the bottom of the water body are assumed to become part of the sediment and precipitated sus- pended solids are not allowed to disturb the water body. No dilution is incorporated into the model.
2.9 Boundary conditions
River inflow volume data are generated from daily observation data. FC and suspended solids (SS) concentrations of inflowing water are described by L–Q equations, as follows:
L aQ= b , (20)
where L is the load of water quality constituents (g d-1 or ×104 MPN d-1), Q is the inflow (m3 s-1), and a and b are con- stants.
In the model, the percentage of FC represented by F-FC and P-FC depends on SS concentration (Chapra, 1997):
FC FC= F+FCp , (21)
FC
K mFC
F
d
= + 1
1 , (22)
FC K m K mFC
p d
d
=1+ , (23)
where FCF and FCp represent F-FC concentration and P-FC concentrations, respectively (in MPN (100 mL)-1), and Kd is a partition coefficient (m3 g-1).
Annual fluctuations of river inflow, reservoir effluent, and weather conditions are given as boundary conditions. All input data for calculation step pitch are generated from existing data by linear interpolation. Boundary conditions on the surface of the sediment and the surface of the water body are assumed to be equal to the bottom and top layers, respec- tively. The discharge volume of the reservoir is calculated from the relationship between observed inflow volume, evap- oration from the reservoir surface, precipitation, and fluctuation of reservoir water depth. Air temperature, rain, wind speed, relative humidity, and cloud coverage are referred to the Automated Meteorological Data Acquisition System (AMeDAS) of Japan. Solar radiation is referred to the solar radiation database of the New Energy and Industrial Tech- nology Development Organization (NEDO) of Japan.
2.10 Study reservoir
2.10.1 Overview
The studied reservoir was constructed at the meeting point of two rivers, was filled from late 2002 onward, and has been formally operational since April 2003. The reservoir has a dam body with a height of 63.7 m and has surface area, total storage volume, active storage volume, and catchment area of 910,000 m2, 11,300,000 m3, 8,600,000 m3, and 75.7 km2, respectively. Water depth at full water level is 59.1 m. Water intake is always taken at 1 m depth near the dam body. Many breeding livestock can be found in the catchment area.
2.10.2 Water sampling and water quality measurements
Monthly observations were conducted at the deepest point of the reservoir, near the dam, and at the two river in- flows in 2004. Water samplings were conducted in the morning (10:00–12:00). Sample water was collected at three depths within the reservoir: at the surface (0.5 m depth), from a middle layer (i.e., halfway between the surface and the bottom), and from a bottom layer (1 m above the bottom). Water temperature was measured with a temperature gauge linked long cable. Sample water was collected using a Van Dorn water sampler (VR Type 5042-A, RIGO Co., Ltd), and FC concentration was measured according to the most probable number (MPN) method using EC medium (JWWA, 2011); the minimum probable number was 1.8.
2.11 Simulation conditions
In the model simulations, the L–Q equations (L aQ= b) describing the water quality of the inflow were solved using summing the inflow rate of the two rivers, and water temperature was calculated to be the flow-weighted mean of the two rivers. Coefficients for the L–Q equations are presented in Table 1. Water intake depth from the reservoir was set to remain at 0.3 m, and all of the effluents were constrained to flow out from that depth.
Coefficient values are presented in Table 1. Dp and ρp were assumed heuristically to be 1 × 10⁻⁶ m (i.e., 10 μm) and 1.2 g cm-3 for F-FC and 3 × 10⁻⁵ m (300 μm) and 2.6 g cm-3 for SS, respectively. Based on the assumption that P-FC attach primarily to SS, Dp and ρp of P-FC were set equal to those of SS.
Input data for each step, qin, qout, Tin, Cin, and weather conditions were calculated by linear interpolation from the clos- est before and after data. Calculation was repeated three times continuously using the same annual data set, and a cal- culation result from the third year was adopted as the simulation result. The outflow from the reservoir (qout) was calcu- lated by a balance of observed values of inflows, reservoir water depths, precipitation, and estimated evaporation. Then, qout was multiplied by 0.5656 from day 306 to day 366 (i.e., from November 1 to December 31) in each calculation year to match the water depths on day 366 (December 31) and on day 1 (January 1) of the next calculation year. Therefore, the verification timescale of the simulation ran from January 1 to October 31.
Ⅲ Results and Discussion
3.1 Observed FC concentrations in the reservoir
Table 2 presents the observed FC concentrations in the reservoir and demonstrates that almost all values were less than 1.8 MPN (100 mL)-1, which represents the lower detection limit of the measurement method. FC concentrations in the surface layer were very low. Similarly, FC concentrations in the middle and bottom layers were almost always very low, although higher concentrations (200–300 MPN (100 mL)-1) were observed occasionally.
3.2 Annual simulation results for water quality
General remarks regarding the simulation results are first mentioned in this section; then, comparisons between the simulation results and observed values (shown in Table 1) are discussed in the next section. Figure 2 illustrates the simulation results for water depth, water temperature (Fig.2a), FC concentration (Fig.2b), and SS concentration (Fig.2c).
The horizontal and vertical axes denote time (in days) after January 1 and the water depth of the reservoir, respectively.
The plots show FC and SS concentrations of 0–200 MPN (100 mL)-1 (Fig.2b) and 0–10 mg L-1 (Fig.2c), respectively, although only a few points exhibited very high values. Figure 2 shows that the thermocline formed in late April and persisted until late November (Fig.2a), with a seasonal thermocline formed at approximately 10–15 m depth in summer.
The deep layers maintained a constant temperature of approximately 4°C throughout the year, except during a period of
Table 1 Coefficient values
Coefficient value
SS FC F-FC P-FC
a coefficient for L-Q equation - 1.484 517.73 b coefficient for L-Q equation - 2.370 0.622
kd partition coefficient (m3 g-1) 0.06
α proportionality constant (-) 0.4 0.4
n reduction factor (-) 0.5
Dp particle diameter (×10-6m) 30 1 30*
ρ particle density (g cm-3) 2.6 1.2 2.6*
*P-FC = SS, assuming P-FC attach primarily to SS surface
mixing that lasted from late November to early December. This phenomenon is common in reservoirs of this type.
FCs were introduced into the reservoir only through the influent, with no additional growth within the reservoir in the simulation. Accordingly, FC concentrations were generally low and increased in response to increased influent flow (Fig.2b). In the layers near the surface, FC concentrations were almost zero for the majority of the time, likely owing to
Table 2 Observed FC concentrations in the reservoir (2004)
surface middle bottom Apr. 23 <1.8 <1.8 <1.8 May 11 <1.8 11.0 <1.8 Jun. 9 <1.8 <1.8 <1.8 Jul. 21 <1.8 220.0 <1.8 Aug. 4 <1.8 2.0 <1.8 Aug. 18 <1.8 <1.8 9.0 Sep. 10 <1.8 <1.8 <1.8 Sep. 29 <1.8 <1.8 2.0 Oct. 20 2.0 <1.8 270.0 fecal coliforms (FC, MPN (100 mL)-1)
(a) Water temperature (deg-C)
(b) Fecal coliforms (FC, MPN (100 mL)-1)
(c) Suspended solids (SS, mg L-1)
Height from bottom (m) Height from bottom (m) Height from bottom (m)
Fig.2 Simulated annual water quality fluctuation
FC loss due to solar radiation (UV disinfection). These results agree with the observed values (Table 1). The FC frac- tion attached to particles (P-FC) settled along with SS immediately (i.e., within a few days) after being introduced into the reservoir (Fig.2c). Thus, the transport of P-FC to depth within the reservoir was more pronounced than that of F-FC.
Moreover, the UV disinfection rate of P-FC is half that of F-FC owing to particle shading. Accordingly, despite the dominance of P-FC in the reservoir as a whole, the settling of P-FC occurred in contrast to the concentration of F-FC in the upper parts of the reservoir. In particular, the majority of F-FC became concentrated between the first and seasonal thermoclines, in a layer approximately 5–20 m below the surface, during the summer irrigation season. Overall, FC concentrations tended to be higher below the depth of the daily thermocline, particularly after large inflows.
3.3 Comparison between observed and simulated vertical water quality profiles
Simulation results were verified based on their conformance with observed values on July 21 (day 203 in the simu- lation) and October 20 (day 296), when the maximum FC concentrations were observed (Table 1). Figure 3 presents comparisons between the observed (circles) and simulated (lines, 12:00) values for temperature on July 21 (Fig.3a), FC concentration on July 21 (Fig.3b), temperature on October 20 (Fig.3c), and FC concentration on October 20 (Fig.3d).
Water quality indicators and the water depth of the reservoir are shown on the horizontal and vertical axes, respectively.
Water depth was 55.8 m and 56.2 m on July 21 and October 20, respectively. FC values below the limit of detection (<1.8 MPN (100 mL)-1) are plotted as 1.8 MPN (100 mL)-1.
For the other observation day of shown in Table 2 the simulation results for FC concentrations in the bottom, middle, and surface layers are all lower than 0.21 MPN (100 mL)-1, except for September 29, and there are similar to observed values. The simulation result for September 29 appears to have been overestimated: it was approximately 500 MPN (100mL)-1 around the middle layer. This discrepancy can be attributed to the overestimation of FCs and SS for inflows (calculated according to the L–Q equations) when the reservoir received very large inflows (see the surface elevation in late September; Fig.2).
(a) Temperature, July 21 (b) Fecal coliforms (FC), July 21
(c) Temperature, October 20 (d) Fecal coliforms (FC), October 20 0
10 20 30 40 50 60
0 10 20 30
Temperature (deg-C)
Jul. 21
0 10 20 30 40 50 60
1 10 100
FC concentration (MPN (100 mL)-1)
Jul. 21
0 10 20 30 40 50 60
0 10 20 30
Temperature (deg-C)
Oct. 20
0 10 20 30 40 50 60
1 10 100
FC concentration (MPN (100 mL)-1)
Oct.20
Height from bottom (m) Height from bottom (m) Height from bottom (m) Height from bottom (m)
Fig.3 Comparison of simulated and observed vertical profiles of water quality in the reservoir for different days