Effect of Planting Hole on Soil Temperature beneath Film Mulch
Teerasak PONGSA-ANUTIN, Haruo SUZUKI, Toshiyuki MATSUI and Nobuyuki OKUDAAbstract
The purpose of this paper is to clarify the relationship between planting hole on film mulch and soil temperature in radish cultivation. The experiment was conducted in a field at the Faculty of Agriculture, Kagawa University, from April 1 to June 27 in 2006.
In plant plots with planting holes, no obvious correlation was observed between planting hole size and the amount of net radiation, nor between planting hole size and albedo. The amount of heat exchange of the air above planting holes was largest when the planting hole diameter was 10 cm, irrespective of whether there was plant. No correlation was observed between the ratio of daily range of soil temperature at 10 cm depth and the planting hole diameter. The smallest daily range of soil temperature was observed when the planting hole diameter was 10 cm. Meteorological factors that affect the ratio of daily range of soil temperature varied depending on whether there was plant and the planting hole diameter.
Key words:Mulch, Planting hole, Radish, Soil temperature.
1.Introduction
Film mulches are widely used in fields, tunnels, and green-houses, greatly increasing crop yields(1)
. Since using mulch-es appropriately to increase crop yields is important, their ef-fects should be examined closely.
Film mulches have many holes, where plants are planted. The number and diameter of such planting holes, and the dis-tance between them, i.e. between plants and between rows, vary depending on crops. Since air is exchanged between the soil surface and atmosphere through the holes, the holes should greatly influence soil temperature. In warm periods, heated air sometimes blows out from the soil surface through planting holes, directly damaging crops, but little is known about how these holes affect soil temperature. Very limited research examines the relationship between hole diameter and effect on soil temperature(2). According to the research, soil
temperature changes beneath mulches with planting holes are greatly influenced by the solar radiation. The relationship between planting hole size and ratio of daily range of soil temperature varies depending on seasons. The experiments in the research, however, were conducted without vegetation. The relationship between planting holes and soil temperature under actual cultivation is not yet known.
This experiment was conducted, using Japanese radish as
the test crop, to clarify how the planting hole diameter effects soil temperature under actual cultivation of Japanese radish.
2.Experimental plots and measurement
2.1 Experimental plots
The experiment was conducted in a field at the Faculty of Agriculture, Kagawa University from April 1 to June 27 in 2006.
Four ridges were made in a field stretching from east to west and each ridge was 14.0 m long, 1.0 m wide, and 20 cm high. Each ridge was divided into two, one with plant and one without. Each divided ridge was further divided into plots depending on the size of the planting holes in film mulches. Thirteen experimental plots were established in total. In ad-dition, no mulch plot without plant was also established as a control plot. Black polyethylene film was used as the mulch material, and Japanese radish was used as the test crop. Table 1 shows how each experimental plot was treated.
2.2 Measurement
During the experimental periods, solar radiation, albedo, heat balance, soil temperature, and soil moisture were mea-sured. Solarimeters (Iio, S-SR2) and albedometers (Eiko, MR-21) measured the solar radiation and albedo. The net
radiation in the heat balance was measured using net radiation meters (Eiko, CN-40) placed in the center of each experimen-tal plot at 50 cm above the ground. Soil heat flux was mea-sured using heat flux plates (Eiko, CN-8), which were laid below the soil surface, covered with about 2 mm of soil, in the center of each experimental plot. Sensible and latent heat flux-es were not separated. The total of the sensible and latent heat fluxes was calculated as the remainder in the heat balance. Soil temperature sensors were made using type-T thermo-couples. In each plot, ten sensors were laid underground at 10 cm depth at intervals of 30 cm in the direction of the ridges. The soil temperature at 10 cm depth is used as the representa-tive soil temperature in experiments on mulches(3). These
measured values were recorded twice a day at 6:00 and 15:00. For soil moisture, soil moisture tension was measured, us-ing tensiometers (Daiki, DIK-8343) laid underground at 10 cm depth. Although tensiometers and soil temperature sen-sors were both laid at the same depth, they were kept at least 10 cm away from each other. The tension was measured at 6:00 and 15:00. Soil water content was also measured. Ap-proximately 15 g of soil was taken from two places per plot, at 10 cm depth. Water content was determined using the oven-drying method.
As for other meteorological factors, data observed at the observation field adjoining the experimental field was used.
3.Results and discussions
3.1 Radiation in each plot 3.1.1 Albedo
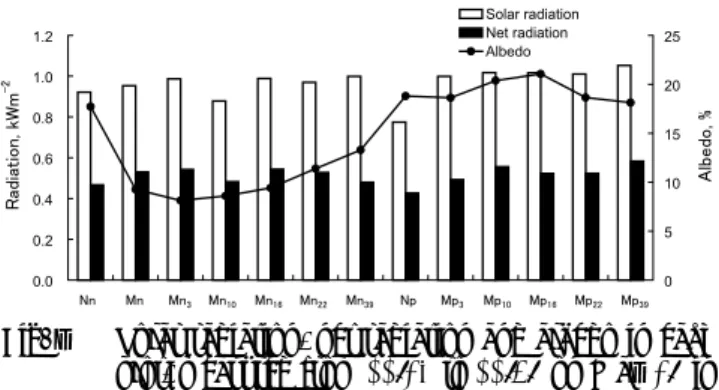
Fig. 1 shows the changes in the albedo and net radiation in each plot. According to Fig. 1, changes in the solar radiation during the experimental period were relatively stable, staying within the range of 0.88 to 1.05 kWm−2
, except in Np. Net radiation was low in Nn and Np, 0.47 and 0.43 kWm−2
, but high in other mulch plots because black film mulch have low albedo.
Under no plant conditions, albedo in Nn was 17.7%, but albedo was much lower, 9.3%, in Mn, where the planting hole diameter was 0 cm. As the planting hole diameter becomes larger, from 3 cm to 39 cm, albedo increased up to 13.3%. The larger the planting hole diameter, the higher the albedo. Such a tendency, however, was not observed in plots with plant. No definite correlation was observed between net ra-diation and albedo and between planting hole diameter and albedo.
3.1.2 Heat balance
Table 2 shows the heat balance between two plots (Nn, Table 1 Experimental details
Plot1) Diameter, 2) cm Mulching 3) coverage ratio, % Space of 4) planting hole, cm No plant Nn − 0 − Mn − 100 − Mn3 3 99.5 50a x 25b Mn10 10 96.1 50 x 25 Mn16 16 84.5 50 x 25 Mn22 22 70.6 50 x 25 Mn39 39 53.9 50 x 50 Plant Np − 0 50 x 25 Mp3 3 99.5 50 x 25 Mp10 10 96.1 50 x 25 Mp16 16 84.5 50 x 25 Mp22 22 70.6 50 x 25 Mp39 39 53.9 50 x 50
1)Plot symbol. N: No mulch, M: Mulch, n: No plant, p: Plant. 2)Diameter of planting hole.
3)Ratio of mulching coverage to row soil surface. 4)a: Interrow space, b: Intrarow spacing.
Fig. 1 Solar radiation, net radiation and albedo in each plot, measured from 11:23 to 11:49 on May 29 in 2006.
Table 2 Daily amounts of heat balance components from April 21 at 18:00 to April 22 at 18:00 in 2006 (MJm−2 day−1) No mulch(Nn) Mulch(Mn) Rn B L+V Rn B L+V + 20.4 3.3 17.1 29.5 3.2 26.3 − 6.1 2.0 4.1 11.2 2.6 8.6 Σ 14.4 1.4 13.0 18.4 0.6 17.7 % 100.0 9.5 90.5 100.0 3.5 96.5
Rn:Net radiation, B:Soil heat flux, L: Sensible heat flux, V:Latent heat flux, Σ:Daily total of each component
Mn) during the experimental period. According to Table 2, the net radiation was approximately 45% higher in Mn than in Nn during the daytime (positive values). Net radiation in Mn was even higher, increased by 84%, during the nighttime (negative values). The amount of net radiation increased by approximately 28% throughout the day. There was not a large difference in soil heat flux between the two plots during both daytime and nighttime. Daily heat balance in Mn, however, was less than half of that in Nn. Generally, covering with black mulch increases heat flux during the daytime(4)
. This experiment had a layer of air between the film and soil sur-face, resulting in a lower amount of heat flux beneath mulches. The sensible and latent heat fluxes, which are the remainder in the heat balance, were higher in mulch plots throughout the day. Tarara and Ham(5) observed the same tendency in an
experiment too. Black film mulch with planting holes clearly increase the amount of net radiation and sensible and latent heat fluxes.
3.2 Air temperature around planting holes
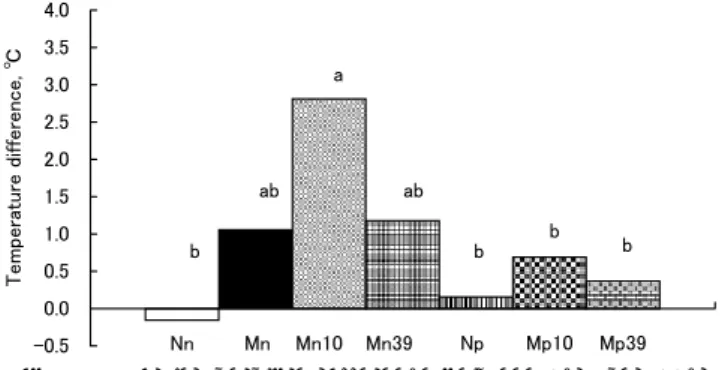
Air is exchanged through planting holes on film mulches, transferring heat, particularly during the daytime. The amount of heat transferred should vary depending on planting hole diameter. Air temperature was measured at 1 cm and 11 cm above planting holes at 15:00. Fig. 2 shows the period aver-ages of the temperature differences.
Fig. 2 shows that, under no plant conditions (Nn, Mn, Mn10, Mn39), the maximum temperature difference was
ob-served in Mn10 (period average: 2.8℃). Under plant
condi-tions, temperature differences were clearly suppressed by the plant. The maximum temperature difference, however, was observed in Mp10. This data clearly demonstrated that the heat
discharge from planting holes was the greatest at 10 cm above
planting holes, regardless of whether there is plant or not. 3.3 Soil temperature under planting holes
3.3.1 Period average of soil temperature
As above (3.2), air temperature varied between the two dif-ferent heights. This indicates that heat is exchanged between areas within planting holes of film mulches and the atmo-sphere above the holes. Particularly during the daytime, black film becomes hot from solar radiation. The heat is transferred to the soil surface immediately beneath the film, increasing the soil temperature. Under usual conditions, however, there is a thin layer of air between the film and soil surface. Therefore, the air layer also becomes hot. This hot air dissipates from the planting holes, suppressing the increase of soil temperature. Fig. 3 shows the daily maximum, minimum, average, and range of the average soil temperature of the ten points during the experimental period. Soil temperature measured at 15:00 was considered as the daily maximum soil temperature, and soil temperature measured at 6:00 was considered as the daily minimum soil temperature(6).
According to Fig. 3, under no plant conditions (Fig. 3 a), the maximum average soil temperature of the ten points was higher in mulch plots than in the no mulch plot (Nn). The highest soil temperature was observed in Mn3, followed
by Mn. The differences between plots from Mn10 to Mn39 were
small. Minimum and average soil temperature also showed the same tendency as the maximum soil temperature. The daily range of soil temperature showed no significant differences between plots, except Mn10. The small daily range observed in
Mn10 corresponded to the largest difference in the air
tempera-ture above the film (Fig. 2) being observed in Mn10.
Under plant conditions (Fig. 3b), the maximum soil temperature was observed in Mp3, where the planting hole
diameter was small. From Mp10 to Mp39, however, significant
differences were not observed. Minimum and average soil temperature also showed the same tendency as the maximum soil temperature. The daily range of soil temperature was small in Mp10, as in the no plant plots.
Under no plant conditions (Fig. 3c), the maximum soil temperature of the ten points in Nn and Mn, where there were no planting holes, showed similar standard deviation. Devia-tion was 0.6℃ in both Nn and Mn while deviaDevia-tion was larger in plots with planting holes, except Mn39. Deviation was
par-ticularly large, 0.8℃, in Mn16 and Mn22. The deviation of
mini-mum soil temperature was approximately 0.3 ℃ in all plots. In Mn3, however, it was 0.5℃. The deviation of average soil
Fig. 2 Air temperature difference between 1cm and 11cm height, at 15:00 from April 1 to June 27 in 2006. The values within the graph followed by the same letter are not significantly different according the Tukey (P = 0.05).
temperature showed a similar tendency as the maximum soil temperature. Daily range, however, was the smallest in Mn3,
unlike the average soil temperature of the ten points.
Under plant conditions (Fig. 3d), comparison with plots with plant indicated that deviation of the maximum soil tem-perature was larger in plots with planting holes than plots without planting holes (Np). The deviation of minimum and average soil temperature also showed a similar tendency as that of maximum soil temperature. The deviation of daily range was the smallest in Mp10, unlike in the plots without
plant.
As for the differences in the soil temperature deviation, we need to consider errors in measuring soil temperature. Since thermocouples were used to measure soil temperature in this experiment, errors pertaining to thermocouples, including er-rors resulting from thermocouple materials and erer-rors of stan-dard contact point, were inevitable. Also, loggers may cause some errors. These errors, however, should be very small. We can assume that the deviation shown in this experiment indi-cated direct changes in the soil and weather and the treatment of the soil surfaces.
When soil moisture is high, soil heat capacity is large and the deviation becomes small. In this experiment, the daily variation of soil moisture was large, depending on the pres-ence of mulches and plant(7)
. The soil water content of the ridges also varied between measurement points(8)
. The soil moisture influenced the daily variation of soil temperature
de-viation, as well as soil temperature changes(9). It is assumed
that these differences in the soil factors affected each soil tem-perature.
As above, mulches increased the average soil temperature of the ten points in each plot while plant suppressed the perature increase. Daily ranges of both the average soil tem-perature of the ten points and their deviation were the smallest in plots with planting holes of 10 cm diameter.
3.3.2 Frequency distribution of the soil temperature differences
When comparing soil temperature, the simplest compari-son is between two plots. In this experiment, soil temperature was measured at ten points in each plot. Therefore, 10 x 10 = 100 patterns of soil temperature differences in total were obtained between each pair of plots to gain the distribution of soil temperature differences. The characteristics of the dis-tribution patterns were shown here by the most frequent soil temperature differences. Fig. 4 shows the most frequent soil temperature differences in mulch plots with plant and without planting holes, and no mulch plots without plant (Nn). At 6:00, the most frequent soil temperature difference ob-served in the no mulch plot was 0.5℃. In mulch plots with planting holes, however, the most frequent soil temperature differences were larger, from 1.6℃ with 39 cm diameter holes to 2.7℃ with 3 cm diameter holes. The smaller the planting holes, the larger the most frequent soil temperature differ-Fig. 3 Variations of mean soil temperatures for 10 points and their standard deviations in each plots from
ences.
At 15:00, the most frequent soil temperature difference in the no mulch plot decreased to −1.8℃. Unlike at 6:00, no specific tendency resulting from planting hole diameter was observed. The soil temperature differences were within the range of −0.7 to +0.5℃ . In general, the most frequent soil temperature differences became smaller at 15:00 than 6:00 under mulch covered conditions.
3.3.3 Vertical relationships of the soil temperature be-tween two plots
Determining the vertical relationships of soil temperature between two plots when more than one sensor was used is rel-atively easy(8)
. In this experiment, we used ten sensors per experimental plot. As in the previous experiment(6)
, we used the t-test to determine vertical relationships. For the sake of simplicity, if any significance was observed in the t-value, the vertical relationship was determined with the average values of the sensors. If no significance was observed, we assumed that there was no vertical difference.
Fig. 5 shows that, at 6:00, the temperature was higher in mulch plots with planting holes, irrespective of whether there was plant, than in the no mulch plot without plant (Nn) throughout the experimental period. However, the temperature was higher than or almost the same as the no mulch plot (Nn) in approximately 2% of plots with planting holes of 16 cm diameter or larger under no plant conditions, and in approxi-mately 5% of plots with planting holes of 10 cm diameter or larger under plant conditions. However, the percentages were
very small.
At 15:00, under no plant conditions, the temperature was lower in no mulch plots than mulch plots, mulch (Mn, Mn3)>
no mulch (Nn) in all plots with planting holes of less than 10
cm diameter. In plots with planting holes of 10 cm diameter or larger, mulch ≒ no mulch or mulch < no mulch relationships were observed in approximately 25% of all plots.
Under plant conditions, in Mp3, where the planting hole
di-ameter is 3cm, the mulch > no mulch relationship accounted for 75 % , and other relationships 25%. In plots with plant-ing holes of 10 cm diameter or larger, the mulch > no mulch relationship was reduced to 35 to 48%, and the mulch < no
mulch relationship increased. It was observed that the larger
the planting holes, the more often the mulch > no mulch rela-tionship occurred.
As above, at 6:00, the temperature was significantly higher in all mulched plots, irrespective of whether there was plant, than in no mulch plots. At 15:00, however, significantly higher temperature was not observed, and the planting hole diameter affected the vertical relationships.
3.3.4 Ratio of daily range of soil temperature
In addition to the maximum, minimum, and average soil temperature discussed above, soil temperature effect by mulch can also be described with the daily range of soil temperature. Dimensionless values was calculated by dividing the daily range of soil temperature in each plot with planting holes by Fig. 4 Maximum frequency distribution of the soil
tem-perature difference at 10 cm depth in each plot to that of plot Nn (control) from April 1 to June 27 in 2006. The values within the graph followed by the same letter are not significantly different according
the Tukey (P = 0.05). Fig. 5 Frequency of order relation of soil temperature dif-ference at 10 cm depth in each plot to that of plot Nn (control) from April 1 to June 27 in 2006.
the daily range of the no mulch plot (Nn). Fig. 6 shows the period averages of the daily range.
According to Fig. 6, under no plant conditions, the highest ratio was not observed in the plot without planting holes, Mn/ Nn. The Mn3/Nn ratio was 1.06, which was 6% higher than
Mn/Nn (1.00).
A reason for this is as follows: When black mulch film receives solar radiation heat, it transfers the heat to the soil surface, making soil hot. As there is a thin layer of air under the film, however, the air also becomes hot. If the film has holes, the hot air dissipates from the holes, lowering the soil temperature under the film under certain conditions. But, the soil surface inside planting holes directly receives solar radia-tion, becoming hot. Mulches may increase or decrease the soil temperature under the film, depending on the size of planting holes. In this experiment, black mulches with 3 cm diameter holes increased the soil temperature.
Under no plant conditions, ratio of the daily range was the lowest in Mn10 (0.66). Mn16 and Mn22 had similar ratios. In
Mn39, the ratio was 0.91. The low ratio of daily range in this
particular size of planting holes was also known from the pre-vious experiment(2).
Concerning the low ratio of daily range of the 10 cm di-ameter planting holes, the lowest ratio of the period averages in both plots with and without plant was observed in the plot with 10 cm planting holes. The range becomes small when the maximum or minimum soil temperature is a little low.
The average ratio of daily range in all plots was 0.51. The average ratio in plots with plant was 42% lower than that of plots without plant. The same tendency was observed in the plots without plant, although the differences between plots were smaller.
In order to determine the relationships between the ratio of
daily range of soil temperature and meteorological conditions, a multiple linear regression analysis was conducted, using the ratio of daily range as criterion variables and meteorological conditions as explanatory variables. The explanatory valu-ables include seven factors in total: four representative factors for daily average of air temperature, daily amount of precipi-tation, daily amount of solar radiation, and daily average of wind speed, and two other factors including soil moisture and plant height. The coefficient of each variable was given as a standard regression coefficient in the analysis results.
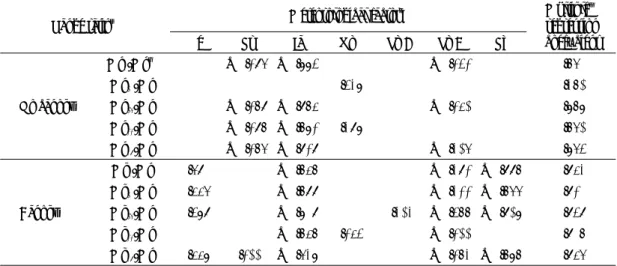
According to Table 3, under no plant conditions, the vari-ables of the amount of precipitation, amount of solar radiation, and soil moisture were commonly selected in all plots, except the plots with planting holes 10 cm in diameter. In Mn10, only
the wind speed was selected. While the multiple correlation coefficients in other plots were within the range of 0.761 to 0.878, that in Mn10 was 0.371, less than half of other plots. In
the plots without plant, ratio of daily range of soil temperature in Mn10 showed a clearly different relationship to
meteorologi-cal factors.
Under plant conditions, the lowest multiple regression co-efficient was observed in Mp22, where different factors than
other plots were selected. When the planting hole diameter on film mulches changes, meteorological factors that affect the ratio of daily range of soil temperature in the plot also change.
4.Conclusion
The experiment found no obvious correlation between planting hole diameter and albedo, nor between planting hole diameter and the net radiation. As air temperature clearly var-ied between the two different heights above planting holes, heat exchange through planting holes was significant. Heat exchange was the largest through 10 cm diameter holes. No linear correlation was observed between soil tempera-ture and planting hole diameter. As for the period average of soil temperature at 10 cm depth, the smallest daily range was observed in plots with planting holes of 10 cm diameter, irre-spective of whether there was plant. As for the distribution of the soil temperature differences between plots with planting holes and the control plot (Nn), no linear correlation was ob-served between planting hole diameter and soil temperature. Both air temperature and soil temperature were significantly affected by the heat exchange through planting holes. The amount of such heat exchange always depends on wind speed and other meteorological conditions. In addition, it is also expected that the amount of heat exchange differs from hole Fig. 6 Ratio of daily range of soil temperature at 10 cm
depth in each plot to that of plot Nn (control) from April 1 to June 27 in 2006.
References
to hole on the ridge surface too. Quantifying the relationships between these factors and the amount of heat exchange re-mains to be seen.
⑴ Takakura, T.: Climate under cover. Kluwer Academic
Publishers, pp. 1−8. Netherlands.(1993).
⑵ Yi, L., Mingan, S., Wenyan, W., Quanjiu, W., and Robert, H.: Open-hole effects of perforated plastic mulches on soil water evaporation. Soil Sci., 168, 751−758(2003). ⑶ Bhatt, R., and Khera, K. L.: Effect of tillage and mode of straw mulch application on soil erosion in the submon-taneous tract of Punjab, India. Soil and Tillage Res., 88, 107−115(2006).
⑷ Liakatas, A., Clark, J.A., and Monteith J.L.: Measure-ments of the heat balance under plastic mulches. Agric.
For. Meteorol., 36, 227−239(1986).
⑸ Tarara, J.M., and Ham, J.M.: Measuring sensible heat flux in plastic mulch culture with aerodynamic
conduc-tance sensors. Agric. For. Meteorol., 95, 1−13(1999). ⑹ Seo, R., Suzuki, H., Archana, D., and Matsui, T.: Effects of film mulch and unevenness of row surface on soil tem-perature. J. Agric. Meteorol., 57, 135−144(2001). ⑺ Ahang, K., Boersma, L., and Jarman, G. D.: Effects of
petroleum mulch on soil water content and soil tempera-ture. Soil Sci. Soc. Am. Proc., 33, 783−786(1969). ⑻ Petrone, R.M., Price, J.S., Karey, S.K., and Waddington,
J.M., Statistical characterization of the spatial variability of soil moisture in a cutover peatland. Hydrol. Process., 18, 41−52(2004).
⑼ Bennett, O.L., Ashley, D.A., and Doss, B.D.: Cotton re-sponses to black plastic mulch and irrigation. Agron. J., 58, 57−60(1966).
(Received October 31, 2007) Table 3 Standard partial regression coefficients in the multiple regression of daily range ratio of soil
tempeature at 10 cm depth and meteorological factors from April 1 to June 27 in 2006.
Range ratio1) Meteorological factor
2) Multiple3) regression coefficient Te Pr Ia Um SmA SmB Ph No canopy Mn3/Mn4) −0.296 −0.884 −0.242 0.760 Mn10/Mn 0.438 0.371 Mn16/Mn −0.279 −0.975 −0.251 0.878 Mn22/Mn −0.297 −0.782 0.398 0.761 Mn39/Mn −0.276 −0.929 −0.316 0.864 Canopy Mp3/Mn 0.690 −0.757 −0.392 −0.997 0.953 Mp10/Mn 0.556 −0.799 −0.322 −0.766 0.920 Mp16/Mn 0.489 −0.809 0.313 −0.477 −0.918 0.949 Mp22/Mn −0.757 0.254 −0.211 0.907 Mp39/Mn 0.558 0.211 −0.638 −0.273 −0.787 0.956
1)Criterion variables. Ratio of range: Daily range of soil temperature in each plot to that of plot Mn. 2)Explanatory variables.
Notation: Te = daily mean air temp.(℃); Pr = amount of precipitation (mm); Ia = amount of insolation (MJm− 2
day− 1); Um = daily mean wind velocity (ms− 1); SmA = soil moisture suction of A plot (mmHg);SmB = soil moisture suction of B plot(mmHg); Ph = plant height (cm).
3)Adjusted for the degrees of freedom. 4)Plot symbles were the same as in Table 1.
本実験は,マルチ栽培においてフィルムマルチの植穴径と地温効果との関係を明らかにするために行った。実験は, 2006年4月1日から6月27日にかけて圃場にて行った。植生下の各植穴区においては,植穴の大きさと純放射量,アル ベドとの間に明瞭な関係は得られなかった。植穴部上の空気の熱交換量は,植生の有無にかかわらず植穴径10cmで最 も大きく生じた。10cm深地温の日較差(期間平均)は植穴径と比例関係はなく,さらに植穴径10cmで最も小さく生じ た。地温日較差比に及ぼす気象要因は,植生の有無,植穴径によって異なった。