A STUDY ON THE TYPHOON MODEL
(1)- ON THE SIMULATIO.N MODEL AND
GAME OF THE
TYPHOON-MITSUO MOTOORI AND HISANORI ENOMOTO
Chubu Electric Company, Planning Department (Received June 30, 1961)
1. INTRODUCTION
In Japan, materials of hundred milliard yen that is equivalent to 20-30% of the national budget are deprived by storms, floods, earth-quakes, tidal waves and fires, etc. every year.
Particularly the damages owing to the typhoons are the biggest. It is pointed out by K. Takahashi (1)
*
that the average amount of damages owing to natural calamities is increasing year by year, and that the countermeasures to prevent disasters will become more effective.From the viewpoint of serving the customers of our electric company, the problem to prevent disasters owing to typhoons will become increasingly important in the future.
In September 1959, the violent Isewan typhoon passed through the Chubu district and deprived several thousand people of the lives and materials of hundred milliard yen.
From that time on, the subject of preventing typhoon' disasters greatly excited our interest. The O. R. group in the Planning Department of the Chubu Electric Company began to study the prevention of typ-hoon disasters from the viewpoint of operational research from July 1960.
The purpose of this report is to describe the scope of our research and to present a part of the results of computation with regard to the typhoon model.
2. OPERATIONAL RESEARCH ON TYPHOON DISASTERS
The disasters owing to a typhoon consist of the destruction of structures, namely houses, electric power stations, transmission facilities,
etc. When the destruction power
f
acts on some structure, whose strengthF is greater than
f,
there can be no damages.However the requirement
f<F
for every facility toward every destruction power is uneconomical. There are following ways to prevent the typhoon disasters, leaving out of consideration the possibility or impossibility of them.i) To prevent the attack of the typhoon.
ii) To avoid the destruction power of the typhoon.
iii) To strengthen the facilities.
iv) To minimize the damages.
v) To shorten the repair-time and minimize the loss due to da-mages.
Among these ways, i) is impossible at present, and ii) is possible for ships that can shift themselves, but impossible for the facilities of our electric company.
Concerning iii), we must consider the economical limitation in relation
f
and F.And iv) and v) are the most passive ways, but at present our means for prevention of the typhoon disasters are limited to them.
Therefore we picked up the following problems in this research, a) Prediction of the typhoon disasters,
b) Game of the typhoon,
c) Economical strength of the electric facilities against the wind. There are three mainly types of destruction power, namely due to strong wind, heavy rain, and highest-fIood-tide.
As the wind is related to rain and highest-fIood-tide, and is the most important item, we must discuss this problem in the first place. Since the problem of the highest-fIood-tide was studied at the Meteoro-logical Agency, we left out this problem. And the problem of rain is more difficult than that of wind, but we will study this problem next to wind as quickly as we can. Therefore in what follows the above-mentioned problems a)-c) are discussed mainly from the viewpoint of the wind in the typhoon model.
But, when we estimate the economical strength of facilities, it is necessary to include the items of rain and the highest-fIood-tide, so we will use a suitable approximation for the time being.
2. 1 Prediction of the typhoon disasters
It is very useful to predict the wind velocity, the rainfall and the resultant damages, several hours before the typhoon attacks. For example, in our electric company, by making arrangements of materials, workers, cars and so on according to the
prediction, we can begin the repair-works soon after the pas-sage of the typhoon.
Up to this time we were
~ ;<lf~t
/.
.t
22G
._e_e_e~ 2~ /
-0 11861- • ____ .
-o
I
.,.-used to making arrangements ;; 14r
.".-.-12r / by the reports from the actual ~ 1O~ •
~ 8~ . /
places, but it took much time to
~ 4
get the informations as shown in Fig 1 (Fig 1 is the case of the Isewan typhoon). -0
6V
~ [f. 2 Q.~ . , , . , " , ~ 5. 9.262728291010.12 34
56 7 8 9
101517202531 Fig. 1 c If we can predict the damages beforehand, it will be possible to prevent the delay ina; .<103
--g o 20
e_._e--.
. /
the preparation of workers and ~ materials caused by spending : them to no purpose, and even ~
E
prevent the damages themselves. ~ The merits of prediction depend on the accuracy of pre-diction, the costs for prevention of the damages and the amount
15 /
10
J-
-~;, -~";" ~~ ,~-;;':~-d~';',
5 about one month after the passage of the typhoon
1
9. 7 10.1 5 9
of damages. Fig. 2
First of all we must make use of the typhoon forecast announced by the meteorological observatory. It is said that recently the probability of the success the typhoon forecast at the Meteorological Agency is about 83% and is being improved year by year.
Thus the reliability of the typhoon forecast will become conside-rably high in the future and in practice it will be useful for our purpose.
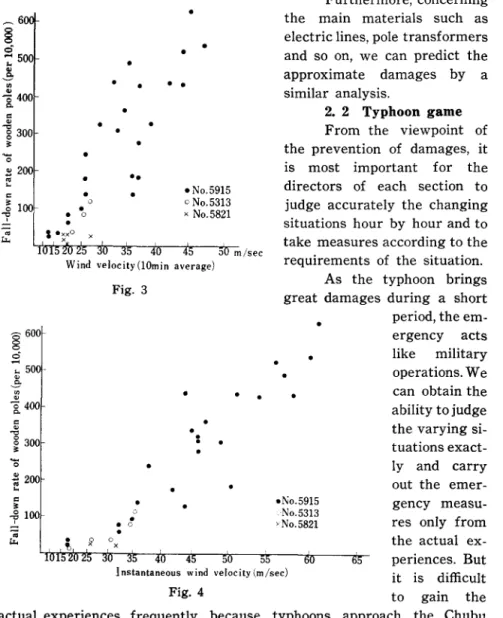
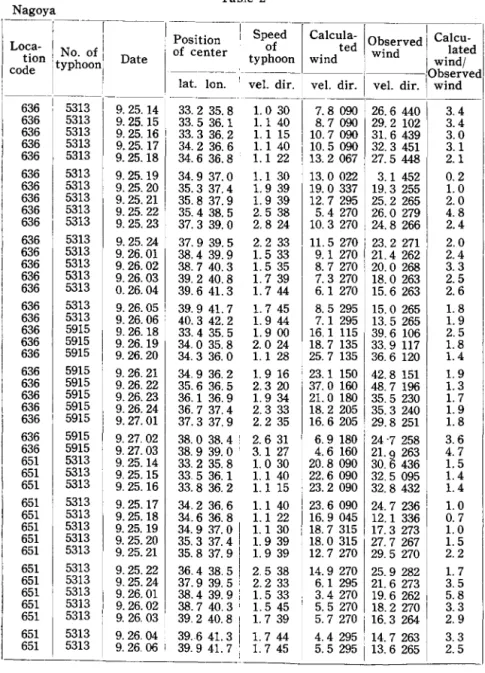
Therefore if we can simulate the destruction power of the typ-hoon that passes the course forecasted, the prediction of damages is possible. For example Fig 3 and Fig 4 show the relation between the
wind velocity and the fall-down rate, which is approximately proportional to the square of the wind velocity.
~6
§
<:5 :: 500 ~'"
..z
400 Co C <11 1300 ~-
o 2l 200'"
... c ~100 l' 8 600 0 0 0 -: 500-'" -8 '""
-0400 Co c """"
~ 300-
0 ~ ... 200 c ~ -f100 -;; 4.•
•
•
•
•
•
•
•
•
•••
o•
• 0•
•
•
•
•
•
•
•
• No.5915 c No.5313 x No.5821 ;)Wind velocity(10min average) Fig. 3
•
•
•
.
.
•
•
•
c,.
•
0•
? 0 x m/sec•
Furthermore, concerning the main materials such as electric lines, pole transformers and so on, we can predict the approximate damages by a similar analysis .2. 2 Typhoon game From the viewpoint of the prevention of damages, it is most important for the directors of each section to judge accurately the changing situations hour by hour and to take measures according to the requirements of the situation.
As the typhoon brings great damages during a short
•
•
•
.No.5915 No.5313 , No. 5821period, the em-ergency acts like military operations. We can obtain the ability to judge the varying si-tuations exact-ly and carry out the emer-gency measu-res only from the actual ex-periences. But Instantaneous wind velocity (m/sec) it is difficult
Fig. 4 to gain the
district only at rare intervals.
Then sham exercises are taken into consideration. In August,1960, our company performed a sham training on the prevention of disasterson a large scale.
But we cannot practice often because of expenditure and materials needed. Furthermore it is diflcult to estimate objectively whether the judgements of the directors were good or bad in the results.
On the contrary, it is expected by simple experiments on the desk that a sham exercise game is more effective than actual practice. This is because we can try bold methods which were not performed from caution, and reinvestigate the methods which was thought as the best up-to this time.
Now we are planning the typhoon game that mainly applied to the business departments of our company. Fig 5 shows an example of the game for the branches.
Judges -of workers. r -_ _ _ ...,iv)
~
ComputerI
calculations necessary to compose and judge costs. time for restoration and conditions of damages.Hi)
1'0.. ...
2.arrangement°'
I
ReportsI
of materials
3.arrangement 1 of om.
j
2.con· eo'ition of the typhoon. pressure depth. :iitions of wind. rainfall such as noticed at
actual place. .. the
l
InformationsI")
3. co",ach 4.cow r - - - - ' -i) r ' -i
A.team B.team C.team
~
' r-:iitions of damages such as collected at the lal place
1itions of restoration.
The same conditions given previous Iv.
1. the map with an entry of the location of the-offices and substations. power supply line number of customers and number of electric poles.
2. workers. materials and cars.
Fig. 5
o
The map within the jurisdiction of each branch with an entry of the location of each office, number of customers, route of the power supply, road, railway, etc.o
The list of goods in stock.o
Number of cars and workers.Especially it is necessary to divide the workers according to their functions.
ii) Information.
The following information are sent to each team timely.
o
The pressure depth in the center, radius, progressing speed, position of the center of the typhoon.These information are sent in the same form as announced by the Meteorological Observatory at some time-intervals after the typhoon passes the latitude thirty degrees north.
o
The wind velocity and direction, rainfall.These information are composed by calculation of the wind distribution according to the typhoon model and sent to each team.
:) The disaster conditions.
These information are composed by the method mentioned in 2. 1 and the fixed-time disaster information and great damages such as a substation stop considered separately.
o
The outlooks of other branches.o
The general arrangements, materials etc.When reinforcements to each branch are required, the judge (place in the head office) must arrange workers, materials, etc. according to the overall damages of the company and answer each branch.
o The connection with other electric companies.
o
The conditions of the repair-works.The judge must compose the repair-work informations based on the countermeasures reported from each team and send it to each team.
iii) Report of the countermeasures.
Each team carries out the repair-work and the prevention work subject to the information of the typhoon, damages, etc.
and must report the contents of these countermeasures carried out to the judges. The contents of these countermeasuses will be like the following.
o
The countermeasures for the flood based on the consideration of past experiences.o
The arrangements of workers, materials and cars for the repair-work of the power supply lines.o
The planning of repair-construction.o P. R. by service cars for controlling the complaints and the offering of the stoppage of the electric current.
o Consideration of the efficiency of repair-works in arragement of workers.
We establish the form of the report of these main ~ 100
problems.By the report,we make up the information of the repair-conditions, such as the transmission rate of electric power by means of a graph such as Fig 6, and send them to each team.
Of course, the restora-tion speed is the funcrestora-tion
... 90
'"
~ 80 "'-<.> 70 b <.> 60"
" 50...
oto
.:; ~ 30 3 20 if) if) 10-8 if)of workers, cars etc. and ~ ;.. cannot be determined only '""' by Fig 6. iv) Calculation. 110 .6 .? /"10.3 ... ·10.2 ,/10.1 /-9.30 /-9.29 /-9.28 - 9.27 10 20 30 40 50 60 70 80 90 100 U se-rate of lVoodenpoles (%) Fig. 6
In order to compose the above-mentioned information on the typhoon, wind, rainfall and damages, the calculation by simulating the typhoon model is the most important.
Since the calculations are considerably complicated, we must utilize a large scale electronic computer to calculate the time variation of the wind velocity in the game.
But we do not have one at hand, so we previously calculate it. There are many variations in the methods to calculate the damages,
repair-work and judgements, so we must be ready with calculating diagrams so that we might calculate them at the actual places.
v) Judgement.
At the final stage of the game judgements are performed.
Of course, it is naturally best to repair as early and fairly as possible and cheaply. But in case of small damages, a complete repair-work is better than a temporary repair-work and in case of great damages it is necessary to send light again as early and widely as possible even if the repair-work is rough.
Also there is the problem of the preservation of public peace. In the case of a very large size typoon such as No. 5915, there is no limitation of cost for the repair-work.
In these cases, the criteria of judgement are more complicated. There are many difficult problems but the ideal method for the various cases will be developed through the game.
2. 3 Economical strength of electric facilities for wind
The design strength of electric facilities for wind has been deter-mined for the yearly maximum wind velocity 40m/sec all over Japan, but the maximum wind velocity differs from place to place.
Therefore the economical design strength ought to differ from place to place. In order to analyze this problem, we must combine the modH of the destruction power due to wind, the model of the trend to weaken the strength of the facilities, and economical considerations.
i) Model of the destruction power.
The distribution of the yearly maximum wind velocity is available for this problem. But since there are much difficulties in this method, we are further considering to simulate the typhoon model as to make up for the distribution of the yearly maximum wind velocity.
Concerning the typhoon path, K. Takahashi (1) pointed out that there were noticed three periods of 4, 6.58 and 60 years in the number of typhoons appoached, and R. Saito pointed out that there was noticed the period of 5 years in the number of typhoons thet landed Japan in a year following the Poisson distribution.
It is very difficult to consider which course a typhoon will pass. But we assume the course of a typhoon will probabily pass near one of the typical courses of past typhoons.
ii) Model of the trend to weaken the strength of facilities. The strength of electric facilities become weaker year by year, but it is much complicated to analyize this problem because the facilities have different characteristics. For example a wooden pole has no corro-sion at first, but once it receives corrosive action, it becomes weak
rapidly.
We must consider this model statisticaly in the group of several thousand wooden poles or more.
iii) Economical consideratiOn.
The stronger the facilities are designed, the more the investment is required. The damages of destruction are usually greater than the costs for pre-renewal.
Furthermore the damages are different from place to place in our electric company.
By combining the above-mentioned two models as shown in Fig. 7 and taking economy into consideration, we can
deter-mine the most economical initial Fig. 7
strength and when or at which strength we must renew the facilities. Our purpose is to solve the problems mentioned in 2. 1 and 2. 3, and the point of the problems is how the destruction power comes out.
The problems of damage prediction, typhoon game, and economical design are solved accordingly to the destruction power. Then how we simulate the destruction power of the typhoons becomes the important problem.
Concerning the problems of damage prediction and typhoon game, we need to know how the destruction power at each place changes hour by hour.
In the problem of the economical design of the electric facilities, it is convenient to deal with the destruction powers statisticaly as appeared every year, and beyond this we use the typhoon model to make up for the lack of data.
3. TYPHOON MODEL (1)
In this chapter we shall explain the typhoon model considered
from the wind distribution in the region of the typhoon.
3. 1 Wind distribution in the region of the typhoon
The wind distribution within the typhoon is considerably irregular because of the complicated topographical features. Therefore, in the analysis we considered two separate model, namely, that which ignored the topographical features and that which included the topographical influences.
We attempted to form the empirical formula combining the appro-priate topographical factors to the ratio VI VO, where V is the theoretical wind velocity resulting from the ideal model and Vo the observed wind velocity.
There are many ways to represent the wind model of the typhoon, but we represented the wind model as the vector summation of the gradient wind and the field wind that drifts the typhoon.
a) Gradient wind (Vu)
If we may assume the circular form of the isobar lines and ignor the effects of wind friction, the wind velocity in an ideal cyclone at a stationary state is given by the following equation.
Vu=
-rw
sin9+Jr
2w
2 sin2(,O+~ _~(J_,
p or
where r is distance from center of typhoon, p air density,
w angular velocity of the earth, 9 latitude,
op/or
pressure gradient. b) Field wind (Vb).Assuming that the field wind velocity is proportienal to the pro-gressing velocity of the typhoon, decreasing as the distance from the center of the typhoon increases and that the ratio of the field wind velocity to the progressing velocity of the typhoon becomes e-< at the point of 1,000 mb, we get
Vb= Voe-lT,
A parameter,
r distance from center of typhoon, c) Theoretical wind velocity (V).
The theorertcal wind velocity V was calculated from the vector summation of Ve and Vb.
d) Topographical factors.
Comparing the calculated wind velocity with the observed one, it is seen that the calculated value is ~)O% greater than the observed value and the calculated wind direction deviates about 30 degrees inside from the observed wind direction. (see table 2).
It is possible for us to consider that the ratio VIVo depends mainly on the topographical features. Therefore this ratio may be represented by a function of the appropriate topograhical factors.
The topographical factors mainly consist of elevation, rise, expo-sure, orientation, etc.
3. 2 Pressure distribution within the typhoon.
In order to calculate the gradient wind and the field wind, we have
to know the pressure distribution within the typhoon.
As we see on the weather maps, the isobar lines in the inner region of the typhoon is approximately circular, but it is not exact. We don't have enough observatory stations to know the three-dimensional profile which is necessary to obtain good results. Even if we have such observed values, it is difficult to use them because of technical difficul-ties and the time of computation.
T. Fujita(2) gave the following equation representing the mean pressure along the circle with radius R km from the center.
PR
=
2~
12'PRedO, (1)The observed pressure distributions within the typhoons are shown in Fig. 8.
As we can see in Fig. 8, the curve of the pressure distribution is flat in the center, parabolic for the inner region, and hyperbolic for the outer region and converges to a constant value.
Introducing a variable :1:, the dimensionless quantity defined as the ratio r/ro, K. Takahashi(l) presented the following equation.
P=Poo_Ll-E
l+x'
and V. Bjerknes presentedP=P _~r_
00
1+x
2'where P is the pressure r km from the center, p"" the pressure undis-turbed by the typhoon, LlP the depth of the pressure funnel and ro the constant for each typhoon.
It has been proved that the former equation is capable of repre-senting the pressure curves in the outer areas and the latter capable of representing the inner areas of the typhoons well.
Taking the above-mentioned characteristics of the two equations into consideration, T. Fujta (2) obtained an equation which coincides with the equation by Takahashi in the outer area, and with that by V. Bjer-knes in the vicinity of the center, that is,
LlP
P=P,,-
jll+x
2' (2)and this equation was developed further, that is, P=P",,- LlP.. 2
Jl+(X;:;)
(3)Table 1
No. date
I
ral
r~=:;61
P--~---- , ,
-al
PoI
PJ,a=-PoId~~f~DI ~""i:)
I
Equation 15.26.18 600 100 1 5 929 70 91. 0 1000.0 I ! P= I 00 1020.0 91.0~1+(l~Y
19 5401 90 9 8 9 ~ I 948 50 59.8 1007.8 P= 1007.8- 59.8~1+(~y
20 540 90 1 000 950 50 59.8 1008.8 P= 1009.8 59.8~1+(-ioY
21 540 90 1 000 950; 50 59.8 1009.8 P= 1009.8 59.8where, a is the cyclone-constant for each typhoon.
Equation (3) can represent the pressure profiles better than equation (2), but it is complicated to use equation (3) for computation. Therefore we adopted equation (2) and we determined the constants Poo , JP and ro
by applying the empi-rical equation (2) to the curve obtainedby .directly plotted the ()bserved pressures at each station. ::0
ty- ~ While the
phoon is progressing on ~ the sea, we cannot use this method, but at
Vl
'"
... P.. 980 970 960 950 940 930 -No.5:113.---!---0 / /
/
I I / / ° I/
I I ° Io\.
/0_0/ I J ,./
I /-
--' - centerpressure ~ I --- radius I I I,
,
::lI-,
'"
0 .'!l 0 :.c: a.. en , == .~'"
§'"
.... "o---<J.,.-,
'il ~>-'"
u ' -l'" ~ ;;:s:: 'v-~_. cO ~ ~:E ~..;
.-
u'"'"
.5'"
~
'" u ..c P..O U) ..:!l present it is unneces-sary for us to know the pressure profile on the sea because our purpose is to discuss the topog-raphical factorsdis-2514 15 16 17 18 19 20 21 22 23 242601 02
Fig. 8 turbing the wind distribu tion
in the typhoon areas. 980 No.5915
Considering that ro is in
/7
the range of about lOOkm to 970
_e-·
I300 km, JP about 40 mb to 100
/_. J
mb, and the pressure increase 960
::0 is only 1 mb/lOO km at r=6ro, E
'"
%0-""""".-e-e
//
calculated JP and P 00 by I-we ::>/
r=;::,,,
'"
the pressure depth Po and the Ul '" ... I pressure
unit radius ro obtained by ta- P.. 940 - / --- radius
c- I
king 6 ro for the distance that ... ___ ~ __ ~ ___ 5
the pressure curve oblained by 930 °
ptottin the observed values at paCi~ga
each stationwas convergent to 1-- Ocean / . Japan sea the constant. Then we can find 2618 19 20 21 22 23 24 270102 03 .out the constants ro, JP and Poo Fig. 9
300 280 260 - 240 220 200 180 -160 140 120 - 100 80 260 240 220 200 180 E 160 ~ Vl ::> 140 :e
'"
120 ~ 100 80following the computation procedure shown in Table l. 3, 3 VIVo.
In this paragraph we summarize the computation procedures.
i) Pressure profile is
JP
P=Poo-
Jl+~;J2'
In this equation we find out the constants
Poo,
JP andro
by the method described in paragraph 3. 2.ii) Field wind is
Vb= Voe-1r.
where Vo is the speed of the typhoon movement and A is
A=
ro{J(poo~o~oY-l
r
iii) Gradient wind is
T T '
J
-~, 2 • 2 ra
pvo=-rw sm
so+
rw smso+ '-,
p ar
where w=7.29 xlO-5 radian/sec,
p=1.293 xlO-3 g/cm3,
so
=
latitude,rand
ap/ar
are calculated every time and at each observation station.iv) Theoretical wind is
V=
J
Vb2 sin2(r+-;)+ { Vo- Vbcos(r+-i)}
2,and
Y is the theoretical wind velocity,
a is the theoetical wind direction.
determination of wind direction position is considered~'::":":~ Fig. 12 v) VIVo direction of progress ion
We can obtain the ratio VI VO by dividing the theoretical wind velocity calculated in iv) by the observed wind velocity. The results are shown in Table 2.
ACKNOWLEDGEMENT
In conclusion of this report, we express our heartly thanks for the kind advices to Dr. K. Takahashi, Dr. R. Saito, Dr. M. Miyazaki of the Meteorological Agency, Mr. E. Suzuki, investigator at the Meteorological Institute, Mr. K. Ohtani the director of the Observation Section of the Nagoya Meteorological Observatory, Mr S. Shimura, researcher of our company.
We are also indebted to the director, operators and punchers of the Central Computation Section of our company for help in punching, classi-fying and printing data.
REFERENCES
1. K. Takahashi, An Operational Research on Disasters Concerned with Storms in Japan. Journal of Meterool_o~ical Resear~.~ Vol. 9 No. 1. 2. T. Fujita, Study in Typhoon, Chapter 1 Pressture Distribution Within
Table 2 Nagoya
I
---~--I
Position i speed-ca1cUla-iobserved Ca1cu-Lo<:a- No of of center! of . ted wind .IatedtlOn t hoon Date I typhoon wind I wlnd/ I code yp I --~---~ ----~ i ,Observed I ! lat. Ion. vel. dir. I vel. dir. I vel. dir. I wind I
I ----~--~--- - - ' - - -- - - · - - - , - - - 1
I
636 I 5313 I1 9. 25. 14 33_ 2 35. 8 1. 0 30 7. 8 090 ' 26. 6 440 3. 4 636 5313 9. 25. 15 33_ 5 36. 1 1. 1 40 8. 7 090 29. 2 102 3. 4 636 5313 9. 25. 16 33. 3 36. 2 1. 1 15 10. 7 090 31. 6 439 3. 0 636 5313 9. 25. 17 34. 2 36. 6 1. 1 40 10. 5 090 32. 3 451 3. 1 636 5313 9. 25. 18 34. 6 36. 8 1. 1 22 13_ 2 067 27. 5 448 2. 1 636 5313 9.25. 19 34.9 37.0 1. 1 30 13.0 022 3. 1 452 0.2 636 5313 9.25. 20 35.3 37.4 1. 9 39 19.0 337 19.3 255 1. 0 636 5313 9.25. 21 35.8 37.9 1. 9 39 12. 7 295 25.2 265 2.0 636 5313 9. 25. 22 35. 4 38. 5 2. 5 38 5. 4 270 26. 0 279 4. 8 636 I 5313 9. 25. 23 37.3 39.0 2. 8 24 10.3 270 24.8 266 2.4 636 636 636 636 636 636 636 636 636 636 636 636 636 636 636 636 636 651 651 651 651 651 651 651 651 651 651 651 651 651 651 651 5313 5313 5313 5313 5313 5313 5313 5915 5915 5915 5915 5915 5915 5915 5915 5915 5915 5313 5313 5313 5313 5313 5313 5313 5313 5313 5313 5313 5313 5313 5313 5313 9.25.24 9.26.01 9.26.02 9.26.03 0.26.04 9.26.05 9.26.06 9.26.18 9.26.19 9.26.20 9.26.21 9.26.22 9.26.23 I 9.26.24 9.27.01 9.27.02 9.27.03 9.25.14 9.25.15 9.25.16 9.25.17 9.25.18 9.25.19 9.25.20 9.25.21 9.25.22 9.25.24 9.26.01 9.26.02 ! 9.26.03 I 9.26.04 : 9.26_ 06 i 37.939.5 38.439.9 38. 7 40.3 39.240.8 , 39.6 41. 3 39.9 41. 7 40.342.2 33.435.5 34.035.8 34.336.0 34.936.2 35.636.5 36.1 36.9 I 36.737.4 , 37.337.9 ! 38.0 38. 4 38.939.0 33.235.8 33.536.1 33.836.2 34.2 36.6 • 34.636.8 • 34.937.0 35.337.4 35.837.9 36.438.5 37.939.5 38.439.9 38.740.3 39.240.8 39.6 41. 3 39.9 41. 7 2.233 1. 533 1. 5 35 1. 739 1. 744 1. 7 45 1. 944 1. 9 00 2.024 1.1 28 1. 9 16 2.320 1. 934 2.333 2.235 2.631 3. 1 27 1. 0 30 1. 1 40 1.1 15 1.1 40 1. 1 22 1. 1 30 1. 9 39 1. 9 39 2.538 2.233 1. 5 33 1. 5 45 1. 739 1. 7 44 1. 745 11. 5 270 I 9.1 270 8. 7 270 7.3270 6. 1 270 23.2271 21. 4 262 20.0268 18.0263 15.6263 8.5295 15.0265 7.1295 13.5265 16.1115 39.6106 18.7135 33.9117 25.7135 36.6120 23. 1 150 42. 8 151 37.0160 48.7196 21. 0 180 35. 5 230 18.2205 35.3240 16.6205 29.8251 6. 9 180 ! 24'7 258 4.6160 21.9263 20.8 090 30.6 4361 22.6090 32.5095 23.2090 32.8432 23. 6 090 24. 7 236 ' 16.9045 12.1336 18.7315 17.3273 18.0315 27.7267 12.7270 29.5270 14.9270 25.9282 6. 1 295 21. 6 273 3.4270 19.6262 5.5270 18.2270 5. 7 270 116. 3 264 4. 4 295 i 14. 7 263 5. 5 295 I 13. 6 265 2.0 2.4 3.3 2.5 2.6 1.8 1.9 2.5 1.8 1.4 1.9 1.3 1.7 1.9 1.8 3.6 4. 7 1.5 1.4 1.4 1.0 O. 7 1.0 1.5 2.2 1.7 3.5 5.8 3.3 2.9 3.3 2.5I I
I
Speed Calcula-
Observ~d
ICalcu-I Position
Loca- ' of ted wind lated
tion No. of: Date I of center typhoon wind
wind! code : typhoon
1-
lat. Ion.iObserved
I ! vel. dir. , vel. dir. vel. dir. I wind
651 I 5313 9.26.06 30.342.21 1. 944 3. 2 270 I 12. 3 266 I 3.8 651 I 5915 9.26.18 33.435.5 1. 9 00 26. 4 115 I 45. 5 105 I 1.7 651 I 5915 9.26.19 34.035.8 I 2.024 33. 6 115 i 36. 7 121 i 1.1 651 5915 9.26.20 i 34.336.0 I 1. 1 28 35. 0 135 I 34. 0 132 i 1.0 651 5915 9.26.21 I 34.936.2/ 1. 9 16 24. 3 180 . 37. 5 201 ' 1.5 651 5915 9.26.21 , 34.936.2 1. 9 16 18. 0 135