• 検索結果がありません。

C a u s a l i t y T e s t s A m o n g H i g h - p o w e r e d M o n e y , M o n e y S u p p l y a n d N o m i n a l G N P : t h e U S , 1 8 7 1 - - 1 9 7 5 a n d t h e U K , 1 8 7 4 1 9 7 5 `

N/A
N/A
Protected

Academic year: 2021

シェア "C a u s a l i t y T e s t s A m o n g H i g h - p o w e r e d M o n e y , M o n e y S u p p l y a n d N o m i n a l G N P : t h e U S , 1 8 7 1 - - 1 9 7 5 a n d t h e U K , 1 8 7 4 1 9 7 5 `"

Copied!
18
0
0

読み込み中.... (全文を見る)

全文

(1)

<liff5E.l -- I >

Causality Tests Among High-powered Money, Money Supply and Nominal GNP : the US,

1871--1975 and the UK, 18741975`

Koji KOBAYASHI

r . Introduction

II . The relation among Granger test, Sims test and Geweke test

III . Results of causality tests in the US case 1V . Results of causality tests in the UK case V . Summary

I. Introduction

This paper reports some fact findings which are detected by the statistical methods of causality test among high-powered money, money supply and nominal GNP in the US and the UK cases.

We have recently tested the causal relationships among high-powered money, money supply, bank loan and nominal GNP by means of Granger test, Sims test and the decomposition of variance (using VAR model) in the Japanese case. In that case the causal relationship running from money supply to high-powered money was detected by using quarterly data, and it appeared to be the composition of the

causal relationship running from money supply to nominal GNP which was asserted by monetarism and that running from nominal GNP to high-powered money of which the most part consisted of cash in circulation, which showed the demand for cash by the public due to the transaction motive.

For the US and the UK some studies about the similar causality tests have been published by other scholars. For example, for the US Moore [11 ], using quarterly data since the middle of 1960s, found that "Increases in money wage rates ... will

* I am grateful to Professor Hirotaka Kato and other members of the Workshop of Mone- tary Studies of Soka University for their helpful comments and suggestions.

1) See Kobayashi [8] 1987a, [9] 1987b.

(2)

142 Vol. XVIII No. 3 thus lead directly to an increase in the quantity of bank credit demanded , and so to a corresponding increase in bank deposits and in the money stock" (p. 546). Feige and Mcgee [1 ] conducted Sims test using weekly data of total reserve and M1 transformed by Box-Jenkins filter for the seven years immediately preceding the 1968 amendments to Regulation D and the seven years immediately following the transi- tion to LRA (the lagged required reserve accounting conventions). And they found that "With respect to the causality issue, for the preamendment period , an examina- tion of columns 1 and 3 shows that we cannot reject, at the 5 percent level , both the hypothesis that money does not cause reserves and the hypothesis that reserves do not cause money ... Examination of columns 2 and 4 for the postamendment period reveals that the money supply is exogeneous with respect to total reserves and that money causes reserve" (p.547). On the other hand, Meltzer [10 ] stated , for the time period from March 1947 to March 1965, that "Evidence from past periods suggests that the monetary base is the most important determinant of the money supply and that there is a high degree of association between the base and the money stock ... In the past, 85 percent of the variance of the monthly change in money—currency and demand deposits—resulted from changes in the monetary base and changes in Treasury deposits at commercial bank in the current and previous month" (p. 18)2). Sims [13 ] detected the causal relationship running from monetary base to nominal GNP and that running from M1 to nominal GNP for the period 1949 111-1968 IV. In his paper all the variables used in regressions were prefiltered using Nerlove filter 1-1.5L+.5625L2.

For the UK Goodhart [4] analyzed the causal sequence of the equilibrating mechan- ism of gold standard with monthly data (in Chap. 14) and with weekly data (in Chap. 15). And he stated that "The inference of this finding is that movements in the money supply were adapted, and accommodated, to movements in money incomes, so that the direction of causation ran from increase in incomes to increases in money balances, not vice versa" (p. 11). Williams, Goodhart and Gowland [14 ] tried Sims test with quarterly data transformed by GLS filter for 1958 1-1971 III and they found some evidence of unidirectional causality running from nominal income to narrow money.

2) For M2 case Meltzer [10] stated "The relation between monthly changes in the monetary base and money plus time deposits is not as good. Nevertheless, more than 75 per cent of the variance of the monthly changes in this monetary aggregate can be controlled by using the base as a target and estimating Treasury deposits as accurately as in the past"

(p. 19)

(3)

December 1988 /j '' : Causality Tests Among High-powered Money143

These results as so far reviewed were all detected by using short period data such as weekly data, montly data and quaterly data.

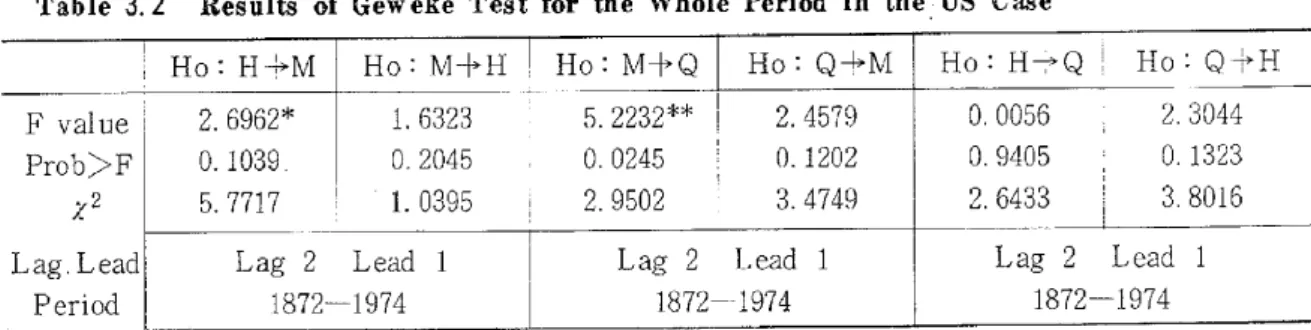
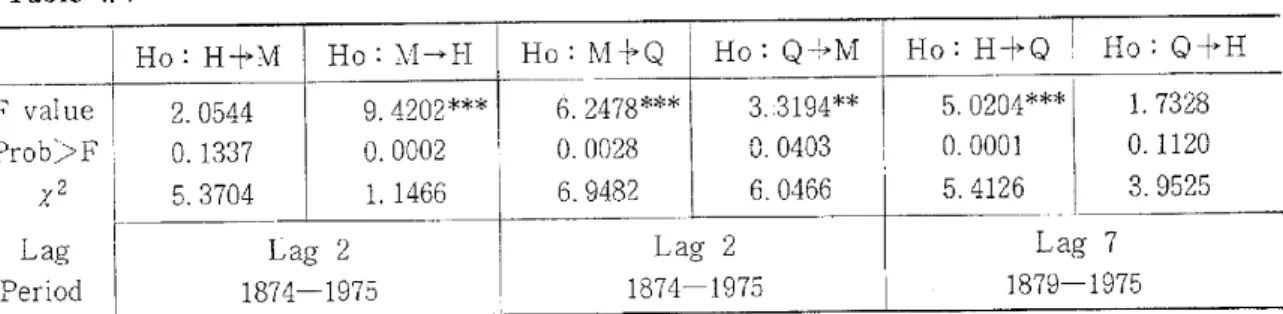
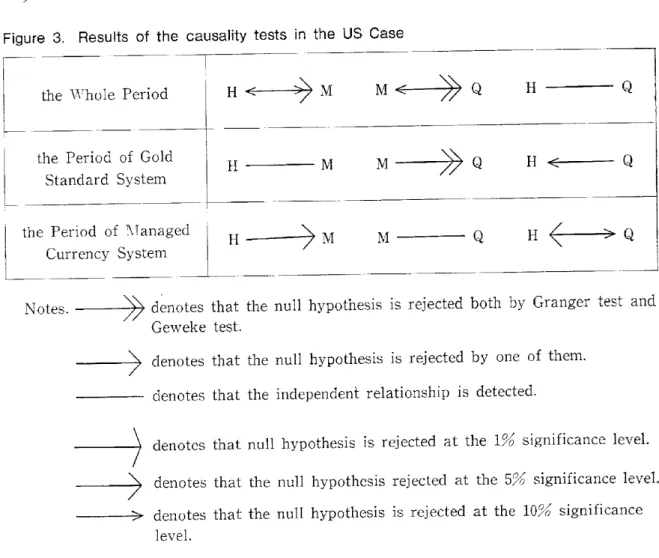
Now we can utilize the long series of the relevant annual data for the US and the UK published in Friedman and Schwartz [2 ]'>, so that in this paper we will test the causal relationships among high-powered money, money supply and nominal GNP using those annual data for the US and the UK and examine the validity of the monetarist assertion that the causal relationships are running from high-powered money to money supply and from money supply to nominal GNP. Since the data published in Friedman and Schwartz [2] cover the period from the middle of the 19th century to recent time (1869-1975 for the US and 1871-1975 for the UK), we conduct the tests for the whole period, for the period of gold standard system (until 1933 for the US and until 1931 for the UK) and for the succeeding period, that is, the period of managed currency system.

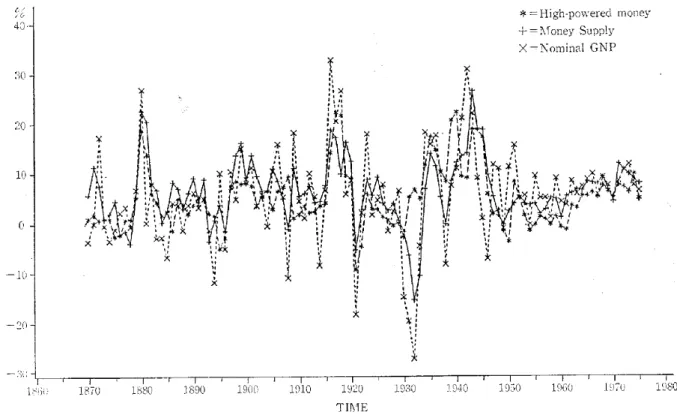
We utilize the data as transformed into the rate of change as compared with the preceding year (See Figure 1 and 2).

The statistical methods of causality test used in this paper are only Granger test and Geweke test4 . Statistical method of Sims test is not used here. Reference should be made to some comparative studies of the various methods of causality test. Nelson and Schwert [12] found that the most powerful test was Granger test.

Geweke, Meese, and Dent [3 ] found that Granger test and Geweke test were prefered to Sims test. Guilkey and Salemi [6 ] found that both Granger test and Geweke test were more powerful than Sims test, and they recommended Granger test because this test was computationally the least expensive of the three and resulted in the fewest degrees of freedom lost from formation of lags and leads. Therefore we use only Granger test and Geweke test and don't use Sims test. And we don't use the method of decomposition of variance, either. Because the result of that method is very likely to be affected by the change of arrangement order of variables in the decomposition of variance when using annual data which has large coefficients of correlation among contemporaneous residuals5) .

The length of the lag in Granger test and Geweke test is determined by AIC 3) Friedman and Schwartz [2] 1982, Table 4.8, pp. 122-129 for the US and Table 4.9,

pp. 130-137 for the UK.

4) Geweke test is a lagged dependent variable version of Sims test introduced in Geweke et al. [3] 1983. But we call it "Geweke test" in this paper.

5) Indeed this time we conducted the method for some cases and found that the results were affected by the change of arrangement order of variables. See also Kobayashi [9]

1987b.

(4)

z44 Vol. XVIII, No. 3

Figure 1. High-powered money, Money Supply and (Annual Rate of Change)

Nominal GNP in the US

40•

30

20

10

0

-10

-

1 N(ii) 1870 1880 1890

*=High-powered money + = \1oney Supply

X =Nominal GNP

1900 1910

xy. ~

1920 TIME

1930

)4,',nn

N

r ,;

r s r r r ;

1940

t.' A ,

1950 1960 1076 1980

Figure 2. High-powered (Annual Rate

money, Money Supply and Nominal of Change)

GNP in the UK

40

30

20

10

0

—10

—20

1870 1880 1890 1900 1910 1920 1930

* =High-powered money +=Money Supply X =Nominal GNP

1940

x >°S k

4A

1950 1960 1970 1980

TIME

(5)

December 1988 dqt{l'` : Causality Tests Among High-powered Money 145 (Akaike's Informations Criterion). By the method, however, the lag has proved generally not to be so long and 1 period for the lead is used in all cases of this paper.

In Section II the process deriving Sims test from Granger test is explained and in this precess Geweke test is explained . In Section III the results of causality test in the US case and in Section IV the results of causality test in the UK case are reported, respectively. And Section V summarizes our findings .

II. The relation among Granger test, Sims test and Geweke tests'

To begin with, Granger test is conducted as followsn .

Consider the simple causal model

xt=alxt_1+...+apxt_p+blyt-1+...+bpyt-p+u1t yt=clxt_1+...+ct_+d1yt-1+...+d(1)

x

pppyt-p+u2t

Under the assumption that ult and u21 are two uncorrelated white-noise series , the definition of Granger causality implies that yt is causing xt provided that some bk is not zero in the first equation of (1). Similarly xt is causing yt if some ck is not zero in the second equation of (1). Therefore in F test of the null hypothesis Ho : b1= b2 =...= by = 0 against alternative hypothesis R-1: bk 0 for some k in (1), if the null hypothesis is rejected, it is said that yt is causing xt and it is denoted as y,—>x,. If the null hypothesis is not rejected, it is said that yt is not causing xt and

it is denoted as yt-H-÷xt.

On the other hand, Sims test is based on a distributed lag model

yt = hkxt-k + wt(2 )

k=o

where E(x,wt) =0 must be satisfied for all s and t in order that (2) should be a regression models'.

Now if we postulate Granger causality yt-f--xt, (1) becomes as follows.

xt=alxt_,+...+apxt-p+ult

yt=c1xt_1+...+cpxt-p+dlyt_1+...+dpyt_p+u,t(3)}

Generally, however, E(ultu2t)=c,20 , so that E(xt_ku2t_k)#0. Therefore u2t_k(k>0) affects xt, so that it is inconsistent with the asumption yt-->xt . Hence the model must be change so as to eliminate the correlation between contemporaneous residuals:

6) This section owes largely to Yamamoto [14] 1988.

7) See Granger [5] 1969.

8) See Sims [13] 1972.

(6)

~46 adVol. XVIII, No. 3

If thelower triangle matrix T=[ .10I is multiplied 612/6111 to the covariance matrix

— [dll 012from right and left hands, we have

621622

TET'_2"-=611+ L 0 0+where611—6i1 622622{=622-6122/611.

Multiplying the matrix T to (3) from left hand, we have

xt=alxt-1+...apxt-p+ult(4 )

—co+xt+yt=Ci+xt+...+cp+xt-p+dlyt-1+...+dpyt-p+u2t+

where — co+ = —0'12/011 Ck+ = — co+ak + ck = — (612/611) ak +Ck u2t+ = — (612/611)ult + u2t.

Here we have T Ut=(ult}1 Lu2tu2t = Ut+ where Ut = [ult

Now we have

var Ut+ = E(Ut+ Ut+') = TET' -=E+.

There is no correlation between contemporaneous residuals in,this case, so that

E(xtu2s+)=0 for all s and t.(5 )

Rearranging the second equation in (4), we have Yt=Co+xt+Cl+xt-1+...+Cp+xt-p

+dlyt_1+...+dpyt-p+u2t+(6 )

Yt—dlyt_1—... —dpyt-p=co+xt+Cl+xt-1+...+Cp+xt--p+u21+

(1—s dkLk)yt = c+ kLkxt+u2t+

k=1 k=o

d(L)y,= c+(L)xt+ u2t

yt=d(L)-1c+(L)xt+d(L)-1u2t+

yt=h(L)xt+wt(7)

where

(1--E dkLk) = d(L), c+kLk = c+ (L)

k=ik=o

d(L)-1 c+ (L) = h(L) = hkLk

k=o

d(L)-1u2t+ =wt.

Now wt is expressed by u2t+ and u2t+ is obviously not correlated to xt by (5).

Therefore (7) is a distributed lag model (a regression model). Hence if ye- I-*xt, it is expressed by yt= hkxt-k+wt.

k.o

Then since we generally has a serial correlation, it is necessary that the data be

(7)

December 1988 : Causality Tests Among High-powered Money147

appropriately prefiltered by d(L) to eliminate the serial corrlation in Sims test9' . Hence

d(L)yt=yt+, d(L)xt=xt+

In this case (7) is transformed into

yt+=h(L)xt++u2t}(8 )

Then it is Sims test that examines Granger causality by F test on whether added future values of xt+ are significant or not in (8). On the other hand, it is Geweke test that examines Granger causality by F test on whether added future values of xt are significant or not in (6)10). In both tests if the added future values are not significant, it is said that yt dose not cause xt in the sence of Granger causality

(y,--}xt). Geweke test is different from Sims test in respects of the needlessness of prefiltering and the presence of lagged values of the explained variable as explaining variables. And (6) resembles to the second equation in (3), but (6) is different from it in respect of the presence of xt as an explaining variable .

III. Results of causality tests in the US case

1) For the whole period, the results of causality tests in the US case are as follows. (See Table 3.1 and 3.2)

First, as to the causal relationships between high-powered money and money supply, the hypothesis that high-powered money does not cause money supply is rejected at the 5% significance level by Granger test (F value =3 .3942) and at almost

Table 3. 1 Results of Granger Test for the Whole Period in the US Case

Ho : H=>M Ho : M+H Ho: M- >Q Ho: Q+M Ho : H -I-> Q Ho •Q+H F value

Prob> F XL

1 3 .3942**

0. 0375 1. 6000

2. 9663*

0.0561 7. 2800-

4.5496**

0.0129 2. 2200

2. 4849*

0.0885 1. 9600

1. 4293 0.2444 5. 2500

1.

0.

5.

8388 1644 4500 Lag

Period

Lag Lag 2 1872-1975

Lag Lag 2 1872-1975

Lag 1872----1975

Notes. H, M and Q denote high-powered money,money supply and nominal GNP , respectively

*** shows that null hypothesis (yt -H xt) is rejected at the level of 1 °o signifi -

cance.

** shows that null hypothesis (Yt xt) is rejected at the level of 5 % signifi -

cance.

* shows that null hypothesis (yt +xt) is rejected at the level of 10% signifi -

cance.

9) The appropriate filter is usually detected by some methods so that Wt becomes a white noise. But it seems that we can directly use d(L) which is estimated on (1).

10) See Geweke et al. [3] 1983.

(8)

14811J ~1

Table 3.2 Results of Gew eke Test for the

IS ll-1

Whole

tit t

Period in the

Vol,

US Case

XVIII, No. 3

Ho : H+M Ho : M+H Ho : M+Q Ho : Q+M Ho : H+Q Ho: Q+H F value

Prob>F X2 Lag. Lead

Period

2. 6962*

0. 1039.

5. 7717

1. 6323 0.2045 1. 0395

5.2232**

0.0245 2.9502

2.4579 0. 1202 3.4749

0. 0056 0. 9405 2. 6433

2. 3044 0. 1323 3.8016 Lag 2 Lead 1

1872-1974

Lag 2 Lead 1 1872--1974

Lag 2 Lead 1 1872----1974

the 10% significance level by Geweke test (F value=2.6962). On the other hand, the hypothesis that money supply does not cause high-powered money is rejected at the 10% significance level by Granger test (F value =2.9663), but not rejected even at the 10% significance level by Geweke test (F value=1.6323). Hence the bidirectional causality is detected. However, the causality running from high-powered money to money supply is stronger than the reversed causality with respect to the significance level.

Next, as to the causal relationships between money supply and nominal GNP, the hypothesis that money supply does not cause nominal GNP is rejected at the 5%

significance level by both of Granger test (F value =4.5496) and Geweke test (F value=5.2232). On the other hand, the hypothesis that nominal GNP does not cause money supply is rejected at the 10% significance level by Granger test (F value

=2.4849) but not rejected even at the 10% significcance level by Geweke test (F value=2.4579). Hence the bidirectional causality is detected. However, the causality running from money supply to nominal GNP is stronger than the reversed causality with respect to the significance level.

Lastly, as to the causal relationships between high-powered money and nominal GNP, neither the hypothesis that high-powered money does not cause nominal GNP nor the hypothesis that nominal GNP does not cause high-powered money is rejected even at the 10% significance level, that is, the independent relationship is detected both by Granger test and Geweke test.

The figures of x2 row in the tables are n•R2 values for the Breusch-Goodfey test which is the method for testing autocorrelation of residuals over 4th order"". In the test we refer n•R2 values to the x2 distribution for 4 degree of freedom and reject the null hypothesis that there is no autocorrelation over 4th order in residuals if a significantly large n•R2 value is found. By the test there is no autocorrelation

11) See Johnston [7] 1984, pp. 319-321.

(9)

December 1988 /f1s 7 : Causality Tests Among High-powered Money149

over 4th order in residuals in any cases, because 1% critical value in x2 distribution for 4 degrees of freedom is 13.277.

The lags which are determined by AIC are all two periods.

The tests periods are 1872-1975 in Granger test and 1872-1974 in Geweke test.

2) For the period of gold standard system, the results of causality test in the US case are as follows. (See Table 3.3 and 3.4)

Table 3.3 Results of Granger Test for the Period of Gold Standard System in the US Case

Ho : H-I-M Ho : M+H Ho:M+Q Ho : Q+M Ho = H+Q Q+H

F value Prob> F

X2 Lag Period

1. 0720 0. 3491 3. 4916

1. 1344 0.3288 3. 2480

4. 1529**

0.0460 2.9618

0.8236 0.3678 3. 7878

0.6634 0.4186 0.3245

2. 8713*

0. 0954 7. 1213 Lag 2

1872-1933

Lag 1 1871-1933

Lag 1 1871-W-1933

Table 3.4 Results of Geweke Test for the Period of Gold Standard System in the US Case

Ho : H+M I Ho : M+H Ho : M+Q Ho: Q+M Ho: H±Q Ho: Q+H

F value 1. 2361 1. 3995 4.6643** 1.9740 0. 6452 1. 7925

Prob>F 0. 2711 I 0. 2419 0.0349 0.1654 0.4251 0. 1858

X2 3. 4278 2. 2272 4. 1890 4.0533 5.5224 3.1477

Lag. Lead Lag 2 Lead 1 Lag 1Lead 1 Lag 1 Lead 1

1C/7i inoo

Period1872-1933 1871-19331871----193

First, as to the causal relationships between high-powered money and money supply, the independent relationship is detected both by Granger test and Geweke test.

Next, as to the causal relationships between money supply and nominal GNP, while the hypothesis that money supply does not cause nominal GNP is rejected at the 5% significance level both by Granger test (F value =4.1529) and Geweke test (F value =4.6643), the hypothesis that nominal GNP does not cause money supply is rejected neither by Granger test (F value=0.8236) nor by Geweke test (F value

=1.9740) even at the 10% significance level. Hence the uniderctional causality running from money supply to nominal GNP is detected.

Lastly, as to the causal relationships between high-powered money and nominal

GNP, the hypothesis that high-powered money does not cause nominal GNP is

rejected neither by Granger test (F value =0.6634) nor by Geweke test(F value =0.6452)

(10)

1501J ;IJ CC a 'A RIa VVol. XVIII, No. 3 even at the 10% significance level. On the other hand, the hypothesis that nominal GNP does not cause high-powered money is rejected at the 10% significance level by Granger test (F value=2.8713) but not rejected even at the 10% significance level by Geweke test (F value-1.7925). Hence the unidirectional causality running from nominal GNP to high-powered money is detected.

According to the Breusch-Godfrey test there is no autocorrelation over 4th order in residuals in any cases, because 1% critical value in x2 distribution for 4 degrees of freedom is 13.27712).

The lags which are determined by AIC are two periods in the cases between high-powered money and money supply and one period in the other cases. Therefore the tested periods of the former cases are 1872-1933 both in Granger test and Geweke test and the tested periods of the latter cases are 1871-1933 ,both in Granger test and Geweke test.

3) For the period of managed currency system, the results of causality tests in the US case are as follows. (See Table 3.5 and 3.6)

First, as to the causal relationships between high-powered money and money Table 3.5 Results of Granger Test for the Period of Managed Currency System in the

US Case

Ho : H -I-+M Ho : M+H Ho : M+ Q Ho : Q +M Ho : H+Q Ho : Q +H F value

Prob>F X2 Lag Period

4. 9054**

0.0327 5. 4948

0. 6788 0. 4150 10. 1044

0.6734 0.4168 10. 7122

2. 6375 0. 1124 5. 1832

2. 2498*

0. 0612 12. 2056

3.0084**

0.0180 11. 5634 Lag 1

1934--1975

Lag 1 1934--1975

Lag 7 1934--1975

Table 3. 6 Results of Geweke Test for the Period of Managed Currency System in the US Case

Ho:H+M Ho : M+H Ho : M+Q Ho : Q +M Ho : H+Q Ho : Q+H F value

Prob>F x2 Lag. Lead

Period

0.5117 0.4790 6.2012

0.8314 0.3679 8.5988

1.3368 0. 2552 11. 7105

1. 3816 0. 2475 15.5400

0. 0731 0.7892 16.6056

2. 2395 0. 1476 20.5054

1-/CI. Lag 1 Lead 1

1934----1974

Lag 7 Lead 1 1934-1974

12) Since this test should be conducted for the large sample , it may be useless for the

period of gold standard system and for the period of managed currency system, respectively .

(11)

December 1988 Ij\**f'k : Causality Tests Among High-powered Money 151 supply, the hypothesis that high-powered money does not cause money supply is not rejected even at the 10% significance level by Geweke test (F value=0.5117) but rejected at the 5% significance level by Granger test (F value=4.9054). On the other hand, the hypothesis that money supply does not cause high-powered money is rejected neither by Granger test (F value=0.6788) nor by Geweke test (F value

=0 .8314) even at the 10% significance level. Hence the unidrectional causality running from high-powered money to money supply is detected.

Next, as to the causal relationships between money supply and nominal GNP, the independent relationship is detected both by Granger test and Geweke test.

Lastly, as to the causal relationships between high-powered money and nominal GNP, by Granger test the hypothesis that high-powered money does not cause nominal GNP is rejected at the 10% significance level (F value=2.2498) and the hypothesis that nominal GNP does not cause high-powered money is rejected at the 5% significance level (F value=3.0084), but by Geweke test the independent relation- ship is detected. Hence the bidirectional causality is detected. However, the causality running from nominal GNP to high-powered money is stronger than the reversed causality with respect to the significance level.

According to the Breusch-Godfrey test there is no autocorrelation over 4th order in residuals in any cases except Geweke tests of causalities running from nominal GNP to money supply, from high-powered money to nominal GNP and from nominal GNP to high-powered money, because 1 % cirtical value in x2 distribution for 4

degrees of freedom is 13.277.

The lags which are determined by AIC are seven periods in the cases between high-powered money and nominal GNP and one period in the other cases.

The tested periods are 1934-1975 in Granger test and 1934-1974 in Geweke test.

These results in the US case are compactly depicted in Figure 3.

IV. Results of causality tests in the UK case

Table 4. 1 Results of Granger Test for the Whole Period in the UK Case

Ho : H+M Ho:M+H Ho• M+Q Ho : Q +M Ho : H+Q Ho : 0+-H

F value Prob>F

2 Lag Period

2.0544 0. 1337 5.3704

9.4202***

0.0002 1. 1466

6. 2478***

0.0028 6.9482

3..3194**

0. 0403 6.0466

5.0204***

0. 0001 5.4126

1.

o.

1. 7328 _.1120 3.9525 Lag

Lag 2 1874-1975

Lag Lag 2 1874-1975

Lag 7

1879-1975

(12)

152T1 .1 , 1J in 1) For the whole period, the results

follows. (See Table 4.1 and 4.2) Table 4.2 Results of Geweke Test for the

Iffi A piti V Vol. XVIII, No.

of causality tests in the UK case are

Whole Period in the UK Case

3

as

Ho : Ho : M±H Ho : M+ Q Ho : 0+M Ho : H+Q Ho : Q±H

F value Prob>F

2 Lag. Lead Period

1.4014 0. 2395 4. 9179

14. 3183***

0.0003 9.8746

15. 0337***

0.0002 1.8624

1. 0417 0.3101 1. 2125

0. 0138 1. 3156

6. 3436**1 3.0129*

0. 01380. 0865

- 5.8236

Lag 2 Lead I 1874-1974

Lag 2 Lead 1 1874-1974

Lag 7 Lead 1 1879-1974

First, as to the causal relationships between high-powered money and money supply, while the hypothesis that high-powered money does not cause money supply is rejected neither by Granger test (F value=2.0544) nor by Geweke test (F value

=1.4014) even at the 10% significance level, the hypothesis that money supply does not cause high-powered money is rejected at the 1% significance level both by Granger test (F value-9.4202) and Geweke test (F value=14.3183). Hence the unidi- rectional causality running from money supply to high-powered money is detected.

Next, as to the causal relationships between money supply and nominal GNP, the hypothesis that money supply does not cause nominal GNP is rejected at the 1%

significance level both by Granger test (F value=6.2478) and Geweke test (F value

=15.0337). On the other hand, the hypothesis that nominal GNP does not cause money supply is rejected at the 5% significance level by Granger test (F value

=3 .3194), but not rejected even at the 10% significance level by Geweke test (F value=1.0417). Hence the bidirectional causality is detected. However, the causality running from money supply to nominal GNP is stronger than the reversed causality with respect to the significance level.

Lastly, as to the causal relationships between high-powered money and nominal

GNP, the hypothesis that high-powered money does not cause nominal GNP is

rejected at the 1% significance level and the 5% significance level by Granger test

(F value-5.0204) and Geweke test (F value-6.3436), respectively. On the other hand,

the hypothesis that nominal GNP does not cause high-powered money is rejected at

the 10% significance level by Geweke test (F value=3.0129) but not rejected even at

the 10% significance level by Granger test (F value =1.7328). Hence the bidirectional

causality is detected. However, the causality running from high-powered money to

nominal GNP is stronger than the reversed causality with respect to the

significance level.

(13)

December 1988 /M1--'&: Causality Tests Among High-powered Money153

According to the Breusch-Godfrey test there is no autocorrelation over 4th order in residuals in any cases.

The lags which are determined by AIC are seven periods in the cases between high-powered money and nominal GNP and two periods in the other cases. There- fore the tested periods of the former cases are 1879-1975 in Granger test and 1879-- 1974 in Geweke test and the tested periods of the latter cases are 1874-1975 in Granger test and 1874-1974 in Geweke test.

2) For the period of gold standard system, the results of causality tests in the UK case are as follows. (See Table 4.3 and 4.4)

Table 4. 3 Results of Granger Test for the Period of Gold Standard System in the UK Case

I Ho : H +M Ho : M+H Ho : M±Q Ho : Q+M Ho : H+Q Ho : Q+H F value ',

Prob>F

2 Lag Period

7.8845***

0.0002 4.7435

1. 0958 0. 3596 2. 2737

7. 3111***

0. 0004 9. 2273

4. 0859**

0. 0114 1. 9239

12. 8339***

0. 0001 3. 7877

1.9165*

0. 0938 4.3120 Lag 3

1875-1931

Lag 3 1875-1931

Lag 7 1879-1931

Table 4.4 Results of Geweke Test for the Period of Gold Standard System in the UK Case

Ho : H±M Ho : M+H Ho : M+Q Ho:Q+M Ho : H±Q Ho : Q +H

F value Prob>F

X2 Lag. L ead

Period

13. 2081***

0.0007 9. 6248

1. 0026 0.3217 10.4993

28. 9326***

0.0001 1. 0759

0. 2457 0. 6224 8. 7768

17. 6747***

0. 0002 3. 4349

2. 9747*

0. 0932 6. 1201 Lag 3 Lead 1

1875-1931

Lag 3 Lead 1 1875-1931

Lag 7 Lead 1 1879-1931

First, as to the causal relationships between high-powered money and money supply, while the hypothesis that high-powered money does not cause money supply is rejected at the 1% significance level both by Granger test (F value =7.8845) and Geweke test (F value =13.2081), the hypothesis that money supply does not cause high-powered money is rejected neither by Granger test (F value=1.0958) nor by Geweke test (F value =1. 0026) even at the 10% significance level. Hence the unidirec- tional causality running from high-powered money to money supply is detected.

Next, as to the causal relationships between money supply and nominal GNP, the

hypothesis that money supply does not cause nominal GNP is rejected at the 1%

(14)

154=TIJ IJ ffiVol. XVIII, No. 3 significance level both by Granger test (F value=7.3111) and Geweke test (F value

=28.9326). On the other hand, the hypothesis that nominal GNP does not cause money supply is rejected at the 5% significance level by Granger test (F value

=4.0859) but not rejected even at the 10% significance level by Geweke test (F value 0.2457). Hence the bidirectional causality is detected. However the causality running from money supply to nominal GNP is stronger than the reversed causality with respect to the significance level.

Lastly, as to the causal relationships between high-powered money and nominal GNP, the hypothesis that high-powered money does not cause nominal GNP is rejected at the 1% significance level both by Granger test (F value=12.8339) and

Geweke test (F value=17.6747) and the hypothesis that nominal GNP does not cause high-powered money is rejected at the 10% significance level both by Granger test (F value =1.9165) and Geweke test (F value =2.9747). Hence the bidirectional causality

is detected. However, the causality running from high-powered money to nominal GNP is stronger than the reversed causality with respect to the significance level.

According to the Breusch-Godfrey test there is no autocorrelation over 4th order in residuals in any cases.

The lags which are determined by AIC are seven periods in the cases between high-powered money and nominal GNP and three periods in the other cases. There- fore the testsed periods of the former cases are 1879-1931 both in Granger test and Geweke test and the tested periods of the latter cases are 1875-1931 both in Granger test and Geweke test.

3) For the period of managed currency system, the results of causality tests in the UK case are as follows. (See Table 4.5, 4.6)

First, as to the causal relationships between high-powered money and money supply, the hypothesis that high-powered money does not cause money supply is Table 4. 5 Results of Granger Test for the Period of Managed Currency System in the

UK Case

F value Prob > F

x2 Lag Period

Ho: H+M 2.6197*

0. 0856 3.9520

Lag 1932—:

Ho : M-HH Ho 14.0126***

0.0001

:v1+ Q Ho: Q + Ho: H+Q Ho Q + H

. 9422 . 1570 . 6840

0.

0.

7.

6558 5246 7600

0.

0.

1.

0091 9245 8520

2.

0.

4.

9897 * 0913 8880

Lag 2 Lag 1

1932-1975 1932-1975

(15)

December 1988 /J\1* : Causality Tests Among Hinh-powered Money155

Table 4. 6 Results of Granger Test for the Period of Managed Currency System in the UK Case

Ho : H-1>M Ho : M-1->H Ho:M±Q Ho : CH->M Ho : H-I3-Q Ho:Q-1>H F value

Prob>F X2 Lag. Lead

Period

2.2496 0. 1424 1.6068

26. 1949***

0.0001 11. 6454

2. 1612 0. 1502 8. 5098

0. 8094 0.3743 5. 3703

0. 1396 0. 7108 14. 6289

0.8943 0. 3503 8. 0418 Lag.2 Lead 1

1932-1974

Lag 2 Lead 1 1932-1974

Lag 1 Lead 1 1932-1974

rejected at the 10% significance level by Granger test (F value=2 .6197) but not rejected even at the 10% significance level by Geweke test (F value =2 .2496). On the other hand, the hypothesis that money supply does not cause high-powered money is rejected at the 1% significance level both by Granger test (F value-14 .0126) and Geweke test (F value=26.1949). Hence the bidirectional causality is detected . How- ever, the causality running from money supply to high-powered money is stronger than the reversed causality with respect to the significance level .

Next, as to the causal relationships between money supply and nominal GNP , the independent relationship is detected both by Granger test and Geweke test .

Lastly, as to the causal relationships between high-powered money and nominal GNP, the hypothesis that high-powered money does not cause nominal GNP is rejected neither by Granger test (F value=0 .0091) nor by Geweke test (F value

=0 .1396) even at the 10% significance level . On the other hand, the hypothesis that nominal GNP does not cause high-powered money is rejected at the 10% signifi - cance level by Granger test (F value=2.9897) but not rejected even at the 10% signifi - cance level by Geweke test (F value=0 .8943). Hence the unidirectional causality running from nominal GNP to high-powered money is detected .

According to the Breusch-Godfrey test there is no autocorrelation over 4th order in residuals in any cases except Geweke test of causality running from high -powered money to nominal GNP.

The lags which are determined by AIC are one period in the cases between high - powered money and nominal GNP and two periods in the other cases .

The tested periods are 1932-1975 in Granger test and 1932-1974 in Geweke test . These results in the UK case are compactly depicted in Figure 4.

V. Summary

The summary of the results as presented in Sections III and IV above is as follows .

First, in the US case we find for the period of gold standard system that the

(16)

156

Figure 3. Results of the causality tests in the US Case

Vol. XVIII, No 3

the Whole Period H M M 7/

the Period Standard

of Gold System

H M M 7/

the Period of Currency

Managed System

H M

Notes.

Figure 4.

Q

Q

Q

H Q

H <--- Q

H Q

>> denotes that the null hypothesis is rejected both by Granger test and

Geweke test.

> denotes that the null hypothesis is rejected by one of them.

--- denotes that the independent relationship is detected.

---

denotes that null hypothesis is rejected at the 1% significance level.

--- denotes that the null hypothesis rejected at the 5% significance level.

---

> denotes that the null hypothesis is rejected at the 10% significance level.

Results of the causality tests in the UK Case

the Whole Period H M M Q H Q

the Period of Gold

H M M

Standard System /1 /I i

the Period Currency

of Managed System

ii

M M

H

Q

Q

H Q

H <---Q

causality is running from money supply to nominal GNP (M—Q) and for the period of managed currency system that it is running from high-powered money to money supply (H- *M). Therefore we find for the whole period that the causality is running from high-powered money to money supply and from money supply to nominal GNP

M—>Q) which is the causal relationship asserted by monetarism. In the UK

case we find for the period of gold standard system that the causality is running

from high-powered money to money supply and from money supply to nominal GNP

(17)

December 1988 : Causality Tests Among High-powered Money157

(H>M, M--,Q) which is the causal relationship asserted by monetarism, and we f ind for the period of managed currency system that the causality is running from money supply to high-powered money (M-4H). As for the relationship between high-powered

money and money supply, F values in the tests of causality running from money supply to high-powered money for the period of managed currency system (M —>H) are higher than those in the tests of causality running from high-powered money to money supply for the period of gold standard system (H>M) . Therefore we find for the whole period that the causality is running from money supply to high-powered money and from money supply to nominal GNP (M—H , M>Q).

Secondly, as to the relationships between high-powered money and money supply , it is the period of managed currency system in the US case and the period of gold standard system in the UK case when we have causality running from high-powered money to money supply which is asserted by monetarism . The US and the UK had the dominant position in the world economy for the period of managed currency system and for the period of gold standard system , respectively. This suggests that only a country in such a dominant position might be able to control its money supply by autonomously controlling its high-powered money . However, we can't be sure that such a suggestion holds true without examining into the details . So we will attempt at such an examination in the future.

Thirdly, for the cases in which we detect the causality running from money supply to high-powered money (the whole period in US case , the whole period and the period of managed currency system in UK case) , if the significance level is loosened to the 15% level (for the first and third cases) , we can have the causality running from money supply to nominal GNP and that running from nominal GNP

to high-powered money. Therefore the causality running from money supply to high-powered money, which is detected in this paper , might be explained by the composition of the two causalities, that is, the causality running from money supply to nominal GNP which is asserted by monetarism and that running from nominal GNP to high-powered money of which the most part consists of cash in circulation

, which shows the demand for cash by the public due to the transaction motive .

Lastly, in common to both the US and the UK cases we find the causality running

from money supply to nominal GNP which is asserted by monetarism for the whole

period and for the period of gold standard system, but we cannot find this causality

for the period of managed currency system . However, our tests do not cover the

most recent periods of the Reagan administration in the US and the Thatcher

(18)

158 1 ij Pi] 1 f1 VI' .g4Vol. XVIII, No. 3 government in the UK of which both are said to have adopted the policy of monetar-

ism. The causality tests for those periods are very interesting, so we will conduct them in near the future.

References

[ 1 ] Feige, E. L. and Mcgee, R., "Money Supply Control and Lagged Reserve Accounting,"

Journal of Money, Credit and Banking, Vol. 9, No. 4, November 1977.

[ 2 ] Friedman, M. and Schwartz, A. J., Monetary Trends in the United States and the United Kingdom, Chicago: University of Chicago Press, 1982.

[ 3 ] Geweke, J., Meese, R. and Dent, W., "Comparing Alternative Tests of Causality in Temporal Systems," Journal of Econometrics, Vol. 21, No. 2, February 1983.

[ 4 ] Goodhart, C. A. E., The Business of Banking 1891-1914, London: Weidenfeld and Nicol- son, 1972.

[ 5 ] Granger, C. W. J., "Investigatiog Causal Relations by Econometric Models and Cross- Spectral Methods," Econonaetrica, Vol. 37, No. 3, July 1969.

[ 6 ] Guilkey, D. K. and Salemi, M. K., "Small Sample Properties of Three Tests for Granger- Causal Ordering in a Bivariate Stochastic System," Review of Economics and Statistics,

Vol. 64, No. 4, November 1982.

[ 7 ] Johnston, J., Econometric Methods, 3rd ed., New York: McGraw-Hill, 1984.

[ 8 ] Kobayashi, K., "Causality Tests among High-powered Money, Money Supply and Bank Loan," (in Japanese) Soka Economic Studies Quarterly, Vol. 17, No. 1, June 1987a.

[ 9 ] Kobayashi, K., "Causality Tests among High-powered Money, Money Supply and Nominal GNP," (in Japanese) Saha Economic Studies Quartely, Vol. 17, No. 3, December

1987b.

[10] Meltzer, A. H., "Controlling Money," Review of Federal Reserve Bank of St. Louis., May 1969.

[11] Moore, B. J., "Unpacking the Post Keynesian Black Box: Bank Lending and the Money Supply," Journal of Post Keynesian Economics, Vol. 5, No. 4, Summer 1983.

[12] Nelson, C. R. and Schwert, W., "Tests for Predictive Relationships Between Time Series Variables: A Monte Carlo Investigation," Journal of the American Statistical

Association, Vol. 77, No. 377, March 1982.

[13] Sims C. A., "Money, Income, and Causality," American Economic Review, Vol. 62, No. 4, September 1972.

[14] Williams, D. Goodhart. C. A. E. and Gowland, D. H., "Money, Income, and Causality:

The U. K. Experience," American Economic Review, Vol. 66, No. 3, June 1976.

[15] Yamamoto, T., Time Series Analysis in Economics, (in Japanese) Tokyo: Sobunsha Publishing Company, 1988.

(EL' ANF5EliiiJj-)

Figure  1. High-powered  money,  Money  Supply  and  (Annual  Rate  of  Change)
Table  3.2  Results  of  Gew eke  Test  for the
Table  4. 1  Results  of  Granger  Test  for  the  Whole Period  in  the  UK Case
Figure  3. Results of  the  causality  tests  in  the  US  Case

参照

関連したドキュメント

[r]

[r]

Effects of  Ketamine and Pr opofol on the Ratio of  Inter leukin-6 to Inter leukin-10

Found in the diatomite of Tochibori Nigata, Ureshino Saga, Hirazawa Miyagi, Kanou and Ooike Nagano, and in the mudstone of NakamuraIrizawa Yamanashi, Kawabe Nagano.. cal with

[Publications] Taniguchi, K., Yonemura, Y., Nojima, N., Hirono, Y., Fushida, S., Fujimura, T., Miwa, K., Endo, Y., Yamamoto, H., Watanabe, H.: &#34;The relation between the

     ー コネクテッド・ドライブ・サービス      ー Apple CarPlay プレパレーション * 2 BMW サービス・インクルーシブ・プラス(

のようにすべきだと考えていますか。 やっと開通します。長野、太田地区方面  

5) Uemura O, Nagai T, Ishikura K, Ito S, Hataya H, Gotoh Y, Fujita N, Akioka Y, Kaneko T, Honda M: Creatinine-based equation to esti- mate the glomerular filtration rate in