• 検索結果がありません。

福島県立医科大学 学術機関リポジトリ

N/A
N/A
Protected

Academic year: 2021

シェア "福島県立医科大学 学術機関リポジトリ"

Copied!
7
0
0

読み込み中.... (全文を見る)

全文

(1)

Fukushima Medical University

福島県立医科大学 学術機関リポジトリ

This document is downloaded at: 2021-11-08T00:36:50Z

Title The usefulness of combined assessment of E/E' ratio and transmitral flow pattern to interpret cardiac condition

Author(s) Oikawa, Masayoshi; Kobayashi, Atsushi; Sato, Takamasa;

Suzuki, Satoshi; Yoshihisa, Akiomi; Nakazato, Kazuhiko;

Suzuki, Hitoshi; Saitoh, Shu-Ichi; Takeishi, Yasuchika Citation Fukushima Journal of Medical Science. 63(1): 16-21

Issue Date 2017

URL http://ir.fmu.ac.jp/dspace/handle/123456789/575

Rights © 2017 The Fukushima Society of Medical Science

DOI 10.5387/fms.2016-9

Text Version publisher

(2)

[Original Article]

The usefulness of combined assessment of E/E′ ratio and transmitral flow pattern to interpret cardiac condition

Masayoshi Oikawa, Atsushi Kobayashi, Takamasa Sato, Satoshi Suzuki, Akiomi Yoshihisa, Kazuhiko Nakazato, Hitoshi Suzuki, Shu

-

ichi Saitoh and Yasuchika Takeishi

Department of Cardiovascular Medicine, Fukushima Medical University, 1 Hikarigaoka, Fukushima, 960

-

1295, Japan

(Received July 28, 2016, accepted February 6, 2017) Abstract

Background : High mitral inflow early (E) velocity to tissue Doppler E′ ratio (E/E′) and an E to late diastolic filling velocity ratio (E/A) are used to evaluate left ventricular (LV) diastolic function and filling pressure, but the usefulness of combined assessment of E/E′ and E/A is not fully understood. 

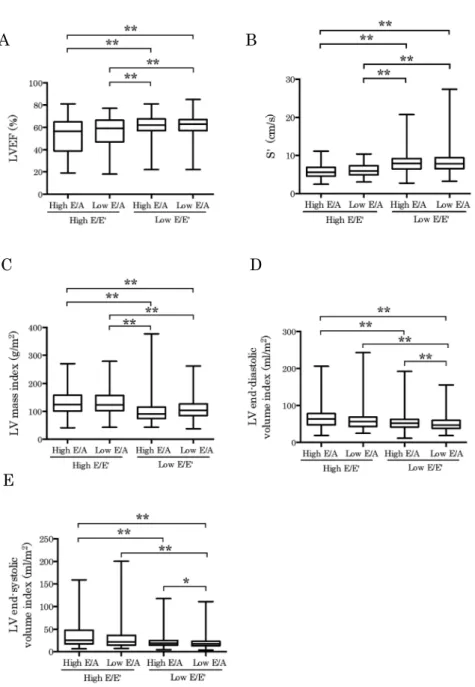
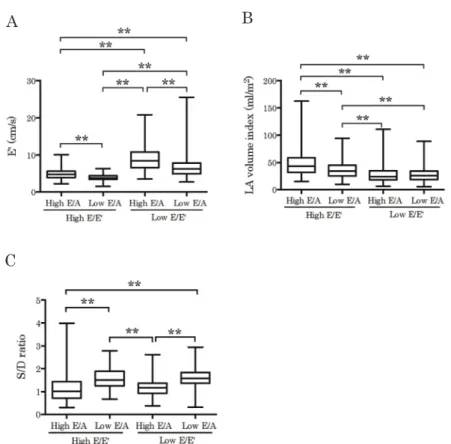
Methods : We retrospectively analyzed 1,266 patients who underwent echocardiography to assess cardiac function. Patients were grouped based on the values of E/E′ (low E/E′<15, high E/E′≥15) and E/A (low E/A≤0.8, high E/A>0.8).   Results : High E/E′ with both high and low E/A groups showed lower LV ejection fraction and higher LV mass index compared to low E/E′ with both high and low E/A groups. High E/E′ with both high and low E/A groups showed slower E′ velocity and larger left atrial volume index compared to low E/E′ with both high and low E/A groups, but high E/

E′ with low E/A group exhibited smaller left atrial volume index and higher pulmonary venous sys- tolic to diastolic peak velocity ratio compared to high E/E′ with high E/A group. Moreover, high E/

E′ with low E/A group displayed lower tricuspid regurgitant pressure gradient than the high E/E′

with high E/A group. Conclusion : Even in the situation of high E/E′, low E/A condition indicated lower LV filling pressure and controlled fluid retention.

Key words : Diastolic function, Tissue Doppler echocardiography, Cardiac remodeling, Cardiac hy- pertrophy

Introduction

The elevation of left ventricular (LV) filling pressure is a fundamental feature of worsening of chronic heart failure.   LV filling pressure is deter- mined by several factors, including left atrial (LA) pressure, LV stiffness, and LV compliance.   Mitral inflow early (E) velocity to tissue Doppler E′ ratio (E/E′) are widely used to estimate LV filling pressure.   Highly elevated E/E′ is implicated as in- creased LV filling pressure, but it is not always con- sistent with the severity of heart failure [1].   Trans- mitral E and late diastolic filling velocity ratio (E/A) can be measured simply to assess LV diastolic function.   Low E/A, impaired relaxation pattern, is related to aging and usually observed in elderly pa-

tients with normal LA pressure [2, 3].   Increased LA pressure drives the increase in E velocity, and changes the transmitral inflow pattern into pseudo- normal or restrictive filling pattern [2].   Both E/E′

and E/A are useful parameters, but we often encoun- ter a confusable situation, such as increased E/E′ but low E/A profile.   Thus, we attempt to evaluate the usefulness of combined assessment of E/E′ and E/A, especially in the patients with high E/E′.

Materials and methods

Patients

We enrolled 1,266 patients who underwent transthoracic echocardiography to assess cardiac Corresponding author : Masayoshi Oikawa, M.D., Ph. D. E

-

mail : [email protected]

https://www.jstage.jst.go.jp/browse/fms http://www.fmu.ac.jp/home/lib/F

-

igaku/

16

(3)

Combined assessment of E/E′ and E/A 17

function in our hospital from January 2013 to De- cember 2014 in this study.   The patients who had a history of mitral valve surgery, severe valvular heart disease, acute coronary syndrome, persistent atrial fibrillation, and a poor image data were excluded.  

In order to calculate tricuspid regurgitation (TR) pressure gradient, the patients without TR were excluded.   The study protocol was approved by the institutional ethics committee.

Echocardiography protocol

Transthoracic echocardiography was performed using 1 of 3 commercially available systems (Artida, Toshiba Medical Systems Co., Ltd., Tochigi, Japan ; SC2000, Siemens Medical Solutions, Mountain View, CA, USA ; iE33, Philips Medical Systems, Bothell, WA, USA).   The analysis was performed by one ex- perienced sonographer or cardiologist, and echo re- port was checked by another independent echo

-

cardiologist.   Interventricular septal thickness (IVST) and LV posterior wall thickness (LVPWT) were measured using B

-

mode echocardiography.  

The LV mass was calculated using the following for- mula [4] : LV mass=0.8×(1.04((LV diastolic diameter+IVST+LVPWT)

3

-(LV diastolic dea- meter)

3

))+0.6 g.   The LV mass index was calculat- ed by dividing the LV mass by the body surface area.  

LV hypertrophy (LVH) was determined if the LV mass index was more than 95 g/m

2

in female and 115 g/m

2

in male.   LA volume index, LV end

-

diastolic and end

-

systolic volume index, and LV ejection frac- tion (LVEF) were calculated using the single plane area length method.   Transmitral E/A, and peak systolic (S′) and E′ of the septal mitral annulus were

measured.   Pulmonary venous flow pattern of sys- tolic to diastolic (S/D) ratio was measured when im- age quality was adequate (n=606).   TR pressure gradient was calculated by the simplified Bernoulli equation.   Inferior vena cava (IVC) diameter was measured at end

-

expiration.

Statistics

Data are expressed as median with interquartile ranges.   Mann

-

Whitney test was used for unequal distribution.   Kruskal

-

Wallis test and post

-

hoc Dunn’s test was conducted for multiple comparisons.  

The P values less than 0.05 were considered to be significant.   All statistical analyses were performed using GraphPad Prism 6 (GraphPad Software, Inc., La Jolla, CA, USA)

Results

Patient characteristics were displayed in Table 1. Patients were divided into 4 groups based on the values of E/E′ (low E/E′<15, high E/E′≥15) and E/A (low E/A≤0.8, high E/A>0.8).   The subjects who displayed low E/E′ with high E/A exhibited more than ten years younger age compared to the other groups, indicating that this group primarily contained patients with normal LV filling pattern.   Chi

-

square test revealed that the proportion of other clinical characteristics were also difference among four groups (data not shown).   When we rearranged the groups as high E/E′ and low E/E′ group regardless of E/A value, high E/E′ group showed higher percent- age in all characteristics.   As shown in Fig. 1, high E/E′ with both high and low E/A groups showed

Table 1.   Patient characteristic

High E/E′ Low E/E′

P value High E/A

(n=136) Low E/A

(n=95) Low E/A

(n=584) High E/A

(n=451)

Age, years 69 [61

-

76] 76 [68

-

82]** 72 [64

-

78]

57 [43

-

68]**

††‡‡

<0.01

Male, n (%) 70 (51) 36 (38) 344 (59) 241 (53) <0.01

Left ventricular hypertrophy, n (%) 99 (73) 71 (75) 268 (46) 144 (32) <0.01 Valvular heart disease

  Aortic stenosis, n (%) 11 (8) 12 (13) 23 (4)   8 (2) <0.01

  Aortic regurgitation, n (%) 48 (35) 33 (35) 197 (34) 84 (19) <0.01

  Mitral stenosis, n (%) 4 (3) 1 (1)   1 (0)   1 (0) <0.01

  Mitral regurgitation, n (%) 99 (73) 42 (44) 232 (40) 176 (39) <0.01 Old myocardial infarction, n (%) 25 (18) 11 (12) 65 (11) 42 (9) <0.05

Hypertrophic cardiomyopathy, n (%) 6 (4) 3 (3)   8 (1)   4 (1) <0.05

Dilated cardiomyopathy, n (%) 8 (6) 3 (3) 12 (2) 11 (2) <0.01

Age is expressed as median with interquartile ranges.   **P < 0.01 vs. high E/E′ with high E/A group.  

P< 0.05,

††

P < 0.01 vs. high E/E′ with low E/A group.  

‡‡

P < 0.01 vs. low E/E′ with low E/A group.

(4)

lower LVEF (Figure 1A), slower S′ velocity (Figure 1B), and higher LV mass index (Figure 1C) com- pared to low E/E′ with both high and low E/A groups, suggesting that high E/E′ condition was associated with LV systolic dysfunction and hypertrophy.   High E/E′ with high E/A group also showed larger LV end

-

diastolic and end

-

systolic volume index com- pared to the low E/E′ with both high and low E/A group.   However, high E/E′ with low E/A group showed larger LV volume only against low E/E′ with low E/A group, indicating that high E/E′ with high E/

A group might contain more advanced LV remodeled patients (Figure 1D and 1E). Regarding to LV dias- tolic function, high E/E′ with both high and low E/A groups showed slower E′ velocity and larger LA vol-

ume index compared to low E/E′ with both high and low E/A groups, indicating that high E/E′ groups ex- hibited more impaired diastolic function than low E/

E′ groups (Fig. 2A and 2B).   Although E′ velocity was slower, high E/E′ with low E/A group exhibited smaller LA volume index compared to high E/E′

with high E/A group (Fig. 2A and 2B).   Moreover, high E/E′ with low E/A group showed higher S/D ra- tio compared to high E/E′ with high E/A group, sug- gesting that low E/A condition indicated lower LV filling pressure even in the situation of high E/E′

condition (Fig. 2C).   Conversely, low E/E′ with high E/A group showed faster E′ velocity and lower S/D ratio compared to low E/E′ with low E/A group, indi- cating that low E/E′ with high E/A group showed

A B

E

C D

Fig. 1.   Assessment of left ventricular systolic function and remodeling.   **P < 0.01, *P<0.05.

(5)

Combined assessment of E/E′ and E/A 19

better LV diastolic function compared to low E/E′

with low E/A group (Fig. 2A and 2C). In right heart function, right ventricular fractional area change was similar among four groups (Fig. 3A).   The high E/E′

with low E/A group displayed lower TR pressure gradient and smaller IVC diameter than the high E/

E′ with high E/A group, but similar to the low E/E′

groups (Fig. 3B and 3C).   These results indicated C

A B

Fig. 2.   Assessment of left ventricular diastolic function and left atrial remodeling.   **P < 0.01.

A

C

B

Fig. 3.   Assessment of right heart function.   **P < 0.01, *P<0.05.

(6)

that fluid retention was well controlled in high E/E′

with low E/A group.

Discussions

In the present study, we displayed high E/E′

with high E/A condition reflected cardiac remodeling and systolic dysfunction.   Even in the situation of high E/E′, low E/A condition indicated lower LV fill- ing pressure and controlled fluid retention.

High E/E′ is formed by a combination of in- creased E velocity and decreased E′ velocity.   E ve- locity reflects the difference between LA and LV pressure in diastolic phase.   Increased E velocity raises the two possibilities, either normal decrease of LV diastolic pressure or anomalous increased LA pressure.   Because the difficulty in the distinction between them from only the levels of E velocity, other parameters are required for the assessment of LV filling pressure.   E′ velocity assessed by a tissue Doppler method is well negatively correlated with tau, which is an established index of LV diastolic function measured from cardiac catheter data [5], and combined assessment of E velocity, E′ velocity, and E/E′ ratio, is recognized as useful for the predic- tion of LV filling pressure [6].   In the present study, however, high E/E′ with low E/A group showed smaller LA volume index, higher S/D ratio, and low- er TR pressure gradient than high E/E′ with high E/

A group, suggesting that preferable hemodynamics were maintained in low E/A condition even in the situation of high E/E′.   Several reports revealed that increased E/E′ did not well correlate with in- creased elevating LV filling pressure in normal sub- jects, mitral annular calcification, severe mitral valve disease [2], hypertrophic cardiomyopathy [7], and heart failure with preserved EF [8], indicating that only E/E′ assessment is not sufficient in various clinical settings.   In the present study, our results suggested that E/A pattern is able to classify the se- verity even in the condition of high E/E′.   Consid- ering the facts that restrictive filling pattern is a strong predictor of worsening of heart failure [9

-

11], it is conceivable that combined assessment of E/E′

and E/A is a reasonable approach to predict LV filling pressure and cardiac prognosis.

In clinical settings, noninvasive approach to es- timate LV filling pressure is desired especially in the situation of suspected heart failure.   Based on this study, elevated E/E′ but low E/A condition may indi- cate compensated stage of heart failure. Therefore, we should analyze both E/E′ and E/A for appropriate interpretation to treat those patients.

Limitations

There were several limitations in this study.  

First, this study was performed by assessment of only echocardiographic data.   We should confirm the correlations with intracardiac pressures in the future study.   Second, the groups showing high E/A condition might include heterogeneous population, such as normal, pseudonormal, or restrictive filling pattern patients.   Thus the data might be affected by this heterogeneity.   Third, the other data pre- senting the severity of heart failure, such as neuro- hormonal activation, cardiopulmonary exercise test, or cardiac magnetic resonance imaging, were not evaluated in this study.   Further study is needed to perform more precise assessment.

Conclusions

High E/E′ with high E/A condition reflected car- diac remodeling and systolic dysfunction. Even in the situation of high E/E′, low E/A condition indicat- ed lower LV filling pressure and controlled fluid re- tention.

Conflict of interest

Masayoshi Oikawa, Atsushi Kobayashi, Taka- masa Sato, Satoshi Suzuki, Akiomi Yoshihisa, Ka- zuhiko Nakazato, Hitoshi Suzuki, Shu

-

ichi Saitoh, and Yasuchika Takeishi declare that they have no conflict of interest.

References

1. Mullens W, Borowski AG, Curtin RJ, et al. Tissue Doppler imaging in the estimation of intracardiac filling pressure in decompensated patients with ad- vanced systolic heart failure. Circulation, 119 : 62

-

70, 2009.

2. Nagueh SF, Smiseth OA, Appleton CP, et al. Rec- ommendations for the evaluation of left ventricular diastolic function by echocardiography : An update from the American Society of Echocardiography and the European Association of Cardiovascular Imaging. J Am Soc Echocardiogr, 29 : 277

-

314, 2016.

3. Schirmer H, Lunde P, Rasmussen K.   Mitral flow derived Doppler indices of left ventricular diastolic function in a general population ; the Tromso study. Eur Heart J, 21 : 1376

-

1386, 2000.

4. Lang RM, Badano LP, Mor

-

Avi V, et al. Recom-

mendations for cardiac chamber quantification by

echocardiography in adults : An update from the

(7)

Combined assessment of E/E′ and E/A 21

American Society of Echocardiography and the Eu- ropean Association of Cardiovascular Imaging. J Am Soc Echocardiogr, 28 : 1

-

39, 2015.

5. Weiss JL, Frederiksen JW, Weisfeldt ML. Hemo- dynamic determinants of the time

-

course of fall in canine left ventricular pressure. J Clin Invest, 58 : 751

-

760, 1976.

6. Ommen SR, Nishimura RA, Appleton CP, et al. 

Clinical utility of Doppler echocardiography and tissue Doppler imaging in the estimation of left ventricular filling pressures : A comparative si- multaneous Doppler

-

catheterization study. Cir- culation, 102 : 1788

-

1794, 2000.

7. Geske JB, Sorajja P, Nishimura RA, et al. Evalua- tion of left ventricular filling pressures by Doppler echocardiography in patients with hypertrophic cardiomyopathy : correlation with direct left atrial pressure measurement at cardiac catheterization. 

Circulation, 116 : 2702

-

2708, 2007.

8. Sharifov OF, Schiros CG, Aban I, et al. Diagnostic accuracy of tissue Doppler index E/e′ for evaluat-

ing left ventricular filling pressure and diastolic dysfunction/heart failure with preserved ejection fraction : A systematic review and meta

-

analysis. 

J Am Heart Assoc, 5 : e002530, 2016.

9. Pinamonti B, Zecchin M, Di Lenarda A, et al. Per- sistence of restrictive left ventricular filling pattern in dilated cardiomyopathy : an ominous prognostic sign. J Am Coll Cardiol, 29 : 604

-

612, 1997.

10. Somaratne JB, Whalley GA, Gamble GD, et al. 

Restrictive filling pattern is a powerful predictor of heart failure events postacute myocardial infarction and in established heart failure : a literature

-

based meta

-

analysis. J Card Fail, 13 : 346

-

352, 2007.

11. Dokainish H, Rajaram M, Prabhakaran D, et al. 

Incremental value of left ventricular systolic and

diastolic function to determine outcome in patients

with acute ST

-

segment elevation myocardial

infarction : the echocardiographic substudy of the

OASIS

-

6 trial. Echocardiography, 31 : 569

-

578,

2014.

Table 1.   Patient characteristic
Fig. 1.   Assessment of left ventricular systolic function and remodeling.   **P &lt; 0.01, *P&lt;0.05.
Fig. 2.   Assessment of left ventricular diastolic function and left atrial remodeling

参照

関連したドキュメント

In order to observe generalized projective synchronization between two identical hyper- chaotic Lorenz systems, we assume that the drive system with four state variables denoted by

approah, whih is based on a step by step onstrution of the walks [6, 5℄.. We repeat in Setion 3 the proof

Q is contained in the graph of a

Should Buyer purchase or use SCILLC products for any such unintended or unauthorized application, Buyer shall indemnify and hold SCILLC and its officers, employees,

Should Buyer purchase or use SCILLC products for any such unintended or unauthorized application, Buyer shall indemnify and hold SCILLC and its officers, employees,

自動車や鉄道などの運輸機関は、大都市東京の

Optimal control will be attained when weeds are treated in the seedling stage (less than 4 leaf stage,.. to the list of established grasses that are tolerant to MOXY 2E.

Apply CLETHODIM 2E at the high rate recommended for annual grasses (16 fl. per acre) when the grass height is at the low end of the range (application to larger grasses may not