ABSTRACT
The present article reports a pilot study which investigated the effects of pronunciation training on improvement of the ability to differentiate stressed and unstressed syllables in content and function words. Specifically it attempted to examine how the ability to utilize the acoustic properties (i.e., duration, pitch, in-tensity, vowel quality) to indicate stress. Three adult learners of English at a university received individual-based, long-term (i.e., approximately 11 months) pronunciation training focused on word/sentence stress and segments (conso-nants and vowels). The acoustic correlates of the rhythmic patterns of the sen-tences were analyzed across the diagnostic tests conducted throughout the train-ing. The study also explored the use of the two rhythm indices, the normalized pairwise variability index (nPVI) and the variation coefficient (Varco) as mea-surements of the degree of variability in duration, pitch and intensity. The re-sults showed that, on average, the rhythmic patterns of the sentence, as well as the rhythm indices, more or less became similar to those observed for native speakers of English in each of the acoustic properties. It was found, however, that the degree of improvement and the level of achievement was lower for du-ration and vowel quality than pitch and intensity, indicating that the participants had more difficulty modifying the use of these acoustic properties through the training. There was also some individual variability in the relative degree and timing of improvement among the acoustic properties. Implications for teaching pronunciation are discussed.
key words; pronunciation training, speech rhythm, duration, pitch, intensity, stress, re-duced vowels, rhythm indices
ing on improvement of the ability to differentiate stressed
and unstressed syllables in content and function words.
1. Introduction
Previous research has demonstrated that the initial, language-universal phonetic (perceptual and productive) abilities become attuned to the phonetic/phonological
prop-erties of an ambient language during the first language (L1) acquisition (e.g., Best, 1995). The phonological properties of L1 often adversely influence perception and production of the second language (L2) at the segmental as well as prosodic level, leading to mispercep-tion of nonnative sounds and detectable foreign accents (e.g., Flege, Munro, & MacKay, 1995). It has been demonstrated, however, that the nonnative phonetic abilities can be modified to approximate those of native speakers to varying degrees through formal in-struction and speech training (e.g., Bohn & Munro, 2007). The present study examined how Japanese adult learners of English can modify the ability to produce rhythmic prop-erties of English through long-term, individual-based pronunciation training.
Early research on the typology of speech rhythm attempted to categorize world lan-guages into two distinct categories (Abercrombie, 1967). English was categorized as a stress-timed language where the interval of the adjacent stressed syllables (i.e., inter-stress interval) was equal. On the other hand, Japanese was categorized as a mora-timed language where the duration of every mora was equal, while Spanish, French as syllable-timed languages where the duration of every syllable was equal. The following research, however, failed to find acoustic evidence for the isochrony of elements such as interstress intervals (Dauer, 1983) and syllables (Roach, 1982).
To account for the impressionistic differences in speech rhythm, however, several rhythm indices have been proposed. The first set of indices quantify the degree of dura-tional variability and proportions of speech segments (e.g., vowels, consonants, syllables) over entire speech samples. Using sentences read by native speakers of several languages with different rhythm categories, for example, Ramus, Nespor & Mehler (1999) measured three rhythm indices; 1) the proportion of vocalic intervals within each sentence (%V), 2) the standard deviation of the duration of vocalic intervals within each sentence (⊿V), and 3) the standard deviation of the duration of consonant intervals within each sentence (⊿C). The higher ⊿C and lower %V in stress-timed languages were interpreted as
re-flecting a greater variety of syllables types such as consonant clusters at the beginning and end of syllables. Reflecting a simple syllable structure (i.e., mostly CV), Japanese was high in %V and low in ⊿C. The ⊿V was intermediate among the languages because
Jap-anese has contrastive vowel length (i.e., the long-short vowel distinction).
The second set of indices quantify the degree of durational variability in adjacent speech segments (e.g., vowels, consonants and syllables). Grabe and Low (2002), for ex-ample, presented a rhythm index called a normalized pairwise variability index (nPVI), which is based on a sum of the absolute difference in duration between each pair of suc-cessive segments divided by the mean duration of each pair. The study analyzed 18 lan-guages with different rhythm categories, including British English and Japanese. The re-sults showed that stress-timed languages (e.g., British English, Dutch and German) had higher values of vocalic nPVI than syllable-timed languages (e.g., French, Spanish) and mora-timed languages (e.g., Japanese). The higher values of vocalic nPVI were interpret-ed as primarily reflecting the presence of full vowels and shorteninterpret-ed/spectrally rinterpret-educinterpret-ed vowels in stress-timed languages. These results on the rhythm indices suggest that Eng-lish and Japanese are rhythmically quite distinct from each other.
The rhythm indices, however, have been criticized as indicators of rhythm acquisition in L2 learning (Barry, Andreeva, & Koreman, 2009; Gut, 2012; Li & Post, 2014; Turk & Shattuck-Hufnagel, 2013). First of all, the values of the indices do not specify how the pho-nological or prosodic properties involved in the rhythmic pattern contribute to the ob-served changes in learners’ rhythm production. On this point, Gut (2012) states, “…phono-logical characteristics of L2 speech that have been interpreted as rhythmic properties can be easily explained and described with reference to other phonological processes such as consonant cluster reduction and vowel reduction processes. It appears that what has been termed ‘rhythm’ and what is measured by the quantitative rhythm indices in the speech of L2 learners are just the phonetic by-products of these phonological processes (p. 91).” Second, since the rhythm indices are solely based on durational measurements, the other important acoustic correlates of speech rhythm (e.g., fundamental frequency (f0 hence-forth), intensity) might be missed in the analyses. Especially, for L2 learners whose L1 predominantly uses pitch at a lexical and prosodic level (e.g., Chinese, Japanese), it ap-pears important to include f0 as an important correlate of speech rhythm in L2.
Third, research on L2 learning of rhythm has provided mixed results as to the chang-es of the valuchang-es of rhythm indicchang-es during L2 acquisition. There is some evidence to indi-cate that the values of some rhythm indices change to converge on those of native speak-ers of the target language as L2 learnspeak-ers’ proficiency increases (Gut, 2009; Li & Post, 2014; Ordin & Polyanskaya, 2014; White & Mattys, 2007). Li & Post (2014), for example, examined the effects of L1 background (i.e., German and Mandarin Chinese) and
profi-ciency levels on several rhythm indices (e.g., %V, VarcoV, VarcoC and nPVI-V) using a set of English sentences read by the L2 leaners. It was found that vocalic variability (VarcoV and nPVI-V) significantly increased with the proficiency levels to approximate the values of native speakers of English regardless of the L1 background. In contrast, some research has found non-significant changes in the values of rhythm indices after a long-term pronunciation training or study-abroad programs (Dellwo, Diez, & Gavalda, 2009; Guilbault, 2002).
In the light of the criticisms described above, the present study attempted to inter-pret the observed changes in the values of rhythm indices in L2 learning by examining how the changes related to local phonological properties and processes (e.g., lexical stress, vowel reduction). It also examined how relevant acoustic properties (i.e., duration, f0, am-plitude and vowel formants) were utilized by L2 learners and how the use of them changed during L2 learning.
As suggested by the differential values of some rhythm indices described above, Eng-lish and Japanese have some phonological properties and processes that give rise to dis-tinct speech rhythms. They also differ in the use of acoustic properties that implement the processes. First, syllable structures are fairly simple in Japanese with predominantly a succession of a consonant and a vowel (i.e., a CV sequence). Consonant clusters occur only in a very limited phonotactic structure (i.e., a sequence of a nasal or approximant and another consonant). On the other hand, English permits a wide range of syllable structures, with consonant clusters both in onset and coda positions (e.g., “strands”). Sec-ond, the acoustic correlates of lexical stress/accent are different in two languages in pro-duction as well as in perception. In propro-duction, only F0 is significantly correlated with lex-ical accent in Japanese (i.e., a pitch accent language), while f0, intensity as well as duration are correlated with lexical stress in English (Beckman, 1986). Finally, English only has re-duced vowels in unaccented syllables, which are short in duration, low in pitch and inten-sity, and more centralized in vowel quality. They occur not just in unaccented syllables of lexical items but also of function words such as prepositions and determiners.
Previous research has indicated that the phonological properties and processes that differentiate English and Japanese just described above combine to influence the acoustic correlates of English rhythm produced by Japanese learners. First of all, duration of Eng-lish syllables produced by Japanese learners is less variable than that of native speakers (Bond & Fokes, 1985; Mochizuki-Sudo & Kiritani, 1991). Second, Japanese speakers tend to utilize pitch difference rather than duration to mark sentence stress as well as lexical
stress (Aoyama & Guion, 2007; Tsushima, 2015). Third, the vowel quality of unstressed syllables (i.e., schwa) produced by Japanese speakers is less centralized than that of na-tive speakers (Y. Kondo, 2000). Finally, duration of function words produced by Japanese speakers is longer than that of native speakers (Aoyama & Guion, 2007).
In line with the previous research, Mori, Hori, & Erickson (2014) systematically in-vestigated the use of pitch, intensity, duration and vowel quality (maximum f1) by adult Japanese learners of English, as compared with that of native speakers of English. The speakers read an English sentence where monosyllabic content and function words alter-nated (i.e., Pam had a chance to chat and nap). The results found that the Japanese speak-ers utilized pitch and intensity as relatively reliable acoustic cues to the alternating rhythm patterns, while vowel duration was much less utilized. For the native speakers, duration was the most reliable acoustic cue even though all the other cues were utilized as well. Regarding vowel reduction, vowels of function words (“a”, “to”, “and”) were spec-trally reduced for the native speakers, but they were much less reduced for the Japanese speakers. It was also found that rate-normalized variability of vowel durations (VarcoV) was significantly lower for the Japanese speakers (.24) than for the native speakers of English (.53). These results indicated that Japanese learners of English had difficulty con-trolling duration to differentiate stressed and unstressed syllables in content and function words, as well as modifying vowel quality for reduced vowels.
Tsushima (2015) extended the previous research by investigating whether and how the rhythmic properties of English spoken by Japanese learners of English can be modi-fied to approximate those of native speakers of English through long-term, individual-based pronunciation training. In a case study where two university students participated, the study specifically examined how each participant learned to use pitch, intensity, dura-tion and vowel quality to differentiate accented and unaccented syllables of lexical items (e.g., factor) in the reading task. The results, however, showed that the degree of
im-provement in the use of f0 and intensity was much greater than that of duration and vowel quality. It was indicated that modification of duration and vowel quality poses par-ticular difficulty for Japanese learners of English as far as lexical stress was concerned. The current study extended this line of research by examining how the learners’ use of the acoustic properties of English rhythm changed at a sentence level over the course of pronunciation training. The rationale of the study was the following. First, the sentence chosen for the analyses (age is an important factor in learning to pronounce) included a succession of stressed and unstressed syllables with multisyllabic content words (e.g.,
fac-tor) and function words (e.g., is, an, in, to), which had an alternating rhythmic pattern. It is part of a reading text used in diagnostic tests of the training. Second, following the pre-vious research (Mori et al., 2014; Tsushima, 2015), the acoustic properties analyzed for the study included pitch, intensity, duration and vowel quality, which have been found to be important acoustic correlates of English rhythm not just for native speakers of English but also for L2 learners. Third, the present study used two rhythm indices. One was a lo-cal variability index on pairwise variability of adjacent syllables/vowels (n-PVI) in dura-tion, pitch and intensity. The other was a global variability index on variability of sylla-bles/vowels over the whole sentence (Varco) in the acoustic properties (see below for details of these indices). Finally, the data were obtained as part of a case study where a small number of individuals were trained over a relatively long period of time. Although the averaged data over JS and NS are to be presented, the focus of the analyses is indi-vidual-based changes over the course of the training. Although the results may not be generalizable to other populations, they may serve as pilot data for a larger study con-ducted in future.
Specific research questions asked in the present study were the following.
1)Did the ability of the Japanese participants to control duration, pitch, intensity and vowel quality to differentiate stressed and unstressed syllables in content and function words improve through individual-based, long-term pronunciation training? If yes, how did the improvement occur for each of the acoustic properties?
2)Did the pairwise variability (nPVI) and the variation coefficients (Varco) in each of the acoustic properties increase during training? If yes, how did the improvement oc-cur for each of the acoustic properties?
3)How were the changes in the use of the acoustic properties related to the changes in the values of nPVI and Varco?
2. Method 2―1. Participants
The Japanese speakers (called JS henceforth) were three university students (juniors at the time of their participation) at a private university in Tokyo. The first
par-ticipant (called J1 henceforth) was a 20-year-old female, the second, a 21-year-old male (called J2 henceforth) and the third, a 23-year-old female (called J3 henceforth). They were recruited by the author from a pool of his students in an advanced English course.
The proficiency level of their English could be categorized as intermediate based on their TOEIC scores. All of them were able to produce English utterances using basic sentence structures, but generally had difficulty using relatively complex sentence structures when speaking spontaneously. They made occasional grammatical mistakes, and had to put long pauses in the middle of sentences. They were highly motivated to improve their pronun-ciation and the ability to speak English.
Three male native speakers of English (all instructors of English in Japan) participat-ed in the present study. One acquirparticipat-ed English as the most prparticipat-edominantly usparticipat-ed language in England (N1), and the other two in USA (N2 and N3). As the data of a female speak-er, a sample recording of the reading passage included in the CD of the textbook was used. The speaker is an adult female native speaker of English (N4). The native speakers of English are called NS henceforth.
2―2. Diagnostic Tests
The first part of the diagnostic test was a reading task in which the target sentence of the present analyses was produced. This was followed by a storytelling task, a short talk and conversation. In the reading task, the speakers were asked to read a passage (see Appendix) taken from a book on pronunciation teaching, Teaching Pronunciation (Celce-Murcia, Brinton, & Goodwin, 2010, Appendix 16, p. 481). They were allowed to practice reading the passage aloud for a few minutes before they made a recording. The recording was done in a quiet, but non-sound-proofed research room of the author. Their utterances were recorded at a resolution of 16 bits with a sampling rate of 44.1 Hz by a PCM record-er through a high-quality microphone placed approximately 20 cm from the mouth of the speaker. The recorded sounds were low-pass filtered at 10,000 Hz, normalized and an-alyzed by sound analysis software, Praat (Boersma & Weenink, 2014). For J1 and J2, sev-en diagnostic tests were conducted during 45.5 weeks of training. The average interval of the tests was 7.6 weeks. For J3, five diagnostic tests were conducted during 46 weeks of training. The average interval of the test was 9.2 weeks.
The recording procedure, equipment and the location of the recording for NS were the same as those of JS, except that they were asked to read the passage at a normal rate and a slower rate to control for the speaking rate. The latter sets of recorded data were used for analyses as the speaking rates better matched those of JS.
2―3. Description of Training
Pronunciation training was conducted face-to-face with the author in his office. One training session lasted approximately for 90 minutes for J1 and J3 and for 45 minutes for J2. Altogether, 43 sessions were held for J1, 36 for J2, and 40 for J3. The interval of the session was basically one week, except for a part of the summer break and the winter break.
The training was aimed at developing the ability to produce English utterances with an accepted level of intelligibility and comprehensibility in spontaneous speech. The struc-ture of the training was based on “cognitive approach” to teaching pronunciation (Fraser, 2001, 2006), where knowledge about a target structure was first introduced to the learn-ers, followed by pronunciation practice using a variety of activities that included a listen-ing task (e.g., discrimination, dictation), a repeatlisten-ing task and a readlisten-ing task (e.g., a dia-logue, a passage). During the session, the speakers’ productions were recorded and immediately played back to them so that they were able to monitor and evaluate their own productions. They were also given feedback from the author about how to modify their pronunciation.
For all JS, the focus of the overall training was on how to produce English stress at a lexical level and then at a sentence level. A pronunciation text book, coupled with its sound materials, was used for practice (e.g., units 21 to 37 in English Pronunciation in Use, Intermediate; Hewings, 2007). The topics include 1) introduction of syllables/word/ sentence stress, 2) consonant clusters at the beginning and end of words, 3) stress in two-syllable, compound and longer words and 4) unstressed syllables. The textbook encourag-es learners to use higher pitch, longer duration and higher intensity to indicate strencourag-essed syllables. Some units were devoted to learning to produce unstressed, reduced vowels (i.e., schwa, /ə/). The topics related to stress were dealt with for the first 11 sessions of the program for J1 and J2, and for the first 19 sessions for J3.
Another focus of the overall training was to improve segmental productions (consonants and vowels) that each participant had difficulty with. J1 was trained on /r/-
/l/ and consonant clusters up to the 20th session, and then on vowels (e.g., /ə/, /æ/) until
the 39th session. J2 was trained on /s/-/ɵ/, /f/-/v/, /r/-/l/ and consonant clusters up to
the 31st session, and on vowels until the 35th session. J3 was trained on /s/-/ɵ/, /z/-/ð/,
/f/-/v/, /r/-/l/ and consonant clusters up to the 19th session, and then on “leaving out
con-sonants” and “linking” up to the 29th session.
reading and speaking practice. In the reading practice, the speakers practice reading some passage from a book with sound materials (e.g., a Penguin book) imitating a native speaker’s model with special attention to the segments and prosody they practice in the sessions. The reading practice was held from the 10th to the 21st session for J1, from the
22nd to the 25th session for J2, and from the 3rd to the 19th session for J3. In the speaking
practice, the speakers read a story and retold it, or read a passage and made a summary of the content and spoke her or his opinion on the issue. The speaking practice was held from the 29th to the 40th session for J1, and from the 21st to the 37th session for J3. J2 and
J3 participated in a speech contest, and a part of the session was used for the practice. It was held from the 26th and the 31st session for J2, and on the 38th session for J3. In both
types of practice, the speakers’ utterances were recorded and played back for self-evalua-tion and feedback.
2―4. Analyses Procedure
One sentence in the reading passage used in the reading task of the diagnostic test was chosen for the present analyses. The sentence, “Age is an important factor in learn-ing to pronounce,” has a succession of content words (i.e., “age”, “important”, “factor”, “learning” and “pronounce”) and function words (i.e., “is”, “an”, “in” and “to”) and has mul-tisyllabic words with stressed and unstressed syllables (i.e., “important”, “factor”, “learning” and “pronounce”). It is normally read with a stress on “age”, “por”, “fac”, “learn” and “nounce”. Especially, “age” may get an extra emphasis in the discourse as it is newly in-troduced as new information. The words in the sentence were syllabified with reference to Longman Dictionary of Contemporary English as follows; age-is-an-im-por-tant-fac-tor-in-learn-ing-to-pro-nounce (a hyphen is used to indicate a syllable boundary in the present article).
All the measurements of the acoustic properties were conducted by the author using sound analysis software, Praat (Boersma & Weenink, 2014). First, the recorded speech was segmented at the syllable and segmental (vocalic and consonantal) level. The vocalic and consonantal segmentation was conducted by visually inspecting speech wave forms and wideband spectrograms following standard criteria (e.g., Payne, Post, Astruc, Prieto, & Vanrell, 2012; Peterson & Lehiste, 1960). The boundaries were placed at the point of zero crossing on the wave form at the start or end of pitch periods. When the vowel onset was glottalized (e.g., [e] in age), the glotttalized portion was excluded from the vocalic in-terval. The onset and offset of fricatives (e.g., is, factor) was marked at the start and end
of high frequency energy. The onset and offset of nasals (e.g., an, important) was marked by the presence of nasal formant structure and low amplitude. The prevocalic and postvo-calic /ɹ/ (e.g., factor, pronounce) was included in the following and preceding vopostvo-calic in-terval. The start of the vocalic interval following /l/ (i.e., learning) was marked at the re-lease of the consonant.
For segmentation of syllables, a silent period preceding initial consonants of a lexical item was excluded from the syllable interval. For example, the syllable interval of “to” started from the release point of /t/ to the end of the vowel, excluding the silent period before the release of /t/. This was done because relatively long pauses often occurred be-fore some lexical items. The silent period within a word was included in the syllable inter-val. For example, the syllable interval of /por/ in important was from the end of /m/ to the end of /r/ including the silent period preceding the release of /p/. Second, aspiration following a stop release was excluded from the preceding syllable interval (e.g., impor-tant). This was done because duration of the aspiration was variable and it was difficult to determine its offset. In addition, some speakers occasionally did not make a stop re-lease. It should be noted that the results of the analyses should be interpreted with cau-tion as the segmentacau-tion procedure was different from that of the previous research where all the consonantal intervals were included in duration of syllables.
In order to examine relative durations of syllables in the sentence while normalizing for speaking rates, a proportional duration of each syllable, relative to the duration of the first syllable in the sentence (i.e., age), was calculated (called normalized duration hence-forth). Specifically, each syllable duration was divided by the duration of the first syllable and multiplied by 100 in each sentence. Thus, the normalized duration for age was always 100% for all utterances.
For measurement of f0/pitch, a maximum f0 in each vowel portion in the sentence was recorded. Following Mori et al. (2014), a pitch difference in semitone between the first vowel portion and each of the other vowels was calculated to normalize for gender and other factors. For measurement of intensity, a maximum intensity (in decibels; dB) in each vowel portion in the sentence was recorded. For normalization, the difference in the intensity value between the first vowel portion and each of the other vowels was cal-culated (Mori et al., 2014). For measurement of vowel formants, the first and the second formant (f1 and f2) were measured at a mid-point of each vowel portion. The values were transformed into those on the Bark scale (B1 and B2) on which the values of equal differ-ences correspond with perceptually equal distances.
2―5. Rhythm indices
Two rhythm indices were used for the analyses of duration. One is the pairwise vari-ability in durations of adjacent syllables normalized for speaking rates (called nPVI-DS1) henceforth) and the other was a variation coefficient of syllables normalized for speaking rates (called VarcoDS1 henceforth). The variability indices for syllables (as opposed to
vowels) were used because some non-vowel phonemes were expected to affect the rhyth-mic patterns of JS. For example, “an” is a one-syllable word in English, but Japanese speakers might produce the word with two rhythmic units corresponding to two morae in Japanese (i.e., /aN/). Exclusion of /n/ in calculation of the variability index would un-derestimate the differences in the degree of variability between JS and NS. The final syl-lable of the sentence (i.e., nounce) was excluded in calculation of the indices to reduce the effects of individual variability in lengthening of the sentence-final syllable and in dura-tions of frication of /s/ at the end of the word.
The index, nPVI-DS, was calculated as follows. The absolute difference in duration of the adjacent syllables, divided by the mean of the duration of both syllables, was summed for all the pairs in a sentence, and then was divided by the number of pairs, and was mul-tiplied by 100. The measure of pairwise variability was extended to pitch (nPVI-P) and intensity (nPVI-I). The index, nPVI-P, was a mean of pairwise differences in pitch (in semitone), while nPVI-P was a mean of pairwise differences in intensity (in dB). The in-dex, VarcoDS, was calculated as follows. The standard deviation of all syllabic durations in the sentence (except the final one) was divided by the mean syllabic durations, and was multiplied by 100. The variability index was also extended to pitch (VarcoP) and intensi-ty (VarcoI). The index, VarcoP, was simply a standard deviation of all the pitch values (in semitone) in the sentence as semitone values are normalized. The index, VarcoI, was sim-ply a standard deviation of all the intensity values (in dB) in the sentence.
2―6. Vowel formants
The degree of vowel reduction in function words was measured on the vowel of /ɪ/ in is, /ə/in an and /ɪ/ in im (in important). These three vowels were chosen because the pattern of change in terms of duration, pitch and intensity was relatively constant across the speakers and tests. Relative to the first syllable (i.e., age), these three words (i.e., syl-lables) were more or less shorter in duration, lower in pitch, and weaker in intensity. The present study examined whether or to what extent the vowels in these syllables were re-duced in terms of vowel quality.
3. Results 3―1. Duration
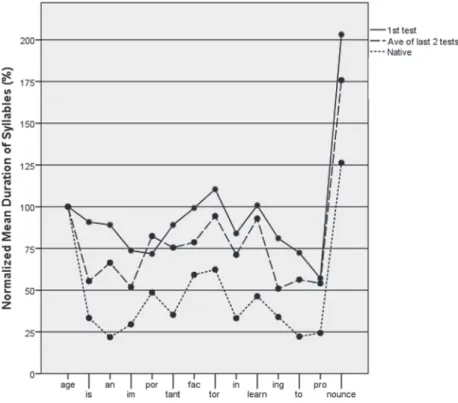
Figure 1 shows the normalized mean duration of syllables as a function of diagnostic tests (1st test and the average of the last two tests) as compared with that of NS. Table 1
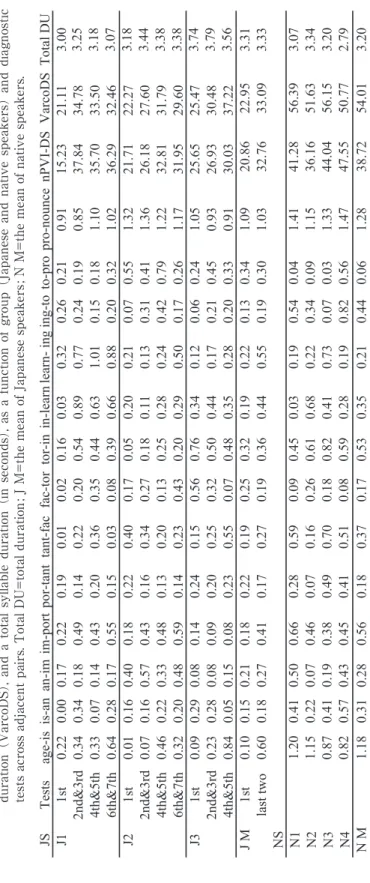
shows the absolute difference in duration of a pair of adjacent syllables divided by the mean of the durations (called “normalized pairwise difference in duration of syllables (NPD-DS)” henceforth). The larger the value, the larger the difference in duration of the adjacent syllables is. When the duration of one syllable is three times longer than that of another syllable, the NPD-DS is 1. The normalized pairwise variability index of syllable durations (nPVI-DS), the variation coefficient in syllable durations (VarcoDS) and a total syllable duration (in seconds) are also shown.
As shown in Table 1 (under Total DU), the total syllable duration of the sentence
Figure 1. Normalized mean duration of syllables (%) in each syllable of the sentence. The solid line, dashed line and dotted line shows the data
of the 1st diagnostic test, the average of the last two tests and the
Table 1. The normalized pairwise difference (NPD-DS) , the normalized pairwise variability index (nPVI-DS) , the variation coefficient in syllable duration (VarcoDS) , and a total syllable duration (in seconds) , as a function of group (Japanese and native speakers) and diagnostic
tests across adjacent pairs. Total DU=total duration
; J M=the mean of Japanese speakers
; N M=the mean of native speakers.
JS Tests age-is is-an an-im im-port por-tant tant-fac fac-tor tor-in in-learn learn- in g ing-to to-pro pro-nounce nPVI-DS VarcoDS Total DU J1 1st 0.22 0.00 0.17 0.22 0.19 0.01 0.02 0.16 0.03 0.32 0.26 0.21 0.91 15.23 21.11 3.00 2nd&3rd 0.34 0.34 0.18 0.49 0.14 0.22 0.20 0.54 0.89 0.77 0.24 0.19 0.85 37.84 34.78 3.25 4th&5th 0.33 0.07 0.14 0.43 0.20 0.36 0.35 0.44 0.63 1.01 0.15 0.18 1.10 35.70 33.50 3.18 6th&7th 0.64 0.28 0.17 0.55 0.15 0.03 0.08 0.39 0.66 0.88 0.20 0.32 1.02 36.29 32.46 3.07 J2 1st 0.01 0.16 0.40 0.18 0.22 0.40 0.17 0.05 0.20 0.21 0.07 0.55 1.32 21.71 22.27 3.18 2nd&3rd 0.07 0.16 0.57 0.43 0.16 0.34 0.27 0.18 0.11 0.13 0.31 0.41 1.36 26.18 27.60 3.44 4th&5th 0.46 0.22 0.33 0.48 0.13 0.20 0.13 0.25 0.28 0.24 0.42 0.79 1.22 32.81 31.79 3.38 6th&7th 0.32 0.20 0.48 0.59 0.14 0.23 0.43 0.20 0.29 0.50 0.17 0.26 1.17 31.95 29.60 3.38 J3 1st 0.09 0.29 0.08 0.14 0.24 0.15 0.56 0.76 0.34 0.12 0.06 0.24 1.05 25.65 25.47 3.74 2nd&3rd 0.23 0.28 0.08 0.09 0.20 0.25 0.32 0.50 0.44 0.17 0.21 0.45 0.93 26.93 30.48 3.79 4th&5th 0.84 0.05 0.15 0.08 0.23 0.55 0.07 0.48 0.35 0.28 0.20 0.33 0.91 30.03 37.22 3.56 J M 1st 0.10 0.15 0.21 0.18 0.22 0.19 0.25 0.32 0.19 0.22 0.13 0.34 1.09 20.86 22.95 3.31 last two 0.60 0.18 0.27 0.41 0.17 0.27 0.19 0.36 0.44 0.55 0.19 0.30 1.03 32.76 33.09 3.33 NS N1 1.20 0.41 0.50 0.66 0.28 0.59 0.09 0.45 0.03 0.19 0.54 0.04 1.41 41.28 56.39 3.07 N2 1.15 0.22 0.07 0.46 0.07 0.16 0.26 0.61 0.68 0.22 0.34 0.09 1.15 36.16 51.63 3.34 N3 0.87 0.41 0.19 0.38 0.49 0.70 0.18 0.82 0.41 0.73 0.07 0.03 1.33 44.04 56.15 3.20 N4 0.82 0.57 0.43 0.45 0.41 0.51 0.08 0.59 0.28 0.19 0.82 0.56 1.47 47.55 50.77 2.79 N M 1.18 0.31 0.28 0.56 0.18 0.37 0.17 0.53 0.35 0.21 0.44 0.06 1.28 38.72 54.01 3.20
was not substantially different between NS and JS, with the mean difference being ap-proximately 200 ms. This was partly because three male speakers were specifically asked to match their reading speed with that of JS. Among JS, the total syllable duration only slightly differed between the 1st test and the mean of the last two tests, suggesting that
the reading speed did not change substantially across the tests.
The data of NS in Figure 1 show the following. First, the duration of age was longer than any other syllable (except nounce), suggesting that they placed extra emphasis on the word. Second, as expected, the duration of the stressed syllables in multisyllabic words (e.g., por, fac, learn, and nounce) was longer than the preceding and/or the follow-ing unstressed syllable, creatfollow-ing “peaks” along the line. Accordfollow-ingly, NPD-DS was rela-tively high in the pair of a stressed and unstressed syllable in content words (e.g., im-port, tant-fac, pro-nounce), as shown in Table 1. Finally, the duration of monosyllabic function words (e.g., is, an, in, and to) was shorter than the stressed syllables of content words, creating “valleys”. NPD-DS was relatively high in the pair of a syllable in a content word and a function word (e.g., age-is, tor-in, ing-to). These created a rhythmic pattern of alter-nating strong and weak syllables in NS’s speech.
In contrast, the data of JS at the 1st test in Figure 1 show the following. First, the
peak in duration associated with a stressed syllable was not observed except in learn and the final syllable nounce. Second, the proportional difference between the duration of the stressed syllable in content words and that of function words is much less than what was observed in NS. For example, the mean normalized duration of is and an among JS was 91% and 89%, respectively, while that of NS was 33% and 22%. As shown in Table 1, NPD-DS associated with the pair of a stressed and unstressed syllable (e.g., im-port, tant-fac) in content words was much lower than that of NS. So was NPD-DS in the pair of a syllable in a content word with a function word (e.g., age-is, ing-to).
The data on the average of the last two tests for JS show the following. As compared with the data at the 1st test, the overall pattern of the durational change along the line
be-came similar to that of NS, with peaks and valleys at mostly the same locations (see Fig-ure 1). First, the durational contrast between a stressed and unstressed syllable in a mul-tisyllabic word became larger. For example, the proportion of syllable duration in im-por-tant became more similar to that of NS. The mean absolute duration of port increased from 182 ms to 245 ms, while that of im decreased from 188 ms to 161 ms. Second, the proportional difference between the duration of a stressed syllable in content words and that of function words also became larger. For example, the mean normalized duration of
is and an decreased to 55% and 66%, respectively, showing intermediate values between the 1st test and the mean of NS. Indeed, the mean absolute duration of is and an decreased
from 231 ms to 170 ms, 218 ms to 196 ms, respectively, while that of age increased from 255 ms to 336 ms. As shown in Table 1, NPD-DS notably increased between the 1st test
and the average of the last 2 tests in the pair of a stressed syllable of a content word and a function word (e.g., age-is, in-learn), and in the pair of a stressed and unstressed syllable of a multisyllabic word (e.g., im-port, tant-fac, learn-ing). These changes probably resulted in varying degrees of substantial increase in nPVI-DS and VarcoDS for JS. However, the mean nPVI-DS of the last two tests for JS did not quite reach the mean of NS (except that J1 reached the NS range). The mean VarcoDS of the last two tests for JS completely fell short of the mean of NS (i.e., about 20 points below the NS mean).
In sum, JS learned to modify duration to differentiate a stressed and unstressed sylla-ble 1) in a multisyllabic word (e.g., fac-tor), and 2) a content word and a function word (e.g., age-is) by lengthening stressed syllables of content words and shortening function words. This lead to a greater degree of pairwise variability in duration of adjacent sylla-bles (nPVI-DS) and of the overall variability in duration of syllasylla-bles in the whole sentence (VarcoDS). The overall data, however, indicated that JS did not completely reach the
NS’s level of durational control over the stressed and unstressed syllables. 3―2. Pitch
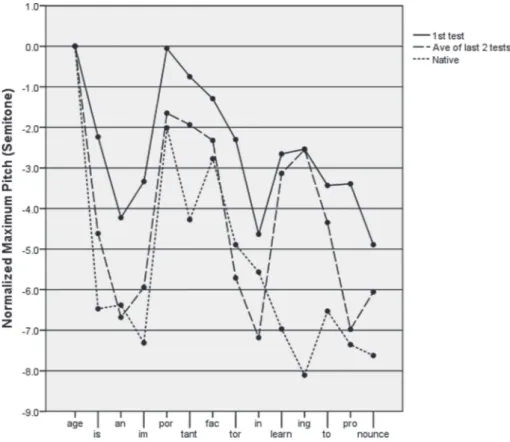
Figure 2 shows the normalized maximum pitch in every syllable of the sentence as a function of diagnostic tests (1st test and the average of the last two tests) as compared
with that of NS, while Table 2 shows the difference in pitch of a pair of adjacent syllables (called “normalized pairwise difference in pitch (NPD-P)” henceforth). First of all, the data on NS (the dotted line) show that, similar to duration (see 3-1.), the pitch of age was the highest of all the syllables. Second, the pitch of stressed syllables in multisyllabic words was higher than the preceding and/or the following unstressed syllable on the av-erage (e.g., por, fac, learn). As shown in Table 2, NPD-P was relatively high in the pair of a stressed and unstressed syllable in some multisyllabic words (e.g., im-port). Finally, the pitch of some monosyllabic function words (e.g., is, an) was lower than stressed syllables of content words, although such tendency was not observed in the latter half of the sen-tence (i.e., in, to).
As a matter of fact, the pattern of pitch change was almost consistent from age to fac, but relatively variable from tor to the end of the sentence among NS. For example, the
following was J4 (female)’s maximal f0 values; fac (210), tor (197), in (176), learn (167), ing (160), to (195), pro (205), nounce (182). In this utterance, the pitch increased at to (a function word) and pro (unstressed syllable). Here is another example from J1 (male); fac (122), tor (201), in (127), learn (115), ing (117), to (134), pro (115), nounce (105). In this utterance, the pitch of tor (the unstressed syllable) was much higher than fac (the stressed syllable), and that of to (a function word) was the peak. Thus, NS used variable pitch patterns following fac, suggesting that some prosodic and discorse factors (e.g., into-nation) can override default pitch patterns based on lexical stress and on the contrast be-tween a stressed syllable in a content word and a syllable in a weak function word. The data of JS at the 1st test (the solid line) in Figure 2 show the following. First, the
overall pattern of the pitch change along the line was similar to that of NS with respect to a valley at an-in, then a peak at port and a drop at tor-in. Second, unlike NS, there was no valley in tant, and there was a peak in learn-ing. Third, there was a substantial change in
Figure 2. Normalized maximum pitch (semitone) in each syllable of the sentence. The
solid line, dashed line and dotted line shows the data of the 1st diagnostic test,
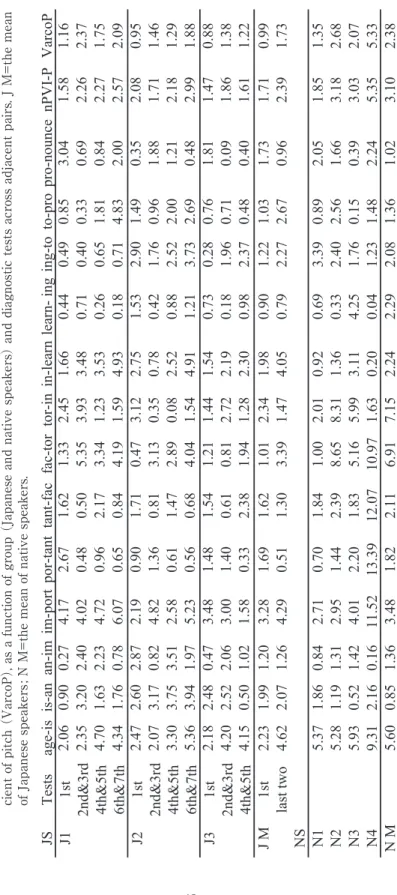
Table 2. The normalized pairwise difference in pitch (NPD-P) , the normalized pairwise variability index of pitch (nPVI-P) , the variation coeffi -cient of pitch (VarcoP) , as a function of group (Japanese and native speakers) and diagnostic tests across adjacent pairs. J M=the mean of Japanese speakers
; N M=the mean of native speakers.
JS Tests age-is is-an an-im im-port por-tant tant-fac fac-tor tor-in in-learn learn- ing ing-to to-pro pro-nounce nPVI-P VarcoP J1 1st 2.06 0.90 0.27 4.17 2.67 1.62 1.33 2.45 1.66 0.44 0.49 0.85 3.04 1.58 1.16 2nd&3rd 2.35 3.20 2.40 4.02 0.48 0.50 5.35 3.93 3.48 0.71 0.40 0.33 0.69 2.26 2.37 4th&5th 4.70 1.63 2.23 4.72 0.96 2.17 3.34 1.23 3.53 0.26 0.65 1.81 0.84 2.27 1.75 6th&7th 4.34 1.76 0.78 6.07 0.65 0.84 4.19 1.59 4.93 0.18 0.71 4.83 2.00 2.57 2.09 J2 1st 2.47 2.60 2.87 2.19 0.90 1.71 0.47 3.12 2.75 1.53 2.90 1.49 0.35 2.08 0.95 2nd&3rd 2.07 3.17 0.82 4.82 1.36 0.81 3.13 0.35 0.78 0.42 1.76 0.96 1.88 1.71 1.46 4th&5th 3.30 3.75 3.51 2.58 0.61 1.47 2.89 0.08 2.52 0.88 2.52 2.00 1.21 2.18 1.29 6th&7th 5.36 3.94 1.97 5.23 0.56 0.68 4.04 1.54 4.91 1.21 3.73 2.69 0.48 2.99 1.88 J3 1st 2.18 2.48 0.47 3.48 1.48 1.54 1.21 1.44 1.54 0.73 0.28 0.76 1.81 1.47 0.88 2nd&3rd 4.20 2.52 2.06 3.00 1.40 0.61 0.81 2.72 2.19 0.18 1.96 0.71 0.09 1.86 1.38 4th&5th 4.15 0.50 1.02 1.58 0.33 2.38 1.94 1.28 2.30 0.98 2.37 0.48 0.40 1.61 1.22 J M 1st 2.23 1.99 1.20 3.28 1.69 1.62 1.01 2.34 1.98 0.90 1.22 1.03 1.73 1.71 0.99 last two 4.62 2.07 1.26 4.29 0.51 1.30 3.39 1.47 4.05 0.79 2.27 2.67 0.96 2.39 1.73 NS N1 5.37 1.86 0.84 2.71 0.70 1.84 1.00 2.01 0.92 0.69 3.39 0.89 2.05 1.85 1.35 N2 5.28 1.19 1.31 2.95 1.44 2.39 8.65 8.31 1.36 0.33 2.40 2.56 1.66 3.18 2.68 N3 5.93 0.52 1.42 4.01 2.20 1.83 5.16 5.99 3.11 4.25 1.76 0.15 0.39 3.03 2.07 N4 9.31 2.16 0.16 11.52 13.39 12.07 10.97 1.63 0.20 0.04 1.23 1.48 2.24 5.35 5.33 N M 5.60 0.85 1.36 3.48 1.82 2.11 6.91 7.15 2.24 2.29 2.08 1.36 1.02 3.10 2.38
pitch between the stressed syllables in content words and that of function words. For ex-ample, the difference in maximum f0 between age and an was 33Hz, 40Hz and 60Hz, for J1, J2 and J3, respectively. In addition, there was a moderate decrease and increase in pitch between in and the preceding and following syllable (i.e., tor-in and in-learn). Inspection of the data on the average of the last two tests (the dashed line) shows the following. First, as compared with the data at the 1st test, the overall pattern of the
pitch change and the values of the normalized maximum pitch became much closer to those of NS. Major differences with the native data remained the same as in the 1st test
(i.e., absence of a valley in tant and presence of a peak in learn-ing). Second, the degree of pitch difference between a stressed and unstressed syllable in multisyllabic content words (e.g, important, factor) mostly became larger. For example, the difference in the maximum f0 between fac and tor in factor changed from 16 Hz at the 1st test to 50 Hz for the
aver-age of the last two tests in J1, and from 4 Hz to 34 Hz, and from 16 Hz to 24 Hz, in J2 and J3, respectively. NPD-P became higher for im-port (except for J3) and fac-tor, as shown in Table 3. Third, the degree of pitch difference between a function word and a stressed syl-lable in a content word also became larger. For example, the pitch difference between age and the following function words became almost comparable to that of NS. Accordingly, NPD-P became higher for age-is and ing-to for all JS. Indeed, NPD-Ps for in-learn were higher than those of NS for all the speakers.
Reflecting these increases in pitch difference of adjacent syllables and the degree of variability in the overall pitch values, both nPVI-P and VarcoP increased from the 1st test
to the last two tests for all JS, although the degree of increase for J3 was much less than that of the others. NPVI-P and VarcoP, however, varied greatly among NS, ranging from 1.85 (N1) to 5.35 (N4) for nPVI-P and from 1.35 (N1) to 5.33 (N4) for VarcoP. This was probably due to the variable pitch patterns following fac described above.
In sum, JS’s ability to control pitch to differentiate stressed and unstressed syllables improved by increasing pitch difference in 1) multisyllabic content words (e.g., important, factor) and 2) a content word and a function word (e.g., age-is, in-learn). These changes resulted in the overall increase in pairwise variability of pitch in adjacent syllables (nPVI-P) and the overall variability of pitch in the whole sentence (VarcoP). It was
diffi-cult to directly compare these values with those of NS as the pattern of pitch change af-ter fac was variable to a certain extent among NS. However, as far as the first part of the sentence was concerned, the degree and pattern of pitch change in JS and NS was almost comparable with each other (except for the drop in pitch at tant). The overall results
in-dicated that it was easier for JS to control pitch than duration in differentiating stressed and unstressed syllables in content and function words.
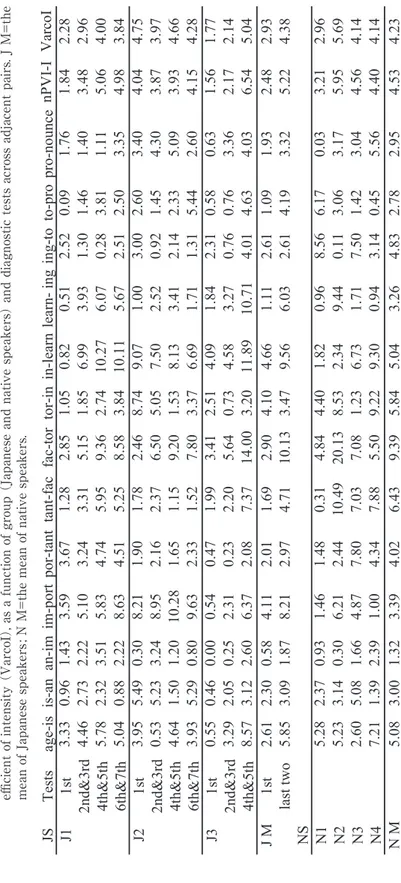
3―3. Intensity
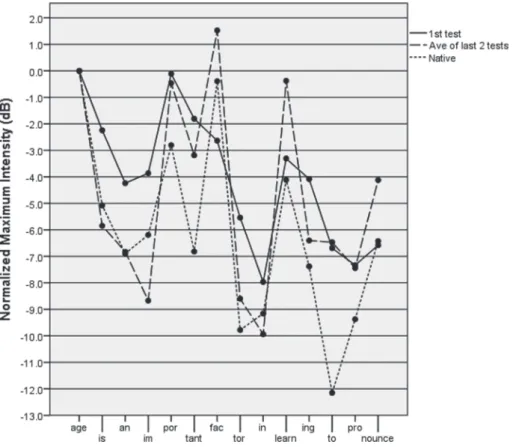
Figure 3 shows the normalized maximum intensity in every syllable of the sentence as a function of diagnostic tests (1st test and the average of the last two tests) as
com-pared with that of NS. Table 3 shows the difference in intensity (decibel; dB) of a pair of adjacent syllables (called “normalized pairwise difference in intensity (NPD-I)” hence-forth).
The data on NS (the dotted line) in Figure 3 show that, on average, there are clear peaks in intensity at the expected locations, namely, on stressed syllables in content words; age, port, fac, learn, and nounce. On the other hand, the valleys were on function
Figure 3. Normalized maximum intensity (dB) in each syllable of the sentence. The
solid line, dashed line and dotted line shows the data of the 1st diagnostic test,
the average of the last two tests, and the English native speakers, respective-ly.
Table 3. The normalized pairwise difference in intensity (NPD-I) , the normalized pairwise variability index of intensity (nPVI-I) , the variation co -efficient of intensity (VarcoI) , as a function of group (Japanese and native speakers) and diagnostic tests across adjacent pairs. J M=the
mean of Japanese speakers
; N M=the mean of native speakers.
JS
Tests
ag
e-is
is-an
an-im
im-port
por-tant
tant-fac
fac-to
r
tor-in
in-learn
learn- in
g
in
g-to
to-pro
pro-nounce
nPVI-I
VarcoI
J1
1st
3.33
0.96
1.43
3.59
3.67
1.28
2.85
1.05
0.82
0.51
2.52
0.09
1.76
1.84
2.28
2nd&3rd
4.46
2.73
2.22
5.10
3.24
3.31
5.15
1.85
6.99
3.93
1.30
1.46
1.40
3.48
2.96
4th&5th
5.78
2.32
3.51
5.83
4.74
5.95
9.36
2.74
10.27
6.07
0.28
3.81
1.11
5.06
4.00
6th&7th
5.04
0.88
2.22
8.63
4.51
5.25
8.58
3.84
10.11
5.67
2.51
2.50
3.35
4.98
3.84
J2
1st
3.95
5.49
0.30
8.21
1.90
1.78
2.46
8.74
9.07
1.00
3.00
2.60
3.40
4.04
4.75
2nd&3rd
0.53
5.23
3.24
8.95
2.16
2.37
6.50
5.05
7.50
2.52
0.92
1.45
4.30
3.87
3.97
4th&5th
4.64
1.50
1.20
10.28
1.65
1.15
9.20
1.53
8.13
3.41
2.14
2.33
5.09
3.93
4.66
6th&7th
3.93
5.29
0.80
9.63
2.33
1.52
7.80
3.37
6.69
1.71
1.31
5.44
2.60
4.15
4.28
J3
1st
0.55
0.46
0.00
0.54
0.47
1.99
3.41
2.51
4.09
1.84
2.31
0.58
0.63
1.56
1.77
2nd&3rd
3.29
2.05
0.25
2.31
0.23
2.20
5.64
0.73
4.58
3.27
0.76
0.76
3.36
2.17
2.14
4th&5th
8.57
3.12
2.60
6.37
2.08
7.37
14.00
3.20
11.89
10.71
4.01
4.63
4.03
6.54
5.04
J M
1st
2.61
2.30
0.58
4.11
2.01
1.69
2.90
4.10
4.66
1.11
2.61
1.09
1.93
2.48
2.93
last two
5.85
3.09
1.87
8.21
2.97
4.71
10.13
3.47
9.56
6.03
2.61
4.19
3.32
5.22
4.38
NS N1
5.28
2.37
0.93
1.46
1.48
0.31
4.84
4.40
1.82
0.96
8.56
6.17
0.03
3.21
2.96
N2
5.23
3.14
0.30
6.21
2.44
10.49
20.13
8.53
2.34
9.44
0.11
3.06
3.17
5.95
5.69
N3
2.60
5.08
1.66
4.87
7.80
7.03
7.08
1.23
6.73
1.71
7.50
1.42
3.04
4.56
4.14
N4
7.21
1.39
2.39
1.00
4.34
7.88
5.50
9.22
9.30
0.94
3.14
0.45
5.56
4.40
4.14
N M
5.08
3.00
1.32
3.39
4.02
6.43
9.39
5.84
5.04
3.26
4.83
2.78
2.95
4.53
4.23
words and unstressed syllables; an, tant, tor, in and to. NPD-I were relatively high for the pair of the stressed and unstressed syllables in multisyllabic words (e.g., im-port, por-tant, tant-fac, fac-tor), as well as for the pair of a stressed syllable of a content word and a syl-lable of a function word (e.g., age-is, in-learn). Examination of the individual data, howev-er, reveals some degree of variability in NPD-I. For example, the NPD-I for age-is ranged from 2.60 to 7.21, while that of im-port from 1.00 to 6.21.
The data on JS at the 1st test in Figure 3 show the following. First, the peaks were
found on the stressed syllables of the content word (i.e., age, port, and learn), with valleys on function words (e.g., an, in and pro), as were found in the native data. The pattern of change in intensity for JS at the 1st test, however, was different from that of NS with
re-spect to the following points. First, the degree of the drop in intensity between age and the following function words (is-an) was much less than that of NS. Second, the valley and the peak on tant and fac were absent. Finally, the degree of drop in intensity in the stressed and unstressed syllables in multisyllabic words was much less than that of NS (por-tant, fac-tor, learn-ing). In should be noted, however, that one participant, J2, shows the degree of change in intensity that exceeds that of NS in some syllable combinations. For example, the drop in intensity between age and an was 9.43 and 8.08, for J2 and the native mean, respectively (see also im-port and in-learn).
A comparison of the data of JS on the average of the last two tests and those of NS shows that the overall pattern of change in intensity along the line is very similar to each other, except that the degree of drop in intensity between ing and to was much less for JS than NS. Examination of NPD-I in Table 3 shows a substantial increase in the pair of a stressed and unstressed syllable in multisyllabic words (e.g., im-port, fac-tor, pro-nounce), and in the pair of an unstressed syllable of a function word and a stressed syllable of a content word (e.g., age-is, in-learn, learn-ing), indicating that the degree of contrast in terms of intensity became larger through the training. Indeed, some NPD-I of JS in the average of the last two tests exceeded those of the native means (e.g., age-is, im-port, fac-tor, in-learn, learn-ing). NPVI-I and VarcoI increased substantially in J1 and J3, while for J2 they were already close to those of NS. In the last two tests, both values were well within the native range, with the mean of JS exceeding those of NS.
In sum, the ability to control intensity to differentiate stressed and unstressed sylla-bles improved by increasing the degree of intensity change in the pair of a stressed and unstressed syllable in multisyllabic words (e.g., im-port, fac-tor, pro-nounce), and a stressed syllable of a content word and of an unstressed syllable of a function word (e.g.,
age-is, in-learn, learn-ing). These led to substantial increase in the degree of variability in intensity of adjacent syllables (nPVI-I) and the overall variability in syllables of the whole sentence (VarcoI), except for J2 whose index scores were already comparable with those of NS at the 1st test. At the last two tests, the degree of change in intensity between
stressed and unstressed syllables was comparable to, or even greater than that of NS. The overall results indicated that JS found it relatively easy to learn to control intensity in differentiating stressed and unstressed syllables in the sentence.
3―4. Vowel quality
Table 4 shows the 1st formant (B1), 2nd formant (B2) and the difference between the
two (B2-B1) on a Bark scale in the mid-vowel portion of /ɪ/ in is, /ə/ in and, and /ɪ/ in im Table 4. The 1st formant (B1), 2nd formant (B2) and the difference between the two (B2-B1) on
a Bark scale in the mid-vowel portion of /ɪ/ in is, /ə/ in and, and /ɪ/ in im, as a function of group (Japanese and native speakers) and diagnostic tests, divided by female and male speakers. J M=the mean of Japanese speakers; N M=the mean of native speakers.
Female
JS
Tests
B1
B2 B2-B1
B1
B2 B2-B1
B1
B2 B2-B1
J1
1st
3.68 14.87 11.18 8.34 10.79 2.45
4.93 15.35 10.41
2nd&3rd 3.53 14.86 11.33 8.25 11.33 3.08
4.26 14.97 10.71
4th&5th 3.69 14.55 10.86 7.31 10.95 3.65
4.25 15.06 10.81
6th&7th 3.69 14.59 10.90 6.37 11.35 4.98
3.96 13.91 9.95
J3
1st
4.09 13.48 9.39
8.97 12.16 3.19
9.66 15.73 6.07
2nd&3rd 5.44 13.22 7.77
8.57 11.54 2.97
7.61 15.20 7.60
4th&5th 5.84 12.85 7.00
8.14 12.16 4.03
8.60 15.46 6.86
J M
1st
3.89 14.17 10.28 8.65 11.48 2.82
7.30 15.54 8.24
last two 4.76 13.72 8.95
7.25 11.76 4.50
6.28 14.69 8.41
NS
N4
3.63 12.88 9.25
4.18 12.50 8.33
4.78 12.69 7.91
Male
J2
1st
3.13 13.18 13.70 5.40 11.03 5.63
2.76 13.70 10.94
2nd&3rd 3.12 13.32 14.15 6.13 11.42 5.29
3.00 14.15 11.16
4th&5th 2.85 13.98 14.44 5.75 11.80 6.06
2.82 14.44 11.62
6th&7th 2.90 13.90 14.33 6.54 11.16 4.62
2.45 14.33 11.89
NS
N1
3.56 12.12 9.25
4.18 12.50 8.33
4.78 12.69 7.91
N2
3.47 12.30 8.56
3.34 11.06 7.72
3.05 11.27 8.22
N3
3.51 12.95 8.83
3.98 11.80 7.82
5.01 11.77 6.76
N M
3.51 12.46 8.88
3.83 11.79 7.95
4.28 11.91 7.63
as a function of diagnostic tests (1st test and the average of the last two tests) as
com-pared with that of NS, divided by female and male speakers. First of all, the Bark differ-ence between the 1st and 2nd formant in /ɪ/ for both is and im was larger than the native
values across the tests for J1 and J2. This indicated that the vowel was produced at a more peripheral (i.e., high-front) position of the vowel space, which was perceptually close to /i/. In contrast, J3 showed the Bark difference which was lower than the native value (N4). Second, the Bark difference in an was much lower in all JS than that of NS,
indicat-ing that the vowel was produced at a more peripheral (i.e., low-back) position of the vow-el space, which was perceptually close to the Japanese vowvow-el, /ɑ/. The value increased from the 1st test to the last two tests for J1 and J3, indicating that the vowel production
became somewhat centralized (i.e., toward /ə/), but greatly fell short of the native values. In sum, the ability to control vowel quality in function words only slightly improved in a limited word (i.e., an) and participants (i.e., J1 and J3). The vowel quality of /ɪ/ for J1 showed some evidence of reduction that was comparable to that of NS. Overall, howev-er, JS showed a great deal of difficulty learning to reduce vowels in function words.
4. Discussion and Conclusion 4―1. Summary of the present findings
The present study attempted to 1) investigate whether and how the ability of JS to control duration, pitch, intensity and vowel quality to differentiate stressed and unstressed syllables in content and function words improved through individual-based, long-term pro-nunciation training; 2) examine whether and how the degree of pairwise variability and the overall variability in each of the acoustic properties increased during training; and 3) how the changes in the use of the acoustic properties in differentiation of stressed and un-stressed syllables were related to the changes in the degree of pairwise variability and the overall variability.
The results found that the overall rhythmic patterns of the sentence in terms of du-ration, pitch and intensity produced by JS became more similar to the alternating rhyth-mic patterns observed in NS through the training. Specifically, the pairwise difference in adjacent syllables in terms of each of the acoustic properties (i.e., NPD) generally became larger in the pair of a stressed and unstressed syllable in a content word, and in the pair of a stressed syllable in a content word and an unstressed syllable of a function word. As a result, the pairwise variability index (i.e., nPVI) and the variation coefficient (i.e., Varco)
mostly increased in all the acoustic properties and the participants. These results support the conclusion that JS were able to improve the ability to utilize duration, pitch and inten-sity in differentiating stressed and unstressed syllables in content and function words. 4―2. Relative difficulty in the use of the acoustic properties
The results, however, found that, consistent with the findings of the previous re-search (e.g., Mori et al., 2014; see Introduction for description of the study), JS had less difficulty modifying pitch and intensity than duration and vowel quality of function words. First, the relative easiness in modifying pitch might be explained by how this acoustic property is used in the native language. As mentioned above, Japanese is a pitch-accent language where lexical accent is cued only by pitch (f0 in terms of physical entity). In perception, f0 has much higher effects on Japanese speakers’ perception of English stress than duration and intensity, while all three of them had approximately the same effect on perception of English stress by native speakers of English (Beckman, 1986). It has also been found that pitch is a primary perceptual cue to English lexical stress for Chinese learners of English whose native language utilizes pitch to differentiate lexical tones (Yu & Andruski, 2010). Second, the relative difficulty in modifying duration may also be due to the first language interference. As described above, Japanese is categorized as a mora-timed language with much less local and global variability in duration of vocalic portions. JS at the 1st test appeared to apply two rhythmic units in production of function words, is
and an, with the normalized duration (in proportion) 2.8 times and 4.0 times longer than that of NS, respectively. Although the normalized duration and the absolute duration de-creased, they did not quite reach the native level. The present findings, together with those of the previous research, clearly indicate that the ability to control duration and tim-ing is resistant to change even through long-term traintim-ing with a great deal of practice. The relative difficulty in modifying vowel quality of function words and unstressed syllables might be caused by the influence of the native language perception and produc-tion of phonemes. It was indicated that /ɪ/ in is and im and /ə/ in and were assimilated to Japanese phoneme, /i/ and /ɑ/, respectively. Another relevant factor is a relative lack of coarticulation of these phonemes in JS’s speech. NS produced these words at a faster speaking rate, which might have increased the degree of centralization of these phonemes. In contrast, JS at the 1st test tended to place relatively equal stress on each of these
words at a slower speaking rate. However, it was found that, through training, the vowel quality of /ɪ/ in is and /ə/ in and in J1 and J3 became slightly more centralized, while
du-ration of these words became shorter. This finding is consistent with the previous re-search which showed that the vowel quality of unstressed syllables was more approxi-mant to that of native speakers in more proficient proficient Japanese speakers (M. Kondo, 2009). Nevertheless, it was found that the vowel quality of these vowels was much less centralized in JS than in NS even at the last two tests, suggesting that modification of vowel quality in function words is very difficult for JS.
4―3. Individual differences in the use of the acoustic properties
The present results found that three JS differed to some extent in the way they im-proved the ability to use the acoustic properties through training. As shown in Table 5, J3 showed the lowest degree of improvement in nPVI-P and VarcoP. At the same time, she showed the highest degree of increase in both nPVI-I and VarcoI during training, and also the highest values of these indices at the end of the training. This indicates that J3 im-proved the ability to utilize intensity to a greater extent than duration and pitch to indi-cate stressed and unstressed syllables during training. On the other hand, J2 showed the highest nPIV-I and VarcoI at the 1st test which was well within the NS’s range, but
showed little increase during training. At the same time, the variability indices for dura-Table 5. A summary of nPVI and Varco in each acoustic property as a function of group (Japanese
and native speakers) and diagnostic tests (T1, T2&3, T4&5, Last2). T1=the 1st test;
T2&3=the average of the 2nd and 3rd test; T4&5=the average of the 4th and 5th test;
Last2=the average of the last two tests; Dif=the difference between the 1st test and the
average of the last two tests; J M=the mean of Japanese speakers; N M=the mean of native speakers. N M is given both under T1 and Last2. The values of T4&5 and Last2 for J3 are identical because she took only five tests.
Speakers T1 T2&3 T4&5 Last2 Dif T1 T2&3 T4&5 Last2 Dif Duration J1 15.23 37.84 35.70 36.29 21.06 21.11 34.78 33.50 32.46 11.35 J2 21.71 26.18 32.81 31.95 10.24 22.27 27.60 31.79 29.60 7.33 J3 25.65 26.93 30.03 30.03 4.38 25.47 30.48 37.22 37.22 11.76 J M 20.86 30.32 32.84 32.76 11.98 22.95 30.95 34.17 33.09 10.14 N M 42.26 42.26 53.74 53.74 Pitch J1 1.58 2.26 2.27 2.57 0.99 1.16 2.37 1.75 2.09 0.93 J2 2.08 1.71 2.18 2.99 0.90 0.95 1.46 1.29 1.88 0.93 J3 1.47 1.86 1.61 1.61 0.14 0.88 1.38 1.22 1.22 0.35 J M 1.71 1.94 2.02 2.39 0.31 0.99 1.74 1.42 1.73 0.74 N M 3.35 3.35 2.86 2.86 Intensity J1 1.84 3.48 5.06 4.98 3.14 2.28 2.96 4.00 3.84 1.56 J2 4.04 3.87 3.93 4.15 0.11 4.75 3.97 4.66 4.28 -0.48 J3 1.56 2.17 6.54 6.54 4.98 1.77 2.14 5.04 5.04 3.27 J M 2.48 3.17 5.18 5.22 2.70 2.93 3.02 4.57 4.38 1.45 N M 4.53 4.53 4.23 4.23 nPVI Varco
tion and pitch (nPVI-DS, VarcoDS, nPVI-P, VarcoP) showed substantial improvement during training. This suggests that J2 primarily used intensity to indicate stressed and unstressed syllables at the entry of the training, but improved the use of duration and pitch through training. The results suggest that each individual may have “strength and weakness” in the use of different acoustic properties at the entry to the training, and im-prove the ability to utilize each acoustic property in different ways.
4―4. Rhythm indices
The present study used two kinds of indices; the normalized pairwise variability in-dex (nPVI) in each acoustic property to measure the degree of variability among adja-cent syllables, and the variation coefficient (Varco) to measure the overall variability of each acoustic property in the whole sentence. As these indices have been used only for duration in the previous research, the present study explored the use of the indices for pitch and intensity as well. As shown in Table 5, the difference in the values of the indices between the 1st test and the average of the last two tests were positive in all the indices
and the participants (except for Varco-I of J2 who showed the almost native level of vari-ability already at the 1st test). This shows that the degree of the pairwise variability and
the overall variability in each of the acoustic properties increased to a certain degree through the training. In term of duration, the result is consistent with the previous re-search which used both nPVI-S and VarcoS (Ordin & Polyanskaya, 2015). Ordin & Poly-anskaya (2015), for example, examined the differences in durational variability in English sentences spoken by French (syllable-timed) and German (stress-timed) learners of dif-ferent proficiency levels, using several rhythm measures. It was found that both nPVI-S and VarcoS were significantly higher in in advanced-level than beginning-level French speakers. The increase in the pairwise variability and the overall variability in pitch is also consistent with the previous finding that Japanese learners of English learn can learn to widen the pitch range in production of English sentences (Tsushima, 2014) and to in-crease the pitch difference to indicate lexical stress (Tsushima, 2015).
One major problem of using the variability indices for pitch and intensity was that it was difficult to determine the native level of achievement due to relatively large variabili-ty in the indices among NS. As shown in Table 5, nPVI-P and VarcoP among NS ranged from 1.85 to 5.35, and from 1.35 to 5.33, respectively, while nPVI-I and VarcoI, from 3.21 to 5.95, and from 2.96 to 5.60, respectively. In contrast, nPVI-DS and VarcoDS among NS were much less variable. The results are consistent with the hypothesis that pitch and
in-tensity are secondary cues to indicate lexical and sentence stress in English (Mori et al., 2014). Especially for pitch, there can be a variety of pitch patterns for a single sentence other than what might be called a neutral pitch pattern, depending on the particular into-nation chosen to convey the speaker’s intention, affection and other factors. To alleviate the problem, one might collect a large amount of data from the native speakers, and de-termine the range and mean of the index in question. One might also set up a condition in data acquisition where speakers have much less freedom in choosing among possible pitch patterns of a particular sentence. Nevertheless, despite the variability among NS, most of the variability index values among JS started out at the 1st test below the native range
(i.e., lower than the lowest NS values), and increased to become closer to the native mean and/or enter into the native range. This could be interpreted as suggesting that there was improvement in JS’s ability to control variability toward the native speaker level in each of the acoustic properties.
Another issue with using variability index is that one should be very cautious in in-terpreting the change of the values. With regard to nPVI, an increase in the amount of difference between adjacent syllables may not necessarily mean improvement in produc-ing the contrast, and vice versa. For example, the same amount of difference is counted regardless of the direction of change, as the same difference score is given if the pitch change of im-port-tant is “low-high-low” (normal) or “high-low-high” (not normal). To check for this kind of possibility, it appears important to compare the normalized pairwise difference (i.e., NPD) across the pairs of the sentence with how the values of the acoustic properties actually change for each pair.
The present analyses suggested that it was useful to use NPD to locate specific pairs of syllables which contributed more or less to the overall increase in n-PVI among JS. In general, major increases in the pairwise variability was observed in the pair of a stressed and unstressed syllable in a content word (e.g., im-port) and in the pair of a stressed syl-lable of a content word with a function word (e.g., age-is) in each of the acoustic proper-ties. A comparison of NPD on the focal pairs across the tests in JS, as compared with that of NS, would help determine where in the sentence JS increased the degree of pairwise variability. In future study, it is important to examine the validity of the indices, especially regarding how the changes in the indices are related to native speakers’ evaluation of the overall rhythm of L2 speech.