1
Characteristics of NERICA in Two Different Ecosystems
(Upland and Lowland)
Master Degree Dissertation, presented by
RONOUBIGOUWA AMBOUROUE AVARO MICHAEL
Utsunomiya University
Graduate School of Agricultural Science
Master' s Course of Plant Science, Laboratory of Crop Science
3
Table of Contents
Summary 1
I. Introduction 3
1.1. A brief view on Consumption and Production of Rice in Africa 3
1.2. About Rice Agro ecologies in Sub-Saharan Africa 6
1.3. Origin of NE RICA 9
Review on different origins of domesticated Rice 9
Origin of NERICA 10
1.4. Object of the research 12
II. Germination Rate and Traits of Seedlings of NERI CA1 and NERI CA5 under 3 Different
Water Depths 13
2.1. Introduction 13
2.2. Materials and Methods 14
Plant materials and sowing environments 14
Data management and statistical analysis 14
2.3. Results and Discussion 17
Evolution of germination percentage under different of water levels 17
Relationship of root and stem lengt h under different water levels 19
Evolution of dry weight under different water levels 20
2.4. Conclusion 26
III. Studies on Some Agronomic Traits of NERICA1 and NERI CA5 under Upland and
Irrigated Lowland Environments 27
3.1. Introduction 27
3.2. Materials and Methods 28
3.3. Results and Discussion 33
Tiller number per hill at 10 and 16 week s after seeding 33 Plant length at 10 and 16 weeks after seeding 36 Response of SPAD under lowland and upland condition 38
4 Heading date under lowland and upland condition 38
Yield components in lowland and upland 42
Total biomass, grain yield and harvest index in lowland condition (2007) 45 Paddy yield under upland and lowland conditions 45 Response of paddy yield under broadcasting and different seeding rat e in lowland and upland
condition 50
Relationship bet ween some traits under lowland condition (2007) 53
3.4. Conclusion 59
IV. Study on Some Traits of F3 Progenie s Derived from the Crossi ng between Nerica5
and Koshihikari 61
4.1. Introduction 61
4.2. Materials and Methods 62
Crossing and growing 62
Standard curve of iodine-amylose content 64
New method for amylos e estimation 64
Rice cultivars 65
Data 65
4.3. Results and Discussion 65
Plant length 65
Panicle length 65
Amylose content prediction by color chart 66
Other observations 76
4.4. Conclusion 76
V. General Conclusion 79
5
Summary
NERICA (O. sativa x O. glaberrima) is important for rice cultivation in Africa. Many professionals of agriculture and food development are expecting that they would contribute to solve food problem in Africa. In this study some agronomic traits of NERICA1 and NERICA5, growing under upland and lowland ecosystems at same location, were examined.
Often, NERICA lines presented some common and different traits behavior under different environment. Tiller number was almost the same in upland and lowland condition for NERICA1, while in NERICA5 showed 1.5 times higher in lowland condition. Nitrogen uptake, through SPAD value, showed different patterns between environments, with similar observation for all genotypes. It seemed that lowland reduced days to 50% heading from 2 to 6 weeks with the highest effect observed in NERICA1. In yield components, several traits that limited the paddy yield increase, under lowland condition, were identified. For NERICA1, in lowland condition, the overgrowth led to the reduction of the spikelet number per panicle. NERICA5 spikelet number per panicle increased under lowland condition with negative effect on ripening percentage (76 to 58%). NERICA1 presented the higher calculated grain yield (611g m-2) under lowland condition, than that of Koshihikari and the others check genotypes (IRAT and Tchibanga). However, for harvested paddy yield, Koshihikari showed the highest value. Other check genotypes yields (IRAT and Tchibanga) were also higher than both NERICA, in lowland, with the lowest performance (477g m-2) recorded in NERICA5. The lowest paddy yield recorded was in Koshihikari under upland condition, which confirmed it’s a strictly lowland ecotype.
Under different seeding rates, both NERICA genotypes showed different behaviors. In upland condition, it is clear that NERICA5’s yield tended to decrease with increasing seeding rate. NERICA1 presented an opposite reaction. There was significant interaction (p<0.033) of genotype-environment. An optimum density (10g m-2) was revealed in lowland condition. Once again yields of NERICA1 were superior to those of
6
NERICA5. Irrigation cultivation system (intensification) is effective for increasing NERICA performances as yield are twice more than in upland. However, between the two NERICA, NERICA1 gave the best response under intensification.
A comparative study to clarify, how water height affects NERICA and Koshihikari seedling traits, was performed. Different water height in pots (simulating upland shallow and flood), were used to test seedlings behavior at early germination stage. Under 0 cm water depth, NERICA5 show a quicker germination than those of NERICA1 and Koshihikari, as only 4 days were needed to reach 80% rate. No difference was observed for germination rate pattern, between 5 cm and 10 cm. Root dry weights continuously decreased with increasing water depth in both NERICA, though this was not completely same with Koshihikari on which optimum was seen at 5 cm. It was clear for all genotype that seedling length increased with increasing water depth. At 0 cm, NERICA5 and Koshihikari seedling length was higher than that of NERICA1.
NERICA5 was crossed with Koshihikari and some F3 self-pollinated progenies traits were studied. More than 73% of investigated hills presented a higher plant length than that of both parents and less than 20% presented close value than that of both parents with a superior mean of 128.2cm. Two peaks were observed on histogram representing the repartition of panicle length in comparison with the parent. It can be an advantage for the selection as a broad choice can be made. Some other physical traits on F3 progenies were absent in parents, revealing a wide gene recombination. Grain length, width and shape were different, as well as panicle number per plant, spikelet number per panicle, grain color, leaf color (anthocyanin bands), color and presence of awn, number of fertile grain and amylose content.
7
Introduction
1.1. A
BRIEF VIEW ONC
ONSUM PTION ANDP
RO DUCTION OF RICE INA
FRICA The rice consumption and production varies considerably between different areas and countries in Africa, so do production systems, ecologies etc. Rice demand in African countries grows faster than every other part in the world with 6% increase per annum (http://www.warda.org); the nontraditional rice growing countries of eastern part of Africa shows a remarkable increase of needs, 15 kg per capita in eastern and southern part. In many West African countries, rice is a staple food (http://www.warda.org). The population of urban centers increased considerably during the last decades; correlatively food needs (rice included) increased and are no longer satisfied by local productions.In Central Africa, Gabon is an illustrative case regarding the importance of rice in yearly food intake; the annual per capita consumption is about 40 to 50kg (Ministry of Agriculture of Gabon, 2004). The reasons of this importance seems to primarily be the unavailability, on the urban daily market, of traditional staple foods (maize, plantain, cassava and other tuber crops), which is the consequence to a countryside’s production mainly oriented to self-consumption. In conjunction, the urban daily life requires a type of food that is quickly available, easy to conserve and cook. Such situation involved deep mutations in food habits, with a decrease of traditional staple food consumption in daily food intake for the imported ones. Rice and wheat, in case of cereals, are the main daily energetic source, which provides 29% of 2600Kcal of daily supplies in 2001 remaining 10% higher than for tubers (18%) and plantain (Ministry of Agriculture of Gabon, 2004).
Some other reports mentioned that, in Africa imported cereals (rice and wheat) preference is increasing, over traditional foods such as sorghum, millet and tuber crops (Defoer et al., 2004). For the similar reasons mentioned above, WARDA reported that rice consumption in Sub-Saharan Africa increased by 5.6% per annum between 1961 and 1992. The same report mentioned that rice is now providing more than third of cereal calorie intake in West Africa and that in some countries it is over 85%.
However, the local rice production is unable to match the demand (Table 1.1 a, b) and most part of African rice consuming countries was not self-sufficient
8
during the last decades. Moreover, the self-sufficiency drastically decreased from the 70’s (71.5%) to the 80’s (48.3%), in most countries of West Africa. Regarding to this situation, those countries required massive importations, essentially from Asian countries. Only a few countries of East and North Africa cover or reach their needs.
Table1.1. Rice self-sufficiency (%) of Central, East, Southern and North Africa, 1996 (a)
Source: a Nyanteng, 1998; b FAO Trade, 1998.
Table1.1. Rice self-sufficiency (%) of Central, East, Southern and North Africa, 1996 Central Africa Self-sufficien
cy (%)
East Africa Self-sufficienc y (%) Southern Africa Self- sufficiency (%) North Africa Self-sufficienc y (%)
Burundi 83.1 Kenya 41.0 Angola 94.9 Algeria 2.5
Cameroon 23.2 Madagascar 96.6 Mozambiqu
e 98.8 Egypt 100.0 Central African Republic 83.5 Malawi 90.5 South Africa 0.93 Morocco 100.0
Congo 1.9 Somalia 2.9 Swaziland 99.1
Dem. Rep. Of Congo
37.6 Sudan 0.4 Zambia 100.0
Gabon 2 Tanzania 84.9 Zimbabwe 0.0
Rwanda 34.2 Uganda 91.6 (b) Country 1960-64a 1970-74 a 1980-84 a 1989-1996 b Benin 124.0 26.7 22.9 17.7 Burkina Faso 83.1 74.3 34.2 39.3 Chad - - - 75.0 Côte d’Ivoire 70.1 71.3 42.0 62.8 Gambia 84.8 87.1 23.0 18.0 Ghana 28.8 48.3 41.2 15.1 Guinea 83.1 82.9 74.4 56.7 Guinea-Bissau 94.6 47.4 60.1 55.0 Liberia 63.5 71.1 64.1 38.5 Mali 100.0 69.7 45.2 48.9 Mauritania 4.2 5.3 10.0 54.1 Niger 63.7 52.8 26.7 49.6 Nigeria 98.7 98.8 51.4 83.8 Sierra Leone 92.6 91.4 77.4 55.0 Senegal 27.8 23.3 15.5 20.3 Togo 70.8 70.0 28.4 56.0 Average 72.2 71.5 48.3 46.6
9 Source: a Nyanteng, 1998; b FAO Trade, 1998.
In Gabon, where rice was probably introduced only after the Second World War, the production is very low or almost inexistent, less than 1000 tons. Needs are almost entirely covered by imports of more than 98% (Norman et al., 2003). Although this fact does not directly induce a serious hungry problem, it presents itself as a major food security issue. That is why, in order to overcome this situation, the Department of Agriculture of Gabon recently formulated rice production and research program.
Rice was essentially cultivated in highland areas in the provinces Nyanga and Ngounié. Some experimental projects in cooperation with Taiwan (early 70’s), China (perhaps 70’s to early 90’s) and Japan (late 70’ to early 80’s, Nippon Koiei) demonstrated high environmental potentialities for rice production in Gabon. However, the production never over passed the experimental stage for many reasons. Local farmers refrained to adopt imported technologies, certainly because of the low extension capacity and less adapted cultivation practices making rice, less competitive than other crops, as it required more labor time. Imported rice competitiveness and lobbying should also be considered as major factors of low development of rice cultivation in Gabon.
1.2. A
BOUTR
ICEA
GRO ECOLOGIES INS
UB-S
AHARANA
FRICAAccording to Defoer et al. (2004), five main rice ecologies are coexisting in Africa:
Rainfed upland rice on plateaus and slopes
Lowland rainfed rice in valley bottoms and flood plains with varying degrees of water control
Irrigated rice with relatively good water control in deltas and flood plains Mangrove swamp rice in lagoons and deltas in coastal areas
Deepwater, floating rice along river beds / banks
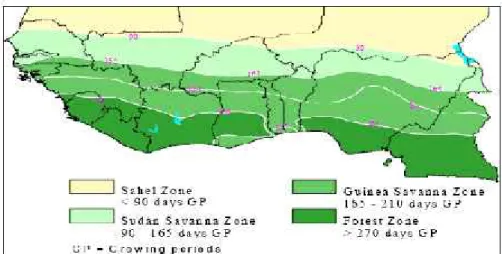
Rice cycles (Figure 1.1) vary from 90 days in Sahel Zone to 270 days in Forest Zone. The Figure 1.1 shows that when leaving the Sahel Zone to the Forest Zone crossing Sudan Savanna and Guinea Savanna, the growing period increases.
10
Predominance of 90 days eco phenotypes in Sahel Zone may be easily explained by the water shortage and short rainy season of 1-3 months. Progressing to Savanna Agro ecological zone, allows rice benefit a longer rainy season. That is why the growing tends to extend itself to 90-165 and 165-210 days of growing period. Very long days over than 210 days and reaching 270 days in the case of tropical forest, can be justified by the fact that rainy season cover a big part of the year season. The total amount of sun radiation received in rainy tropical ecologies is low because of the permanently cloudy sky. The consequence is a decrease of photosynthetic activity. For the case of irrigated lowland, a negative correlation attributed to cloudy sky between yield and the sum of rainfall was found under rainy tropical ecology (Arraudeau, 1998).
11
(a)
(b)
12
1.3. O
RIGIN OFNERICA
R eview on D ifferent Origins of Domesticated R ice
In 1962 the French biologist Roland Portères revealed a different origin
of Oryza glaberrima Steud. (the African domesticated rice species), from the most
known and cultivated species in the World, Oryza sativa, japonica and indica
subspecies (Second, 2004). According to archaeologist researches, the most ancient traces of rice domestication were founded in China and are supposed to be between 9000 and 7000 years B.C. The subspecies of O. sativa: japonica and indica were known in China respectively as Keng and Hsien (Oka, 1988), while Oryza glaberrima Steud. was domesticated in Africa about 3500 ago (Oka, 1988; Carney, 1996; Heuer et al., 2003), in the River of Niger (West Africa). For both species, wild parents are known to
be O. breviligulata for glaberrima and rufipogon for sativa (Oka, 1988). From some
difference detected from the DNA of many samples, the dating based on Molecular (DNA) Clock Concept, and paleontological studies, Second, (2004), assumed that the two cultivated species may have a common ancestors probably separated with Gondwana (old supercontinent) fragments more than 100 million years ago.
Several reports mentioned that O. sativa; the Asian species was introduced into Africa more than four centuries ago, and is actually the major one cultivated in Africa (http://www.warda.org). According to Oka, in many places in Africa,
“sativa and glaberrima are grown in mixture”, and the cultivated area was
“estimated as a half of the total rice field in the inland of West Africa”. The yield of O. glaberrima remains low, because panicle can bear only few grains and the most cultivars are sensitive to lodging (Ishii, 2003; Heuer et al., 2003), and is subjected to shattering (http://www.warda.org). Nevertheless, because O.
glaberrima survived in African environment with less human interferences, it would
had developed some resistant characters to its predestinated environment and presents a lot useful traits to overcome biotic and abiotic conditions (http://www.warda.org; Heuer et al., 2003). The introduction of improved cultivars derived from Asian specie with high potential yield under high input conditions, did not match the expected results, because the most lines were less adapted to the natural environment and others required a lot of inputs (water, fertilizers, pesticides), which are not always available, as farmers income is low in Africa (http://www.warda.org). Then, the target to combine the best part of both African (resistance to biotic and abiotic stresses) and Asian species (high yielding potential) led to the researchers of West and Central African Rice Association
13
(WARDA), at the middle of 1990’s, to conduct an “inter-specific hybridization program”.
Origin of NERICA
During earlier decades many attempts of crossing O. sativa and O. glaberrima
remained unsuccessful because of sterility barriers (Dingkuhn et al, 1998) in F1 progenies. Indeed, F1 progenies resulted from this crossing reached almost 100% sterility (Heuer et al., 2003). The strategy used by WARDA, to overcome this fertility issue was to backcross the F1 lines with the O. sativa parents at least twice. Additionally, embryo rescue technique was also used and the BC2F1 population was subjected to pedigree selection. Doubled haploid through anther culture was used to shortcut the selection. This process was conducted firstly, to the selection of seven upland lines (Table 1.3.) and they named NERICA (New rice for Africa), following later by eleven additional upland cultivars (http://www.warda.org). In 2006, the reported population of certified NERICA contained about eighty-eight cultivars and was supposed to covering the major rice ecologies of Africa. Actually, according to WARDA, the area where NERICA cultivars are grown may reach 150 000 ha.
Table: 1-3-1: Upland NERICA Pedigree Name
NERICA LINE CODE PARENTS
NERICA 1 WAB 450-IBP-38-HB WAB 56-104 / CG 14//2*WAB 56-104 NERICA 2 WAB 450-1-1-P31-1-HB WAB 56-104 / CG 14//2*WAB 56-104 NERICA 3 WAB 450-IBP-28-HB WAB 56-104 / CG 14//2*WAB 56-104 NERICA 4 WAB 450-IBP-91-HB WAB 56-104 / CG 14//2*WAB 56-104 NERICA 5 WAB 450-11-1-1-P24-HB WAB 56-104 / CG 14//2*WAB 56-104 NERICA 6 WAB 450-IBP-160-HB WAB 56-104 / CG 14//2*WAB 56-104 NERICA 7 WAB 450-IBP-20-HB WAB 56-104 / CG 14//2*WAB 56-104 NERICA 8 WAB 450-1-BL1-136-HB WAB 56-104 / CG 14//2*WAB 56-104 NERICA 9 WAB 450-BL1-136-HB WAB 56-104 / CG 14//2*WAB 56-104 NERICA 10 WAB 450-11-1-1-P41-HB WAB 56-104 / CG 14//2*WAB 56-104 NERICA 11 WAB 450-16-2-BL2-DV1 WAB 56-104 / CG 14//2*WAB 56-104 NERICA 12 WAB 880-1-38-20-17-P1-HB WAB 56-50 / CG 14//2*WAB 56-50 NERICA 13 WAB 880-1-38-20-28-P1-HB WAB 56-50 / CG 14//2*WAB 56-50 NERICA 14 WAB 880-1-32-1-2-P1-HB WAB 56-50 / CG 14//2*WAB 56-50 NERICA 15 WAB 881-10-37-18-3-P1-HB CG 14 / WAB 181-18//2*WAB 181-18 NERICA 16 WAB 881-10-37-18-9-P1-HB CG 14 / WAB 181-18//2*WAB 181-18 NERICA 17 WAB 881-10-37-18-13-P1-HB CG 14 / WAB 181-18//2*WAB 181-18 NERICA 18 WAB 881-10-37-18-12-P3-HB CG 14 / WAB 181-18//2*WAB 181-18
14
*IBP: Interbreeding population, HB: High input homogeneous bulk, P: Panicle selection, BL: Blast, DV: Drought at vegetative phase.
Source: WARDA, http://www.warda.org/warda/uplandnerica.asp
1.4. O
BJECT OF THE RESEARCHNERICA is considered as an alternative to the weakness of earlier released cultivars, because it combines the best part of its African (glaberrima) and Asian
(sativa) parents. It is expected that rice production will increase in Africa, by
extending the NERICA cultivated area, but also by applying supplement technologies. Recently, a set of NERICA including rainfed lowland ecotypes was released while the first 18 lines were essentially upland predicate (Obilana & al., 2005). NERICA cultivars are subjected to many experiments and tests in order to know better about their potentialities. The most part of available researches focused on extreme conditions (weed pressure, drought, floods…). Little information is available about growing NERICA under different environments or cultivation practices. This might be because NERICA breeding targets were focused on increasing yield to acceptable level, and resistance to biotic (resistance to disease, weed suppression, etc.) and abiotic (resistance to drought) pressures. Although, grain quality of NERICA was reported to be appreciated by local consumers areas of predilection, amylose content, recognized as belonging to the main traits determining the eating quality, appeared to be high (more than 24%). Reducing the amylose content may be helpful to increase the eating quality and then make rice produced in Africa more competitive against imported rice.
In this study, objectives were: to study the trait-response of 2 NERICA lines, NERICA1 (WAB 450-IBP-38-HB) and NERICA5 (WAB 450-11-1-1-P24-HB), under different ecosystem (upland an intensive irrigation cultivation system); to study some traits of progenies derived from the crossing between NERICA5 and Koshihikari; and the development of a new and cheap method for amylose determination at early breeding stage for developing countries with low resources for research.
15
II.
G
ERMINATIONR
ATE ANDT
RAITS OFS
EEDLINGS OFNERICA1
ANDNERICA5
UNDER3
D
IFFERENTW
ATERD
EPTHS2.1.
I
NTRODUCTIONGermination is the first stage of a plant development. Germination and seed establishment depend of factors such as temperature, light, oxygen and water regime (Yoshida, 1981). Some variations of environment such as water level may often occur. Those variations may occur at period of seeding and germination, considered as the first critical stage of cultivation. NERICA1 and NERICA5 are upland ecotypes, adapted for dry environment. Therefore, ability to successfully overcome the effects of environment variability may be an advantage. Irrigation and drainage are not always well managed in rainfed ecosystem, and rice cultivation is subjected to drought and flood (Sakagami et al., 2005). It should be interesting to know the behavior of NERICA seedlings when subjected to variation of water depth at germination stage. Sometimes, in arid areas flood occurres, when the farmers were not prepared to. The behavior of seedling may be determinant at this period.
This experiment’s target is to study the effect of water level on some traits of NERICA1 and NERICA5 in comparison with Koshihikari. This investigation intends to investigate how water height affects some NERICA’s seedling traits.
2.2. M
ATERIALS ANDM
ETHODS16
The experiment was carried out in temperature controlled room (27-32°C) at Utsunomiya University, in where 2 inter-specific rice genotypes, NERICA1 and NERICA5 (interspecific progenies derived from Oryza sativa and Oryza glaberrima), kindly provided by Dr. Tobita (JIRCAS), and an additional cultivar of a Japanese elite genotype, Koshihikari available at Crop Science Laboratory at Faculty of Agriculture, Utsunomiya University, were used.
As the experiment was carried out to evaluate some seedling traits of NERICA1 and NERICA5 under different water level conditions, seeds were seeded in pet bottles of 8 cm diameter and 17.5 cm height (Photo 2.1.), after the bottles were filled with 5 cm of Andosol (from Utsunomiya University farm). Three water levels (WL) were prepared: 0 cm (WL0), 2 identical holes on bottle allowed draining excess water in 0 cm conditions; 5 cm (WL5) and 10 cm (WL10) of water depth. Ten dry seeds of every cultivar from the top of the bottle were dropped and were not intentionally covered with soil. The water level was checked every morning and supplement water was provided to keep the WL at the required levels.
D ata management and statistical analysis
Applied replications were three with complete randomized design, with two factors: water and cultivar both comprised three levels as mentioned above. Germination of seeds was checked every 2 days, until maximum germination rate was reached. At 15 days after seeding (DAS), five randomly chosen seedlings were for sampled in every replication. To determine height and dry weight of aerial part (culm and leaves) and underground part (carefully washed roots), five dried seedlings were put in dry oven of 80 ºC during 2 days). Data computing and statistical analysis were done by Excel (Microsoft Corporation) and S-Plus 8 Student version software (Insightful Corporation).
17
18
2.3. R
ESULTS ANDD
ISCUSSIO NEvolution of germination percentage under different of water levels
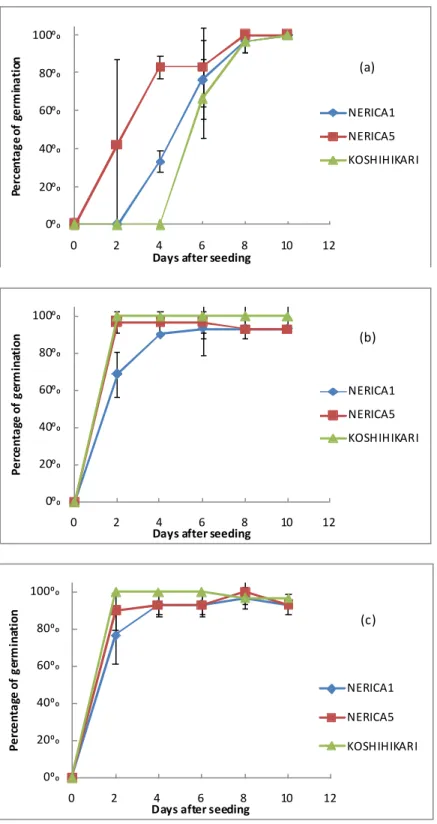
Rice germination occurres through two main steps, the first occurres quick with high water absorption by the grain and the second shows a slowdown of absorption (Arraudeau, 1998). In this study, the shape of curves was similar for WL5 and WL10, and all cultivars passed over 50% of germination at 2 DAS (Figure 2.3.1 b and c). For NERICA5 and Koshihikari, germination percentages of, over than 80%, appeared faster than that of NERICA1. However, at four DAS, under both water levels, all cultivars showed their germination of 95%. In WL0, a slight difference was observed on the evolution of germination percentage.
On the other hand, Koshihikari germination was more homogenous than that of NERICA5. Similar results, in almost same conditions, were found by Tong et al. (2007). The final germination percentage was high for all treatments of Koshihikari, a lowland genotype, showing a high final germination percentage even in WL0 seeding conditions, could be explained by the high temperature in the room and bottles, and eventually high moisture content in the pet bottles. Additionally, the supplying of water everyday might provide the required amount to induce the germination of all cultivars. Regarding this, an interesting point would be to study the germination of NERICA genotypes under more various water supply patterns and temperature in order to detect other trait-variability.
19 0% 20% 40% 60% 80% 100% 0 2 4 6 8 10 12 Pe rc en ta ge o f ge rm in at io n
Days after seeding
NERICA1 NERICA5 KOSHIHIKARI (a) 0% 20% 40% 60% 80% 100% 0 2 4 6 8 10 12 Pe rc en ta ge o f ge rm in at io n
Days after seeding
NERICA1 NERICA5 KOSHIHIKARI (b) 0% 20% 40% 60% 80% 100% 0 2 4 6 8 10 12 Pe rc en ta ge o f ge rm in at io n
Days after seeding
NERICA1 NERICA5 KOSHIHIKARI
(c)
20
R elationship of root and stem length under different water levels
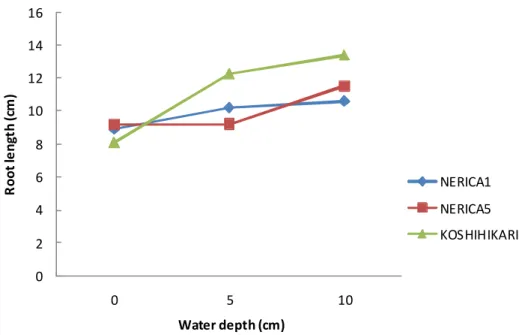
Root length increased when water level increased. Koshihikari presented the highest tendency to increase its roots length with water levels (Fig 2.3.2 a), while for NERICA5 genotype root length started to increase only from WL5 to WL10. Nerica1’s root length started to increase from WL0 to WL5 but remained under NERICA5 at WL10. A significant interaction between WL and genotypes, shown by ANOVA (Table 2.3.1), confirmed those observations.
As for stem length, ANOVA (Table 2.3.1) showed a highly significant (at 1% level) difference between genotypes and between water levels. The observed tendency was also to increase while increasing WL (Fig 2.3.2 b, Photo 2.3). Similar tendency for root length was observed for NERICA5, which increased shoot length only after WL5. Nerica1’s tendency to increase was slow and constant from WL0 to WL10. Under similar experiment (Sakagami, 2005), it was demonstrated that some cultivars tended to increase their length, as mechanism to avoid submergence. In multiple comparison tests, NERICA1-Koshihikari and NERICA1-NERICA5 pairs were significantly different justifying from Fisher's least-significant-difference test (LSD) at 95% confident limits (fig 2.3.2 b). Fisher’s LSD applied on WL showed a significant difference between WL0-WL10 and WL5 and WL10 (Fig 2.3.5). This allows thinking that WL10 effect on shoot length was more important than that of WL5.
Evolution of dry weight under different water levels
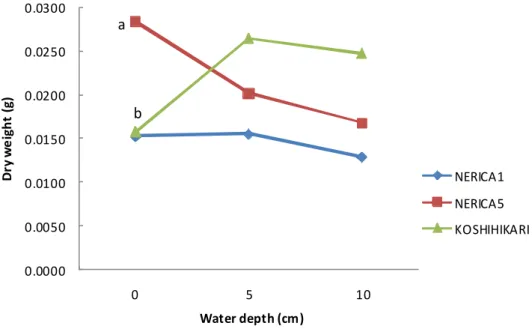
Root and stem dry weight of NERICA5 tended to decrease with increasing of WL (Fig 2.3.3). NERICA1’s root dry weight decreased from WL5 to WL10, the result of this decrease seemed to be an increase of shoot dry weight. Koshihikari behavior was totally different from that of NERICA5. The maximum shoot dry weight values observed in NERICA1, NERICA5 and Koshihikari were at WL10, WL0 and WL5, respectively. ANOVA showed a significant interaction (at 5% level) between WL and genotype for root dry weight (Table 2.3.1).
21 0 2 4 6 8 10 12 14 16 0 5 10 R oo t l en gt h (c m ) Water depth (cm)
Figure 2.3.2 a Evolution of root length under different water level
NERICA1 NERICA5 KOSHIHIKARI 0 5 10 15 20 25 30 0 5 10 Sh oo t l en gt h (c m ) Water depth (cm)
Figure 2.3.2b Evolution of shoot length under different water level
NERICA1 NERICA5 KOSHIHIKARI b b a
22 0.0000 0.0050 0.0100 0.0150 0.0200 0.0250 0.0300 0 5 10 D ry w ei gh t (g ) Water depth (cm)
Figure 2.3.3. a Dry weight of seedling roots part under different water levels
NERICA1 NERICA5 KOSHIHIKARI a b 0.0000 0.0100 0.0200 0.0300 0.0400 0.0500 0.0600 0.0700 0.0800 0 5 10 D ry w ei gh t ( g) Water depth (cm)
Figure 2.3.3. b Dry weight of seedling shoot part under different water levels
NERICA1 NERICA5 KOSHIHIKARI
23
NERICA1 under 10 cm water depth NERICA1 under 0 cm water depth
Koshihikari under 10 cm water depth
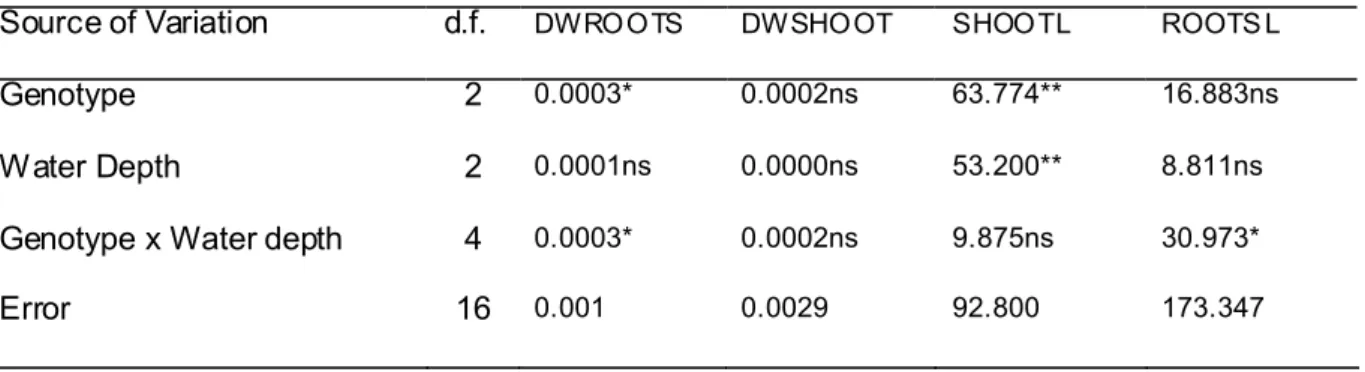
25 d.f.:degree of freedom; DWROOTS : dry weight of root; DWSHOOT : dry weight of shoot; SHOOTL: length of stem or shoot; ROOTSL: length of root
2.4. C
ONCLUSIONDifferent responses were observed between NERICA’ genotypes and Koshihikari, but also between NERICA1 and NERICA5, showing a different behavior. Under different water levels, evolution of germination was different. NERICA5 presented good germination aptitude under WL0, while NERICA1 tended presenting intermediate values for seedlings traits that looked stable under environment variations. Table 2.3.1 Mean square analysis of variance for seedling traits 15 days after seeding
Source of Variation d.f. DWROOTS DWSHOOT SHOOTL ROOTS L
Genotype 2 0.0003* 0.0002ns 63.774** 16.883ns
Water Depth 2 0.0001ns 0.0000ns 53.200** 8.811ns
Genotype x Water depth 4 0.0003* 0.0002ns 9.875ns 30.973*
26
III.
S
TUDIES ONS
OMEA
GRONOMICT
RAITS OFNERICA1
ANDNERICA5
UNDER
U
PLAND ANDI
RRIGATEDL
OWLANDE
NVIRONMENTS3.1. I
NTRODUCTIO NCultivation methods and environment are determinant factors for crop performance. Stability of excellent performances and yield is advantageous under rustic conditions. This means that under unfavorable environment (such as low water input or water shortage), a suitable plant genotype should keep an acceptable level of productivity. It is known that the “status of plants can be modified by two approaches, varietal improvement or cultivation methods” (Tanaka, 1974). However, using high input should be justified on significant yield improvement or on general performance improvement. Positively or negatively, changing environment may affect the response of determinant traits. There are lowland and upland rice ecotypes. Both types, grown under well-managed water supplies, might respond favorably, by improving their agronomics performance. Some scientists studied the effects of water supplies on upland and lowland ecotypes, and observed interaction of genotype-environment for grain yield (Kato et al., 2006).
In Africa, rice production faces many problems, due to the lack of genotypes with resistance and adaptability to local conditions (http://www.warda.org). Scientists in African Rice Center (WARDA) tried overcoming this problem by combining useful traits of O. glaberrima (resistance to abiotic stress) and O.
sativa (high yielding potential). Results of inter-specific breeding program led
to a “New plant type” (Jones et al., 1997), called NERICA; New Rice for Africa (http://www.warda.org). The first NERICA lines were upland ecotypes (http://www.warda.org). Nevertheless, recently WARDA released additional lines of NERICA to cover the main agro-ecosystems in Africa. NERICA lines are subject to many tests in order to know better about their performances. However, the most of them focused on extreme conditions such as drought resistance, as well as others as abiotic and biotic factors characterizing arid areas in Sub-Saharan Africa, since it seems to be major constraints for many rice-producing areas. The evolution of agronomic traits under different environments of NERICA is still few documented. If NERICA genotypes can produce better than the current ones under rustic
27
environment, ability to increase their yield under improved environment (irrigated cultivation) would largely contribute to extend their cultivated area. Therefore, study about the potentiality or performance of NERICA, when grown under different environments (upland and lowland), might be useful.
This study is about the response of some NERICA 1 and NERICA5 traits, grown in lowland and upland environment conditions, in order to elucidate their behaviors under both cultivation ecosystems, and the yield under different cultivation methods as different seeding rates.
3.2. M
ATERIALS ANDM
ETHODSThe experiment was conducted in Utsunomiya University Farm during summers of 2006 and 2007 (Photo 3.3.1.). Five genotypes were used in 2006: NERICA1 and NERICA5 (O. glaberrima x O. sativa) progenies bred by WARDA for upland cultivation; IRAT109, an upland African genotype (Institut de Recherches Agronomiques Tropicales) kindly provided by Dr WADA (Utsunomiya University); Koshihikari (a lowland Japanese elite cultivar) and Toyohatamochi (a Japanese upland cultivar) available in the Laboratory of Crop Sciences Utsunomiya University. Except Toyohatamochi, which has grown only under upland condition, all others had grown under both conditions. In 2007, the same cultivars with two replicates (here blocks) were grown with an additional cultivar, Tchibanga (O. sativa), a genotype collected in Gabon and gently provided by IRRI.
In the year 2006, lowland conditions and direct seeding were sowing methods, after seeds pre-germination at temperature room (20・C) during 5 days. The sowing spacing was 30 cm x 30 cm and with an amount of seven seeds spot-1. Thinning was done a month after seeding in order to insure the maximum surviving seedlings and hill was about two seedlings per hill.
Plots were about by six rows of six hills and size was about 2.5m x 5.5m. In 2007, they were under 3 rows per experimental plot; sowing spacing of 25 cm x 25 cm and twelve hills row-1. In upland conditions, seeding amount was seven drop seeds per spot at 2 cm underground and covered with soil. The sowing pattern was same than in lowland condition. There was missing hills and they were replaced by transplanting.
28
The effect of broadcasting on the yield was tested trough an additional experiment by changing densities and water ecosystem. Seeding method of NERICA1 and NERICA5 was pre-germinated seeds (lowland condition) and dry (upland condition) in plot of 1 m x 2 m. The different planting densities used were three: 5g.m-2, 10g.m-2, 20g.m-2, in order to study the optimum density in lowland and upland conditions. Trial method and experimental design are synthesized in table 3.2.1.
Applied chemical fertilizers were only basically rate and were about 4, 7.2 and 6.4kg per 10 ares for N, P2O and K2O in lowland field. In upland field, 2kg, 6.7kg, 6.7kg were used for N, P2O and K2O, with additional nitrogen provided trough LP100 (N40%) of 1.6kg except in upland broadcasting field. Weeds were removed by hand, twice during cultivation cycle.
Observations performed at field during growth and reproductive stages were tiller number, leaf color SPAD value (by Minolta, SPAD-502) of the second leaf from the longest stem, plant height and 50% heading date. At maturing, the following agronomic traits were evaluated: plant height; grain number; percentage of fertility; 1000 grains weight. Panicle length, yield components and harvest index were checked for average 3-5hills. Data management and statistical analysis were done with Excel (Microsoft Corporation) and S-Plus 8 Student version software (Insightful Corporation).
29
Table 3.2.1 Trial methods and design
Years Cultivation methods Environments Genotypes 2006 Spot, direct seeding 30 x 30 cm Lowland Upland NERICA1, NERICA5, Koshihikari, IRAT109, , Toyohatamochi 2007 Spot, direct seeding 25 x 25 cm Lowland Upland NERICA1, NERICA5, Koshihikari, IRAT109, , Toyohatamochi, Tchibanga
2007 Broadcasting Lowland (seeding rate
5, 10, 20 g.m2)
Upland (seeding rate 5, 10, 20 g.m2)
30 Lowland and upland condition 5 WAS
Lowland condition
31
3.3. R
ESULTS AND DISCUSSIONTiller number per hill at 10 and 16 w eeks after seeding
In general, highest difference of tiller number between lowland and upland rice was observed at active tillering stage (Table 3.3.1), 10 weeks after seeding. NERICA1 and NERICA5’s tiller number hill-1 (2006) was twice in lowland condition than that in upland, revealing a better tillering ability under irrigated lowland condition.
Aphid attacks (Photo 3.3.2) might affect performance of tiller number at active tillering stage (10 weeks after seeding) and may be one of the reasons of lower performance in upland field. In 2006, the highest difference between lowland and upland conditions, at tillering stage, was observed in Koshihikari (about seven times higher in lowland), confirming that it is a lowland genotype. Due to a lack of germination in 2007, Koshihikari was transplanted and water was supplied by irrigation during early growth when rain did not fall for more than 3 days. This may explain in general, why Koshihikari performed better than the year 2006 in upland conditions. At 16 weeks after seeding, which corresponded generally to maturing period in lowland condition, similar values of tiller number per hill were observed between the years 2006 and 2007 in NERICA genotypes. The reason of why Tchibanga and IRAT109 were showing very highest performance for tiller number hill-1, in upland at maturing stage, may be due to advanced development of replacing hills.
Lowland environment might have definitely positive effect on tiller number, by increasing it about 1.1-1.5. NERICA’s genotypes performed as much as Koshihikari, a local and lowland genotype, under lowland condition. However, in upland condition, performance was higher than that of Koshihikari record, especially in 2006 when no water supplying.
32
Table 3.3 Tiller number per hill at 10 and 16 weeks after seeding under lowland and upland condition
L: lowland; U: upland; WAS: week after seeding
2006 2007
10WAS 16WAS 10WAS 16WAS
Lowland Upland L/U Lowland Upland L/U Lowland Upland L/U Lowland Upland L/U NERICA1 10.4+/-3.7 5.6+/- 3.3 1.9 11.1+/-3.3 8.0+/-3. 3 1.4 12.3+/-3. 5 2.4+/-0.8 5.1 9+/-3.8 8.3+/-2.6 1.1 NERICA5 9.7+/- 4.2 4.9+/-2.5 2.0 10.1+/-2.7 6.8+/-2. 8 1.5 11.7+/- 3.0 2.3+/-0.6 5.1 10.3+/-2.1 6.9+/-2.3 1.5 Koshihikari 12.7+/-3.8 1.8 +/-0.7 7.1 12.6+/-3.8 2.9+/-1. 8 4.3 12.6+/-3. 0 5.4+/-3.9 2.3 11.2+/-1.9 6.6+/-4.4 1.7 IRAT109 11.4+/- 3.3 3+/-2.0 3.4 11.6+/-3.0 8.3+/-4. 2 1.4 8.4+/-3.6 5.1+/-3.0 1.7 7.5+/-1.8 8.1+/-2.2 0.9 Tchibanga - - - 8.0+/-3.0 4.4+/-2.7 1.8 7.6+/-2.1 11.5+/-6.5 0.7 Toyohatamochi - 6.9 +/-3.6 - - 8.2+/-3. 2 - - 2.2+/-0.3 - 8.1+/-3.1
33
34
NERICA1 and NERICA5 showed an acceptable tiller increasing ability, as in upland condition, and they reached almost the same number of tillers at 16 weeks after seeding (summer 2007) than that under lowland. Low tiller number characterized NERICA1 and NERICA5 under irrigation (Kaneda, 2005). However, in the current experimental conditions, this was partially confirmed in upland field, because in lowland field both genotypes tended to increase their tiller number hill-1 (>10), such as intermediate tiller number type.
Plant length at 10 and 16 weeks after seeding
As for plant length, there were differences between lowland and upland in almost all cultivars at 10 weeks after seeding. Those differences tended to decrease differently, except for NERICA, at 16 weeks after seeding. Plant length of NERICA1 and NERICA5 increased of 1.3 times in the year 2006 from upland to lowland, while Koshihikari increased its plant length value about 3 times (Table 3.3.2). The final lengths of NERICA1 and NERICA5 were, respectively, 1.4 and 1.3 times at 16 weeks after seeding, showing a strong recovery capacity. The difference at 10 weeks after seeding was about twice to 3 times in summer 2007. In IRAT and Tchibanga, tendency was same. In 2007, Koshihikari performed better in upland than previous year certainly because of transplanting and water supply in early grow stage. The plant length of NERICA at 16 weeks after seedling were higher in 2006 than that in 2007, certainly because of canopy as lower seeding density as applied in 2006.
Under both environments, same conclusion as for tiller number per plant can be made. Performances of NERICA1 and NERICA5 were better than that of Koshihikari in upland, with an ability to express higher plant length in lowland condition than that previously reported in literature.
35
Table 3.3.2 Plant length (cm) at 10 and 16 weeks after seeding under lowland and upland condition
L: lowland; U: upland; WAS: week after seeding
2006 2007
10WAS 16WAS 10WAS 16WAS
Lowland Upland L/U Lowland Upland L/U Lowland Upland L/U Lowland Upland L/U NERICA1 8 0. 8 + /- 6 . 4 5 3 .6 + /- 7 . 2 1 . 5 129.0+ /- 11 .8 97.8 +/-8.6 1 . 3 81.0+/- 3 .8 35. 5+ /- 8. 5 2 . 3 122.9+ /- 11 .0 8 6 . 4 + / - 8 . 9 1 . 4 NERICA5 8 0. 8 +/ - 5 . 7 4 3 .5 + /- 8 . 3 1 . 9 115.6 +/ -10 .0 89.5 +/-9.0 1 . 3 85.3 +/-4 .0 30. 3 +/- 7. 1 2 . 8 1 1 4. 9 + /- 8. 9 8 8 . 8 + / -1 6. 0 1 . 3 Koshihika ri 8 4. 9 +/ - 8 . 7 3 0 .1 + /- 7 . 7 2. 8 1 1 5. 5 + / -7. 7 59. 7 +/ -1 4.4 1 . 9 84.2 +/-2 .9 42. 3 +/- 7. 0 2 . 0 1 1 4. 9 + /- 3. 7 6 8 . 5 + / - 9 . 1 1 . 7 IRAT109 9 1. 1 +/ - 7 . 4 4 7 .1 + /- 8 . 7 1 . 9 1 1 1. 2 + / -8. 1 90. 0 +/ -1 5.3 1 . 2 80.5 +/-6 .0 50. 5 +/- 8. 4 1 . 6 97.3 +/-6 .0 9 6 . 3 + / - 6 . 5 1 . 0 Tchibanga - - - 87.5 +/-4 .1 45.2 +/-15.8 1 . 9 1 5 2. 8 + /- 7. 3 116.2 + /-1 3.0 1 . 3 Toyohatam ochi - 5 5 .2 + /- 8 . 4 - - 77. 6 +/ -7 .91 - - 32. 1 +/- 3. 7 - - 6 5 . 1 + / - 5 . 0 -
36
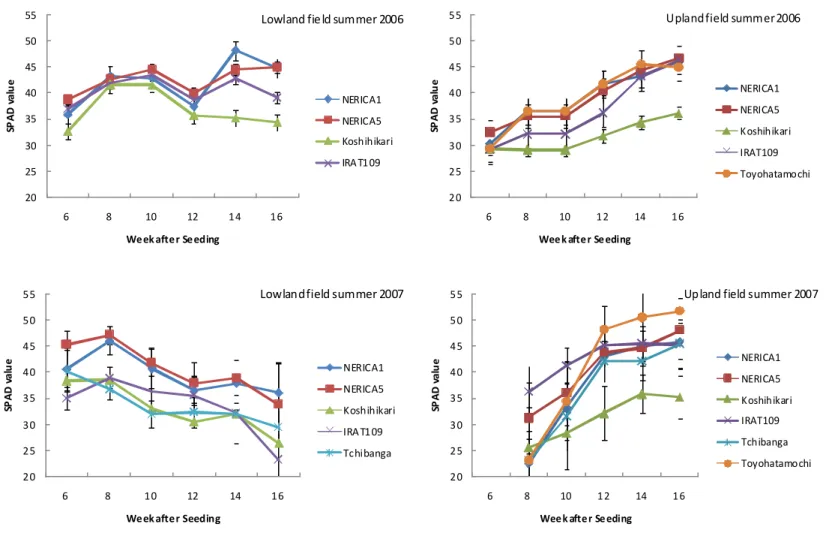
R esponse of SPA D under lowland and upland condition
In general, the SPAD value tendency was different between upland and lowland conditions. It seems that, in upland condition this value tended to increase from seedling stage to late growth stage (Fig3.3.1.). This was true in 2006 and 2007. Lowest SPAD recorded values, were at early growth stage in upland field; root aphid attacks might also be one of main cause (Photo 3.3.1.) at seeding establishment stage. Instead, yellowish leaves were observed on unhealthy seedlings. Later, when the shoot became taller and stronger, the color turned to dark green (SPAD>45). Toyohatamochi showed the highest SPAD value (>50 in 2007) in upland field followed, by both NERICA (>45) genotypes showing higher value than that of other cultivars. In all conditions, NERICA1 and NERICA5’s values remained close.
It appeared that under lowland condition, nitrogen uptake occurred earlier than in upland condition with a faster growth observed as consequence, in lowland. NERICA’s assimilation to nitrogen estimated trough SPAD value was superior to that of Koshihikari.
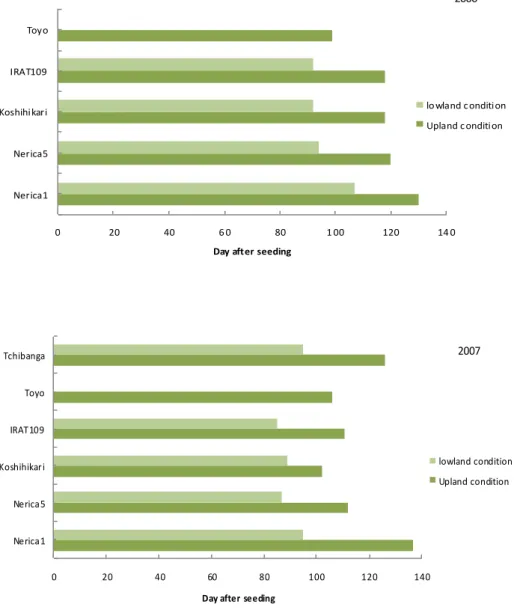
H eading date under low land and upland condition
In both 2006 and 2007, 50% heading, in all genotypes occurred from 2 weeks to 6 weeks earlier in lowland than that in upland condition (Figure3.3.2.), showing a clear impact of water on phenology. However, duration to 50% heading was differed among genotypes. For NERICA1, the variation (1-1.5 month) between environments was higher than that of NERICA5 and all other genotypes. NERICA5 performed as well as Koshihikari in lowland condition. Nevertheless, the length to heading (90-130 days) were, in general, very different from those reported (74-88 DAS) when grown in Ghana (Kaneda, 2005) and Uganda (Bigirwa, 2004).
37 20 25 30 35 40 45 50 55 6 8 10 12 14 16 SP AD v al ue
Week after Seeding
NERICA1 NERICA5 Koshihikari IRAT109
Lowland field summer 2006
20 25 30 35 40 45 50 55 6 8 10 12 14 16 SP AD v al ue
Week after Seeding
NERICA1 NERICA5 Koshihikari IRAT109 Toyohatamochi
Upland field summer 2006
20 25 30 35 40 45 50 55 6 8 10 12 14 16 SP AD v al ue
Week after Seeding
NERICA1 NERICA5 Koshihikari IRAT109 Tchibanga
Lowland field summer 2007
20 25 30 35 40 45 50 55 6 8 10 12 14 16 SP AD v al ue
Week after Seeding
NERICA1 NERICA5 Koshihikari IRAT109 Tchibanga Toyohatamochi
Upland field summer 2007
38 0 20 40 6 0 80 1 00 120 14 0 Nerica1 Nerica5 Koshihikari IRAT109 Toyo
Day after seeding
lowland condition Upland condition 2006 0 20 40 60 80 100 120 140 Nerica1 Nerica5 Koshihikari IRAT109 Toyo Tchibanga
Day after seeding
lowland condition Upland condition
2007
39
Previously, reports mentioned, that NERICA1 tended reaching heading stage lately, when grown, in higher latitude sites (Kaneda, 2005). That may be a reason for very late heading of NERICA1 in current experimental location.
It happened that, under lowland ecosystem in African rice, WAB 638-1 and WAB 56-104, showed longer duration to reach flowering, attributed to transplanting effect shock (Dingkhun et al., 1999). This was not the case in direct seeding. Although a slight variation was observed between 2006 and 2007 from seeding to 50% heading, lowland condition appeared as a good alternative to reduce days required to heading. Some other studies as seeding density, less nitrogen and seeding method might allow understanding effects on heading, because it seemed that NERICA1 and NERICA5 grown under broadcasting with less nitrogen fertilizer (not shown) reached 50 % heading earlier than that of spot seeding and higher nitrogen application.
40
Yield components in low land and upland
Examining the traits limiting a yield potential of a genotype requires to make a “computation of its yield components” (Yoshida, 1981), in comparison with a cultivar known to “achieved good yield under a similar environment”.
Yield components (Table 3.3.3) varied according to experimented genotypes and environment (cultivation condition and ecosystem). In NERICA1, panicle number m-2 increased slightly from upland to lowland conditions (117-123) while NERICA5 performed better in lowland (83-115).Koshihikari showed a drastic reduction of its panicle number m-2 (more than 10 times), when grown under upland condition. IRAT panicle number m-2 was, in upland condition, similar to that in lowland. Almost all genotypes showed a higher number of panicle number m-2 in 2007 in lowland condition; this can be due to the density that was, respectively, 11hills m-2 and 16 hills m-2, respectively, in 2006 and 2007.
However, increasing panicle number m-2 resulted in decreasing of spikelet number panicle-1 in NERICA1. It could be observed between upland to lowland (from 258 to 250), and between different densities in lowland condition (from 250 to 156); IRAT109 presented the similar tendency than that of NERICA1 (176 to 137). NERICA5’s spikelet number panicle-1 increased twice (1.9) when grown under lowland condition. NERICA1’s spikelet number m-2 remained stable in both upland and lowland conditions (2006), although under increased density in 2007 (11 hills to 16 hills m2), spikelet number panicle-1 decreased by 28% and spikelet number m-2 by 20%. NERICA1 presented similar values as previously reported, in the range of Nagano, Shimane and Kyoto, (Yoshida et al, 2005).
41
Table 3.3.3 Yield components under lowland and upland
C ultivar G row ing P an icle S pikelet n um be r of R ip ening ratio 100 0 G ra in yield
co ndition nu m ber/m 2 num b er/pan icle spike let /m 2 % g ra in s w eig ht(g ) g/m 2
N E R IC A 1 U p la nd 1 16.7 2 58.2 30 120 35 .2 22 .6 2 39 .1 L ow land 1 23.4 2 50.1 30 874 60 .8 26 .2 4 92 .7 L ow land (1 ) 1 57.6 1 56.3 24 699 86 .4 28 .7 6 10 .7 N E R IC A 5 U p la nd 83.3 1 88.3 15 693 76 .8 21 .4 2 58 .3 L ow land 1 14.8 2 35.1 26 994 58 .5 23 .1 3 65 .5 L ow land (1 ) 1 56.8 2 11.2 33 170 51 .9 23 .9 4 08 .8 K oshihika ri U p la nd 10.7 91.8 982 72 .8 22 .2 -L ow land 1 54.9 1 21.9 18 890 82 .2 24 .5 3 80 .2 L ow land (1 ) 2 08.8 1 05.7 22 061 81 .5 27 .5 4 47 .8 IR A T1 09 U p la nd 1 22.2 1 76.8 21 607 - - -L ow land 1 19.7 1 68.1 20 124 45 .0 29 .5 2 66 .7 L ow land (1 ) 1 57.6 1 37.6 21 634 67 .0 37 .6 5 54 .7
Toyotah atam o chi U p la nd 93.2 78.2 7 288 - -
-Tchiban ga L ow land (1 ) 1 40.0 14 5.2 20 326 83 .0 3 0.15 5 07 .5
(1) Lowland field in 2007 (density 16 hill.m-2)
42
Environment seemed to have different effect on ripening percentage. NERICA1, Koshihikari and IRAT109 tended to improve their ripening percentage under lowland condition. That was not the case in NERICA5, for which ripening percentage presented a negative response to the increased spikelet number m-2 (under lowland conditions).
NERICA1 presented the highest ripening percentage (86.4%), under lowland condition, followed by Tchibanga and Koshihikari (83% and 82.2%).
In NERICA5, 1000-grain weight remained almost same, but it increased for other cultivars between upland to lowland conditions and between the summer 2006 and summer 2007. In lowland condition, NERICA1 presented the best performance for calculated grain yield, under irrigated condition and surpassed Koshihikari. In NERICA5, main limit was ripening percentage under lowland conditions. IRAT and Tchibanga performances were also over that of Koshihikari because of their highest 1000-grain weight, respectively 37g and 30g.
NERICA1 and NERICA5 showed different reactions in yield components according to environment. In NERICA5, under lowland environment, the most limiting factor seemed to be ripening ratio, which critically reduced itself with increasing spikelet number m-2, while under same environment, NERICA1’ spikelet number m-2 tended to reduce as the consequence of spikelet number panicle-1 reduction. In upland condition, observations were completely different for same traits.
Total biomass, grain yield and harvest index in low land condition (2007)
NERICA1 (1400g.m-2) showed a higher dry weight.m-2 followed by IRAT, Tchibanga (900g.m-2) and NERICA5 (1000g.m-2). The partition between full filled dry grain weight and other part shoot weight, in figure 3.3.3, showed that grain weight of both NERICA genotypes presented the lowest proportion in grain weight (lower than 35%). Those values, in accordance with harvest index (Figure 3.3.3) of NERICA1 and NERICA5, respectively 0.34 and 0.33, were mainly due to overgrowth response of
43
vegetative part in NERICA1, and a high amount of unfilled grains in NERICA5 as already mentioned above. NERICA1’s quicker overgrowth in lowland condition, with a shorter heading time, resulted in a lower grain number panicle-1 and an acceptable percentage of filled grains (Table 3.3.3). The consequence is a lower harvest index than that of Koshihikari (0.37) with almost on similar yield. More studies may be helpful to elucidate the translocation of carbohydrate efficiency on NERICA genotype. The harvest index was positively correlated with 100 grain weight in Figure 3.3.9 (R = 0.67*).
Paddy yield under upland and lowland condition
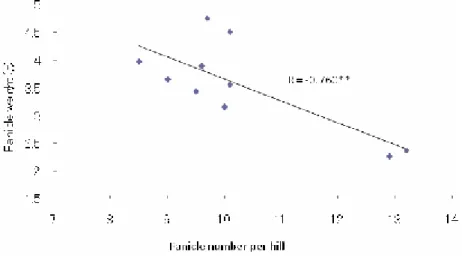
In general, calculated yields and paddy yield value were close in NERICA lines in lowland (2007). Koshihikari paddy yield was the highest in those conditions confirming definitely its better response to this environment. IRAT and Tchibanga performed better than both NERICA in the same conditions (Table 3.3.3 and Figure 3.3.5). Paddy yield was negatively correlated with panicle weight (R= -0.694) and spikelet number per panicle (R= -0.665).
In upland environment however, Koshihikari showed worst paddy yield value (decreased about 5 times) under upland condition. Environment condition had a small effect on IRAT and Tchibanga yield, as they were slightly lower.
44 Figure 3.3.3 Total dry weight (a), harvest index (b) under lowland condition and dry weight partition (c)
45
Figure 3.3.5 Response of paddy yield under upland and lowland condition (UC: upland condition; LC: lowland condition)
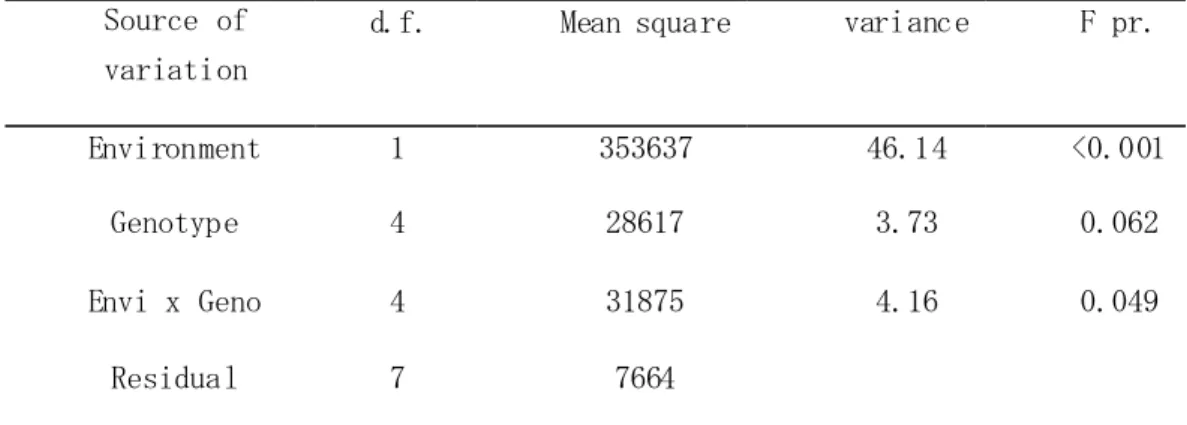
It seemed that transplanting for replaced hills (missing hill were replaced 1-1.5 month after seeding) contributed better in improving performance in upland condition than that of other cultivars, or masked the negative effect of upland. Analysis of variance showed that a very high significant effect (p<0.001) of environment on yield, while a significant (p<0.05) interaction was observed between genotypes and environment (Table 3.3.4). The difference between genotypes was almost significant at p<0.05.
46
The low paddy yield observed for NERICA1 in upland field was certainly due to the longest heading time. Instead, decreased temperatures in experimental site may lead to a higher number of unfertile or unfilled spikelets. As for NERICA5, although earlier headed than NERICA1, paddy yield remained lower in upland than that in lowland condition because of a reduction of panicle number m-2 leading to a reduction of spikelet number m-2, previously
shown in Table 3.3.3.
In our experiment, yield of NERICA1 and NERICA5 were not negatively affected by environment variation by the same way. Phenology (longer seeding to heading time in upland condition) seemed to affect much more yield of NERICA1 and reduce fertility considerably. As NERICA5 could not get certainly enough water resources to produce enough spikelet number panicle-1 or spikelet number m-2, its paddy yield was twice lower in upland field.
More investigation with a dispositive to measure the water productivity to determine the best performance under different water conditions is required.
Table 3.3.4 Analysis of variance of paddy yield in 2007
Source of variation
d.f. Mean square variance F pr.
Environment 1 353637 46.14 <0.001
Genotype 4 28617 3.73 0.062
Envi x Geno 4 31875 4.16 0.049
Residual 7 7664
47
Response of paddy yield under broadcasting and different seeding rate in low land and upland condition
A highly significant difference in paddy yield was clearly observed between lowland and upland field (Table 3.3.5). In upland field, paddy yield was lower than that lowland field for both cultivars. In both conditions, NERICA1 paddy yield remained higher than that of NERICA5 with a highly significant difference. It have been remarked in that condition that heading of NERICA1 (data not shown) occurred early than previously seen under spot seeding and higher nitrogen in upland field. Yield in NERICA5 (143g m-2) under lowland and upland environment was slightly higher than that of NERICA1 (113g m-2).
Seeding rate itself did not present a significant difference when combining both environments. Certainly it is because both cultivars showed optimum when seeded with 10g m-2. Increasing seedling rate negatively affected NERICA5 (Figure 3.3.6). This was clearer in upland field, as the yield of NERICA5 clearly decrease with increasing seeding rate. Significant interaction (p<0.05) of genotypes - seeding rates existed (Table 3.3.5).
Under different environment conditions, seeding rates and water environment condition, paddy yield of both NERICA lines was different. The variation of environment definitely affected the paddy yield. In NERICA5, increasing seeding rate negatively affected paddy yield, while, opposite observation was made for NERICA1. More investigation might be required to understand the specific reasons of NERICA5 paddy yield reduction under lowland and upland, while increase-seeding rate.
48
Table 3.3.5 Analyse of variance of paddy yield under different seeding rate and environment
Source of Variation d.f. mean square Variance F probability
Environment 1 50700 32.62 0.002
Seeding rate 2 1283 0.83 0.49
Genotypes 1 29107 18.73 0.008
Seeding rate x Genotype 2 11248 7.24 0.033
Residual 5 1554
49
Figure 3.3.6 Response of paddy yield under different seeding rate in lowland and upland conditions
50
It seems that, lowland condition with higher nitrogen application and seeding rate lead to a high number of unfertile spikelet m-2, while in upland field reduced the length of panicle (then spikelet number panicle-1).
Relationship between som e traits under lowland condition (2007)
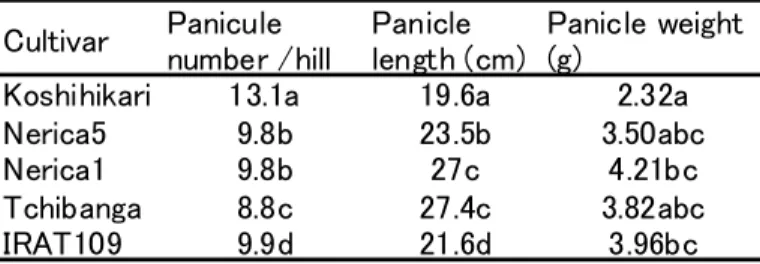
Averages of panicle number per hill, panicle length, panicle weight (checked after 2 days at 80 °C in dry oven) and harvest index of plant grown in lowland field were compared (Table 3.3.6). NERICA1 and NERICA5 showed same value for average of panicle number per hill at maturity. All other cultivars, judging from LSD at 95% confident level, were significant, surely because their varietal response was more noticeable. Excepted in NERICA1 and Tchibanga with highest observed values, all genotypes presented a significant difference for LSD at 95% confident level for panicle length. NERICA1 presented the highest panicle weight followed by IRAT109; both were significantly different from Koshihikari. However, Tchibanga and NERICA5 showed higher value than that of Koshihikari. NERICA1 and NERICA5 were already reported to be panicle weight type (Kaneda, 2005), contrarily to Koshihikari, a tiller number type. This observation is strengthening by the spikelet number per panicle range (188-258), which is higher than those of other genotypes.
In our experimental conditions, some genotypes presenting the longest panicle lengths (NERICA1 and Tchibanga), presented also the higher panicle weight. In the order panicle number per hill (R = 0.760**) and shoot dry weight (R = 0.804**) contributed on variation of panicle weight. On the other hand, varietal differences, between NERICA1 and NERICA5 in panicle weight (Figure 3.3.7.b), under lowland cultivation, were certainly due to the highest dry weight matter production of NERICA1. NERICA1’s higher panicle length (27cm) may also contribute in higher yield. Similar value for panicle length was found by Ikeda et al. (2007)
51
Some reports attributed of NERICA1 high number of spikelets, to a high number of secondary and tertiary rachis branches. Because, length of panicle was showing a high correlation with panicle weight, it would be interesting to investigate the partition of spikelet into the rachis branches and the relation with different panicle branche length.
Table 3.3.6 Panicle number per hill, panicle length and weight under lowland condition (2007)
Cultivar Paniculenumber /hill Paniclelength (cm) Panicle weight(g) Koshihikari 13.1a 19.6a 2.32a
Nerica5 9.8b 23.5b 3.50abc
Nerica1 9.8b 27c 4.21bc
Tchibanga 8.8c 27.4c 3.82abc
IRAT109 9.9d 21.6d 3.96bc
Value with same letter were not significantly significant at 95% confident limits (Fisher LSD)
52
Figure 3.3.7 a. Relationship between panicle weight and panicle number per hill
53
Figure 3.3.8 a. Relationship between panicle length and panicle number per hill
54
Figure 3.3.9 a. Relationship between harvest index and 100 grain weight
3.4. C
ONCLUSIONDifferent environment induced different response that varied, between genotypes, according to the studied traits. Improving environment condition by water supply allowed increasing yield in all genotypes. However, the variation of some traits was not the same among genotypes. Lowland condition had a positive effect on plant length and tiller number during the vegetative period. Check cultivar, Koshihikari, showed this difference more accurately than that of NERICA at maturing stage, which showed a good recovering capacity in upland condition. This confirmed, in a certain way, their better adaptability in lowland than that of strictly lowland cultivar Koshihikari. Nevertheless, when compared with other genotypes from originated from Africa (IRAT and Tchibanga), similar performance was observed. NERICA1 and NERICA5 often reacted differently. NERICA5 grew faster than NERICA1, but the last one sowed highest vegetative growth, with overgrowth under lowland condition. Environment had also an effect
55
on the phenology by reducing days to 50% heading. Difference was from 2 weeks to 1.5 month. NERICA1 was able to reduce its cycle under lowland condition, and not under upland condition, leading to a high infertility and ripening ratio.
The nitrogen uptake under lowland and upland presented completely different patterns, as the SPAD value was higher in lowland at early growth stage with versus pattern in upland.
A certain limits existed when trying to increase yield trough better water conditions. The yield components analysis allowed identifying that the limiting traits on NERICA1 were the panicle and spikelet numbers m-2 under lowland condition. NERICA5’s yield component limiting trait was ripening percentage, which decreased with increasing spikelet number m-2. Increasing seeding rates, then density under broadcasting under upland condition, confirmed that even seeding rates of 10g m-2 was an optimum for both NERICA under lowland condition.
Paddy yield showed that Koshihikari potential under lowland was highest with a significant Genotype-environment effect.
According to our results NERICA1 could performed better than NERICA5 under both conditions. On the other hand, with a shorter time to heading, performance would be better in upland condition.
This study allowed identifying some limiting traits of both NERICA1 and NERICA5, when grown under two different ecosystems. Improving environment by better water condition does improve yield below a certain limit determined by the genotype potential.
56
IV.
S
TUDY ONS
OMET
RAITS OFF3
P
ROGENIESD
ERIVED FROM THEC
ROSSING BETWEENN
ERICA5
ANDK
OSHIHIKARI4.1. I
NTRODUCTIONNERICA5 belongs to New Rice for Africa set of genotypes bred by West Rice Association. Many of NERICA including NERICA5 are well upland adapted ecotypes and can grow under many kind of biotic and abiotic environment pressure with acceptable yield.
But in Africa, the problems faced by rice production are various (ecology, market availability and production and quality competition…). Competition or breeding for a wide market is often relegated to late stage of breeding process, leading to less competitive genotypes against imported rice. Major NERICA breeding program target was to increase yield for rustic environment. Rainfed and shallow lowland ecotypes was only recently introduced to the NERICA collection. NERICA set can be used as parent for creating lines adapted to other cultivation types (irrigated, rainfed lowland etc.), with additional value such as eating quality. Amylose content is considered to be the single most important indicator for predicting the cooking and processing behavior of rice varieties (Landers et al., 1991). That is the reason of attempting to cross NERICA5 and Koshihikari, a Japanese elite cultivar, for high eating quality.
Until now the most used method to determine amylose remained the amylose-iodine colorimetry (Juliano, 1971). But this method, as much alternative methods such as Brabender, requires equipment of near infrared reflectance, spectrophotometer, amylogram, etc. that are not always available in developing countries. Moreover, applying those methods are expensive and also maintenance and management require high technical human resources. That is why we tried to develop a simple and cheap method requiring only basic laboratory vessels and chemicals, based on simple color chart available on market.
57
In this study we evaluated plant and panicle lengths of F3 progenies derived from the crossing between NERICA5 and Koshihikari, for developing irrigation adapted lowland lines for direct seeding with low amylose content. In addition, a simple and cheap method for amylose content predilection, based on color chart, was developed.
4.2. M
ATERIALS ANDM
ETHODSCrossing and growing
Crossing between NERICA5 and Koshihikari as performed during summer 2006 in Utsunomiya University. At flowering stage, panicles were collected before the expected flowering day, cutting their leaves at 1/3 from the top. Crossing was performed by using NERICA5 and Koshihikari, respectively, as female and male parents. Early morning, the spikelets were plugged into 43°C hot water for 7 minutes for emasculation. Panicles of Koshihikari, which started to open and present abundant pollens, were selected in the morning of crossing, and were put under paper bag with emasculated panicle of NERICA5. Shacking was frequently done in order to fall the pollen of Koshihikari into opened NERICA5’ spikelets, until those ones closed themselves (Photo 4.3.1).
F1 grains from this crossing were collected after maturation and grown during winter 2006, in controlled temperature room. Very few number of F1 plants were fertile. At spring 2007 F2 seeds were also grown in 27-32 C temperature controlled room. In summer 2007, F3 progenies originated from F2 plants and their parents were seeded in seeding box and transplanted at 3.5 leaves stage in paddy field under a 30 cm x 30 cm pattern.
58 Photo 4.2 NERICA after artificial pollination with Koshihikari