近畿大学学術情報リポジトリ
23
0
0
全文
(2) Multi-level components of L2 reading fluency: An exploration Andrew Atkins. 1998), timed reading (TR) (Chang, 2010; Underwood, Myskow & Hattori, 2012), and repeated reading (Samuels, 1979/ 1997; Gorsuch & Taguchi, 2008). In many cases a combination of two or more of these activities have been employed with varymg success.. This paper will not assess longitudinal increases in fluency but. rather take a snapshot of the situation as it stands using TR to assess fluency at a point when participants have been performing timed reading for over six months. 1.2 The problem, purpose of the study, and significance. Research by Bernhardt (1991, 2005) suggests that the various aspects of vocabulary knowledge may account for 50 per cent of the variability in language ability, and it is interesting to explore to what extent fluency is a part of lexical knowledge, as suggested by Meara's (1996) dimensions of lexical knowledge. A TR course is proposed to be a means of increasing reading fluency (N ation, 2007) . The effectiveness of timed reading practice though, as a tool for helping to increase reading fluency, is still being debated; however the texts used are roughly equivalent in terms of difficulty, and therefore should provide a measure of fluency at a given time of administration that can be used in this study. Over a number of years of collecting data from weekly timed reading practice, I started to speculate on why students, even after extensive practice, varied greatly on performance (a between-individual fluency gap), and whether it was purely vocabulary knowledge that controlled the attainable speed and comprehension level, or it was more to do with a more static variable such as cognitive speed (Carver, 1992) or working memory span (Osaka & Osaka, 1992) . The present study builds on previous research into timed reading and reading fluency and addresses a gap in the literature by examining reading fluency, albeit on a preliminary level, and which predicted components of reading fluency effect performance on timed reading passages. The study contributes to the reading fluency literature in several important ways.. ( 2 ). Many previous studies of TR have looked at longitudinal growth. -201-.
(3) ::sz~. .. ~1JjIJ. . ::sz{~ / §g 25;g§g 1 ~ / 2013. 9. in reading speed, as this is the stated purpose of the activity, and have tended towards small sample sizes (Chung & Nation, 2007, Utsu, 2004, 2005) , as is often the case with longitudinal studies. In contrast, this study has a larger sample and utilises a cross-sectional approach to explore the relationships between variables and influences on the dependent variable. Many studies have also struggled to find dependant variables with sufficient face validity in that they have used words per minute as the dependent variable and failed to fully account for variation in reading comprehension. This means that readers may move their eyes Quickly over a text without understanding and can still obtain a high score. This seems to be a maj or problem. The importance of reading fluency cannot be stressed enough, as expounded by Segalowitz (2010, p. 2), who explains the concept of the fluency gaps.. He suggests that L2 learners are often frustrated by their deficiency in the. L2, as compared to their L1, especially where fluency is concerned. This withinindividual fluency gap is of course of great concern to teachers whose job it is to. narrow the gap and to learners who desire to become proficient in their L2. Segalowitz (ibid.) also discusses another type of fluency gap, a between-individual fluency gap, which is more the focus of this paper. This paper hopes to contribute to the field by providing information about the factors that make for more fluent readers, and why some students are more successful in achieving fluency than others. 1.3 Definition of Fluency. Reading fluency has been defined by many researchers and scholars, however; the amalgamated definition Wolf and Katzir-Cohen (2001 ) arrived at from reviewing a large number of other studies is concise and appropriate for the purposes of this research: "reading fluency refers to a level of accuracy and rate where decoding is relatively effortless; ... and where attention can be allocated to comprehension" (p. 219) . Thus when examining reading fluency, the two key. -200-. (. 3 ).
(4) Multi-level components of L2 reading fluency: An exploration Andrew Atkins. components that must be taken into account are decoding, meaning the process of translating written symbols into meaningful units, and comprehension. It should be noted though that the studies that Wolf and Katzir-Cohen (2001) examined were L1 studies that used oral reading to measure reading fluency; however as oral reading could really be a proxy for silent reading (Fuchs and colleagues 1988, 2001), the definition still has validity. 1.4 Timed Reading. TR, according to Champeau de L6pez (1993), and for the purposes of this research, is the reading of texts of equal length and equal lexical difficulty, regularly over a period of weeks or months with the purpose of increasing reading fluency, and this is achieved by increasing what Samuels (1994) termed automaticity, that is the ability to decode and comprehend text without much conscious effort. Texts are timed as they are read and reading is followed by comprehension questions, which are answered without referring back to the text. The pressure of timed reading is thought to be the catalyst for improvement in reading fluency, as this provides what Nation (2007) calls "encouragement to perform at a faster than usual speed" (p. 7) . Research indicates that reading speed and comprehension generally increase with practice (Utsu, 2004, 2005) . Recent attempts to assess the effectiveness of L2 TR include studies by Chung and Nation (2006), Crawford (2008), Macalister (2010) , and Utsu (2004, 2005).. Chung and Nation (2006) suggested there was no established statistical. way to measure gains for TR, although most fields outside of ESL offer a number of means, and explored three similar methods to assess gains using only percentage increase in reading rate. Most students improved their reading speed over the course. Macalister's (2010) study also used increases in reading rate to measure fluency. The study was a small preliminary study, but reported increases in reading speed for most. Utsu's (2004, 2005) studies measured changes in reading rate, adding separate comprehension scores as another variable. (. 4. ). -199-.
(5) III. the research. The studies reported improvement in both reading rate and. comprehension as percentage changes. Crawford's (2008) study analyzed reading rate growth using a repeated measures design, and provided some positive support for the use of TR, although the author suggests there were issues of validity. 1.5 Word recognition and reaction time. To read a passage of text fluently, one must possess the ability to recognise the letters and words contained in the texts with automaticity. There are many levels to this skill, but first, certainly when reading, the word's form must be known and recognised before comprehension can begin. Ideally this recognition and the processes that follow should be as close as possible to automaticity in order that attention can be given to meaning of text above the word level. According to Koda (2005) , "word recognition, despite its significance, has received scant attention in L2 research" (p. 37). Although there is more in L1 research, this cannot be generalised to L2 con texts as we are unsure the processes are the same. This research attempts to replicate the speeded number matching test (explained below) used by Brown and Haynes (1985) in order to try to isolate the aspect of speeded decision task that is unrelated to alphabetic processing in order to try to parcel this variance. 1.6 Testing medium. For the purposes of this study, TR and reaction time tests (RT) were administered on a computer to facilitate accurate timing. The Vocabulary Size Test (VST) (Nation & Beglar, 2007) and the Speed of Thinking Test (STT) (Carver, 1992) were administered on paper as accurate timing was less important.. -198-. (. 5. ).
(6) Multi-level components of L2 reading fluency: An exploration Andrew Atkins. 1.7 Research Purpose and Questions. The purpose of this research is to examine more closely the necessity of vocabulary knowledge and its effects, along with the effects of innate physiological variables, on reading fluency performance. The research questions examined in this study are: (1). Which of the variables measured in this study (RT, VST and STT) have a relationship with reading fluency performance as measured by TR?. (2). Which of the measured predictor variables account for the most variation in reading fluency?. 2.0 Methodology 2.1 Participants and Sampling. A total of 134 participants from 3 intact classes were recruited to take part m this study.. The students were from a small national university in western. Japan and were studying required English classes as part of their Economics related majors. The participants came from the Economics faculty in the university and had an average age of 19 years.. There was a gender bias with 33. female subjects (24.6%) and 101 male subjects (75.4%). Students at the university were not divided in ability-based streams, but rather assigned in a relatively random manner to groups. There were however some scheduling constraints that made assignment not entirely random. 2.2 Materials 2.2.1 Timed reading. The instrument at the backbone of this research was a test of timed reading. The treatment consisted of two equivalent reading passages, each with 6. ( 6 ). -197-.
(7) :>Z:~. . ~1~J . :>Z:1t/ m 25 ~m 1 ~ / 2013. 8. comprehension questions.. The passages were controlled for vocabulary load. (Webb & Nation, 2008) by checking their vocabulary against that known by the learners, and questions were designed to be equivalent, with one overall gist question, 2 localised gist questions and 3 simple comprehension questions. The questions were designed to test understanding and not memory. The readings were a combination of specially created passages and those adapted from other freely available sources. The passages were administered randomly from a bank of 26 passages using a specially created web application (see Appendix B). The TR application was a simple web application, built using PHP,. Javascript and an MYSQL database. Students were able to log on over the internet.. On the click of a button they were presented with a short reading. passage and a timer, showing the time spent reading in seconds. Clicking a further button presented them with a set of six comprehension questions that they were required to answer from memory without recourse to the passage. Students' reading time and score were then recorded on the database (Atkins & Cole, 2011 ) . 2.2.2 Vocabulary Size Test. Nation and Beglar's. (2007) Vocabulary Size Test (VST) provided. information required for analysis and is easy to administer in a short period of time.. The VST provides data for receptive vocabulary knowledge by test. sampling 10 words from each 1000-word level of vocabulary in the British National Corpus (BNC) , and not just the total number of words known. Knowing approximately the words that students are likely to know at a receptive level provided by the VST and comparing this with word profiles of texts from the RANGE program helps teachers to identify words that are likely to be unknown.. The VST makes some assumptions that remain to be tested, in that. the test uses the unit of word families and assumes that if students know a headword then they will have receptive knowledge of most of the other members. -196-. ( 7 ).
(8) Multi-level components of L2 reading fluency: An exploration Andrew Atkins. of the word family.. This assumption seems to hold for Ll situations (see. Bertram, Laine, & Virrkala, 2000 for a discussion) , but there is some doubt that it is applicable for L2 situations (Schmitt & Zimmerman, 2002). The validity and reliability figures for the test are also unknown. Only the first five levels of the fourteen-level test were used as these were felt to be the most relevant for the purpose of this investigation. The test consists of ten test items for each one thousand-word level; therefore a fifty-item test was used for this study. Timed reading is designed to promote fluency and as a result the lexical load is intentionally low and seldom exceeds the most common five thousand words in English. 2.2.3 Speed of Thinking Test. Carver's (1992) Speed of Thinking Test was used to discover information about participants' cognitive speed at the letter leveL The test consisted of 184 items administered over 2 minutes in totaL. On Paper, the test presented paired. upper and lower case combinations of the letters. a, b, A ,. and E, and test takers. were required to mark whether the letters were the same or different. See Appendix A for an excerpt from the test. The test was designed so that it could not be completed in the two minutes given, although originally the test had fewer questions but was increased when a student in a previous cohort finished it. 2.2.4 Word Recognition Reaction Time Test. Due to results attained from administering the VST, it was known that students were potentially weak on the second 1,000 words of English as defined by the BNe. It was decided to test students on the "Anglo-Saxon" words from the aforementioned second 1,000 words of English, as it was felt that due to the nature of English study at high-school level in Japan, these would produce the greatest variance between the students performance. This test was designed to check students' word recognition skills. Using the Compleat Lexical Tutor website. ( 8 ). -195-.
(9) ::x:~. . ~l~J . ::x:1t / ~ 25:g~ l. ~/. 20l3. 8. (Cobb, 2003) , I generated a list of Anglo-Saxon words from the second LOOO words of English, and this list was then randomised. The first 40 words were selected for the reaction time test. In addition to these words 20 non-words were chosen in a similar manner. Using Paul Meara's list of 100 plausible-non-words (available on Cobb's website) , the list was randomized and the first 20 chosen. The 40 Anglo-Saxon words and the 20 plausible-non-words were made into a reaction time test using the Compleat Reaction Timer v.4 (Cobb, 2003) . Another test was also made as a practice test using 20 Anglo-Saxon sounding real words and 10 plausible-non-words, so that participants were familiar with the format before they did the actual test. Reaction times wer e recorded by the program and sent by email to the teacher. 2.2.5 Speeded Number Matching Test. A number matching reaction time test was also created using Compleat Reaction Timer v.4 (Cobb, 2003). The test was based on one described in Haynes and Carr (1990) , but was delivered on computer instead of on paper. The test was designed to check whether number recognition was related to word or letter recognition, and which was most closely related to reading performance. It was also thought that the test score could function as a covariate in later analysis. In order to make the test, a random list of 3-digit numbers from 100-999 were generated using the Compleat Randomizer v.2.4 (Cobb, 2003). The first 30 numbers were chosen to be used in the test.. 20 of these numbers were used as. correct answers and 10 as incorrect answers. The correct answers were presented as a matching pair of 3-digit numbers, e.g. 123_123, and the incorrect answers were presented as non-matching pairs, e.g. 456_654. Reaction times were recorded on the individual students computers and these were sent by email to the teacher.. -194-. ( 9 ).
(10) Multi-level components of L2 reading fluency: An exploration Andrew Atkins. 2.3 Procedures. At the beginning of the school year the participants were asked for their cooperation in research over the year and none of them objected to being involved. TR started from the second week of the school year, and two randomlyassigned TR passages and corresponding questions were completed each week, at the start of every lesson. The TR data for this study was taken from week 20 of the school year. Instructions for each test were given in Japanese to ensure there were minimal mistakes. All of the tests were group-administered. The first five levels of the VST (Nation & Beglar, 2007) were administered in week 4 of the school year, taking 40 minutes to administer. The STT (Carver, 1992) was administered in week 5, and took only 10 minutes to explain and administer. In week 20, before the TR tests were completed, the Word. Recognition Reaction Time Practice Test was administered, and this was followed by the Word Recognition Reaction Tim e Test.. Finally, in week 21, the Speeded. Number Matching Test was administered. 2.3.1 Analytical Approach and Variables. As mentioned earlier, a consensus on how to measure timed reading studies has yet to be reached; however in this study an attempt has been made to develop a variable with better face value than raw words per minute.. For the. purposes of this study a composite score for each reading is calculated from words-per-minute (WPM) multiplied by the raw percentage correct on the multiple choice comprehension test expressed as a decimal.. Essentially this WPM. adjusted for comprehension, e.g.. if a reader reads a passage in 60 seconds and gets all of the comprehension items correct their reading rate of 300 WPM is not adjusted; however for a student reading in the same time of 60 seconds (300 WPM) who attains only 83.33% (5 out of 6) on the comprehension items, their reading rate is multiplied by 0.8333 to give an adjusted score of 249.9 WPM.. ( 10 ). -193-.
(11) X~. . ~vnJ . X1t/ m 25 gm 1 ~ / 2013. 8. To further account for variation. III. performance and uncontrollable. differences in the difficulty of the TR reading passages the mean adjusted WPM for the 2 passages administered in week 20 was used as the dependent variable. The higher the number the more proficient a reader is assumed to be. The VST gave raw scores from 10 for each of the five levels tested and a raw total score for all five levels combined. A higher number suggests greater vocabulary knowledge. The STT provided a raw total of questions answered in the two minutes allowed. and a higher score suggests that a participant has faster cognitive speed.. The word recognition reaction time test provides us with an. average reaction time for distinguishing whether a word is known or not, and it also provides us with an error score. The reaction time shows us how fast a participant can distinguish a word from a non-word. but the error score is ambiguous. as it can show genuine errors in processing. but can also include real words that are unknown.. The speeded number matching test provides less. ambiguous results. as it excludes any knowledge of English. and should be a pure measure of cognitive processing speed. Errors on this test are mistakes made by the participant and the score should be adjusted in some way to account for this. but I am unsure how to do this in a fair manner. For the purposes of addressing research question one. multiple correlation was used to examine the relationship between the dependent TR variable and independent variables. Research question two was addressed using hierarchical linear regression.. All analyses were carried out using SPSS 17.0 for Windows.. 3.0 Results. Before addressing the research questions directly. it is useful to examine the descriptive statistics for the variables measured in this study. Table 1 shows descriptive statistics for participants generated using SPSS 17.0.. -192-. ( 11 ).
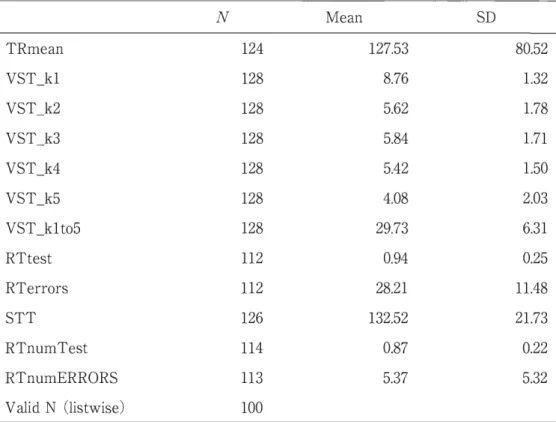
(12) Multi-level components of L2 reading fluency: An exploration Andrew Atkins. Table 1. Descriptive statistics by variable. Mean. N. SD. TRmean. 124. 127.53. 80.52. VST_k1. 128. 8.76. 1.32. VST_k2. 128. 5.62. 1.78. VST_k3. 128. 5.84. 1.71. VST_k4. 128. 5.42. 1.50. VST_k5. 128. 4.08. 2.03. VST_klto5. 128. 29.73. 6.31. RTtest. 112. 0.94. 0.25. RTerrors. 112. 28.21. 11.48. STT. 126. 132.52. 21.73. RTnumTest. 114. 0.87. 0.22. RTnumERRORS. 113. 5.37. 5.32. Valid N Oistwise). 100. TRmean is the adjusted mean reading score for the two timed reading. passages. The metric is based on words per minute, but is adjusted for comprehension. VST_k1 is the raw score on the VST at the first 1000-word level. VST_k2 is the raw score on the VST at the second 1000-word level. VST_k3 is the raw score on the VST at the third 1000-word level. VST_k4 is the raw score on the VST at the fourth 1000-word level. VST _k5 is the raw score on the VST at the fifth 1000-word level. VST_kl to5 is the raw score on the VST for the first five 1000-word levels. RTtest is the mean reaction time for the 60 items on the reaction time test based on Anglo-Saxon words from the second 1000 words of the BNe. RTerrors is the number of errors on the RTtest expressed as a percentage. STT is the total number of questions answered on the Speed of Thinking Test. RTnumTest is the mean reaction time for the 30 items on the Speeded Number Matching Test. RTnumERRORS is the number of errors made on the Speeded. ( 12 ). -191-.
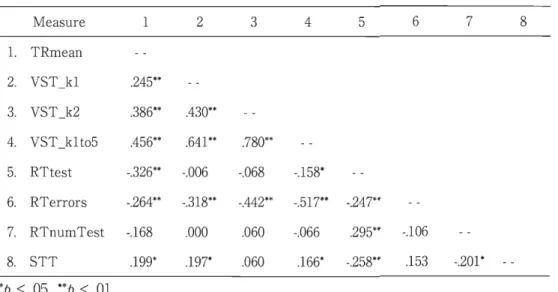
(13) X~· ~imJ' X1t / ~. 25 ~~ 1 ~ / 2013. 9. Number Matching Test expressed as a percentage.. It can be seen that the valid sample size for all of the variables is 100, and as alluded to earlier that longitudinal studies often have small sample sizes, this is due mainly to the instruments being administered over a range of occasions, and missing only one test would exclude a participant from the total valid sample. The mean score for the VST_k2 is also of note, as this shows that vocabulary size as assessed by the VST is greater for the third 1,000 words of English than for the second. The reaction time test results and errors are worthy of some description as it can be seen that there is little difference in the average reaction times for each test (RTtest = 0.94, RTnumTest = 0.87) ; however the cognitive demands of the tests are not equal, with the RTnumTest being more complex as it is a comparison of two numbers.. The RTtest score appears to be rather slow, and. perhaps double the time needed by an educated native speaker of English. The error percentages are more interesting. There are still errors on the number test, although they are much fewer than in the word test, but this shows that speed was being prioritised over accuracy. The much higher percentage for the word test will include these errors from prioritising speed, but also contains real words, which are unknown to the participant, and in this sense it appears to be conflated and difficult to use in further analysis. Research question 1 asked which of the variables measured have the stronger relationship with reading fluency as measured by TR performance, and to assess this multiple correlation was used. Table 2 shows correlations between the variables.. -190-. ( l3 ).
(14) Multi-level components of L2 reading fluency: An exploration Andrew Atkins. Table 2. Intercorrelations between measured variables. Measure l.. 1. 2. 4. 3. 5. 6. 7. 8. TRmean. 2. VST_k1. .245**. 3. VST_k2. .386**. .430**. 4. VST_k1to5. .456**. .641 **. .780**. 5. RTtest. -.326**. -.006. -.068. -.158*. 6. RTerrors. -.264**. -.318**. -.442**. -.517**. -.247**. 7. RTnumTest. -.168. .000. .060. -.066. .295**. -.106. 8. STT. .199*. .197*. .060. .166*. -.258**. .153. -.20l *. *p < .05 **p < .01.. We can see a number of interesting correlations in the table. Reading fluency (TRmean) correlates significantly with all of the other variables except the speeded number matching test. (RTnumTest). Significant correlations. however vary from small to medium-large. The speeded number matching variable comes from the only instrument that is non-alphabetic, whereas the letterlevel speed of thinking test (STT) and the word-level reaction time test (RTtest) are both significant. The negative correlation of these two variables is due to the nature of the scales used; a higher score on the STT faster, whereas a lower score on the RTtest is faster.. The vocabulary-based variables (VST_kl, VST_k2, and. VST_klto5) all correlate significantly with reading fluency, however it is surprising that the total vocabulary variable (VST _k1 to5) correlates most strongly, because the reading passages are written to be within the first thousand words of English, not the first five thousand. Relating to research question 1, we can see that vocabulary as measured by the VST, and word-level reaction time as measured by a reaction time test, have the strongest relationships with reading fluency as measured by timed reading performance.. ( 14 ). -189-.
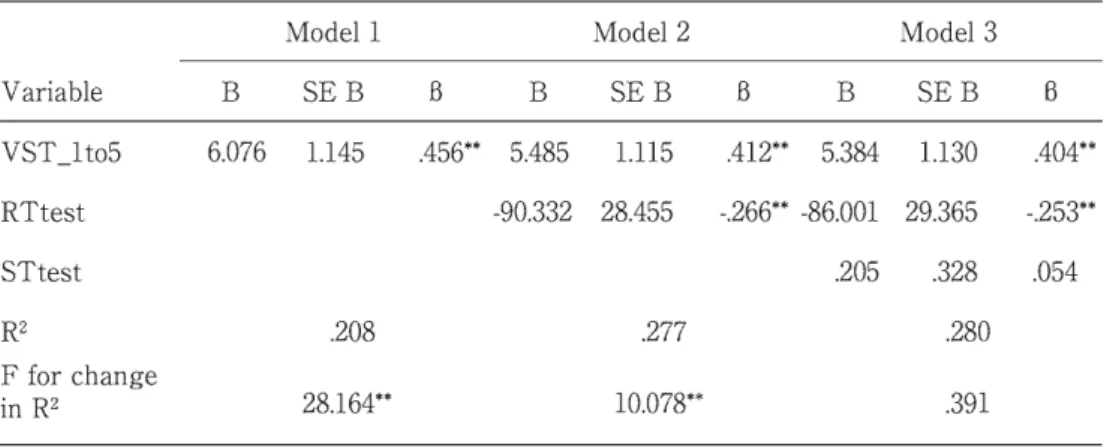
(15) Research question 2 asked which of the variables measured account for the most variation in reading fluency. Bearing in mind the results from the multiple correlation data and to discover the answer it was necessary to perform a multiple regression analysis. The results of the analysis are shown in Table 3.. Table 3. Hierarchical Regression Analysis Summary for Measured Variables Predicting Reading Fluency (TRmean) (N = 109) Modell Variable VST_1to5. B. SEB. 6.076. 1.145. RTtest. Model 2 B. .456**. B. SEB. 5.485. 1.115. -90.332. 28.455. STtest. Model 3 B. SEB. 5.384. 1.130. .404**. -.266** -86.001 29.365. -.253**. .412**. .205. R2 F for change in R2. B. B. .328. .208. .277. .280. 28.164**. 10.078**. .391. .054. A hierarchical regressIOn analysis was used to test if the most likely predictor variables significantly predicted participants' performance on the criterion variable (trAVEadj). From the results of the multiple correlations it was predicted that the total VST score (VST_lto5) would account for the most variation, and in Model 1 this was the only predictor included. All assumptions were met including the assumption that independent errors were tenable.. The. results of the regression for model 1 indicated VST_1 to5 explained 20.8% of the variance (R2=.21, F (1,107) =28.164, p<.oOl ).. Other vocabulary predictors could. not be used as autocorrelation was present. In other words, they were measuring the same thing. For Model 2 it was thought that the performance on the reaction time test (RTtest) would account for the next portion of the variance, it was added to Model 2. The results of the regression for model 2 indicated that RTtest accounted for an extra 6.9% of the variance (R2=.28, F (2, 106) =20.316, p<.OOl).. -188-. ( 15 ).
(16) MUlti-level components of L2 reading fluency: An exploration Andrew Atkins. Finally it was thought that performance on the speed of thinking test (STtest) could account for some of the variance, and it was added to model 3. STest did not account for a significant amount of variance in the model (R2=.28, F (3, 105). =13.596, p<.OOl) . It was found that vocabulary size as measured by the VST_1 t05 significantly predicted reading fluency as measured by TRmean (6 = .41, p<.OOl) , as did word recognition r eaction time as measured by RTtest (6 = -.27, p<.OOl), and as explained above, the negative correlation between the variables is the cause of the negative 6 -value. A further analysis to try to parcel out vanance accounted for by the aspect . of speeded decision tasks unrelated to alphabetic processmg was performed, but the effect was not statistically significant. 4.0 Disscussion. With regard to research question. L many of the variables correlate with. reading fluency, however the strength of the relationship also varies greatly. Many of the variables measured also correlate with each other, as in many cases they are measuring the same thing.. For example, the VST variables along with. the RTerrors variable are all full or part measures of vocabulary knowledge. They provide little unique insight into what, apart from vocabulary, is related to performance on the timed reading tests. This is in line though with Bernhardt (1991), that showed vocabulary to be the greatest predictor of English reading ability. The TR passages and tests themselves are another issue that must be considered when discussing the results. The data obtained was from a much larger study of timed reading performance, and for the purposes of that study participants are randomly assigned passages from a pool of passages in order to eliminate an order effect in the repeated measures. This is then averaged out over six to seven readings, but in this study the metric is only the mean of performance on two passages, so we should expect greater variability m. ( 16 ). -187-.
(17) x'#'. ~VIIJ '. X{t/ m 25 ~m 1 ~/ 2013. 8. performance than when averaged over more passages. Even with the greatest care taken to make the passages equivalent, there are so many factors that affect the difficulty that it is not possible to control for them alL Research question 2 asked "( w) hich of the measured predictor variables account for the most variation in reading fluency?", and the regression results suggested that receptive vocabulary, as measured by the first five levels of the VST account for the greatest amount of variance in the criterion variable for reading fluency, as measured by the mean words per minute for two 300-word, lexically controlled passages adjusted for comprehension. This accounted for 21% of the variance, far less than in Bernhardt (1991), although both studies found that vocabulary was the most influential predictor. The only other predictor that I was able to include in the regression that accounted for a small but significant amount of variance was the word recognition reaction time test. This accounted for 6.9% of the variance in the model, but this figure must be interpreted with discretion as in some cases fast reaction times came at the expense of a high number of errors, and vocabulary size had a large effect on errors made. In hindsight it would have been useful to have measured this variable with higher frequency words that participants would have been more likely to be certain of their knowledge. 5.0 Conclusions. Although the results of this study have suggested that vocabulary size and word recognition account for a significant proportion of reading fluency, the quality of the instruments used dictates the quality of the results. The dependent variable is perhaps not completely valid as it is really comparing apples with oranges as the participants actually read completely different passages on different subjects. This problem will be reduced in the parent study by using mean times for a series of readings. Reading fluency is a very personal thing and influenced by not only the text itself, but also what the reader brings to the text on a. -186-. ( 17 ).
(18) MUlti-level components of L2 reading fluency: An exploration Andrew Atkins. particular day. It would be better to assess it over a longer period of time and with a variety of passage themes, and perhaps try to control vocabulary more. It is also conceivable that the controlled nature of the texts reduces the influence of vocabulary size on performance, and this is worthy of further investigation. Although simplicity is often the best strategy in research design the complex nature of reading fluency makes simplicity untenable, and in this study more than 70% of the variance in the regression model is unaccounted for, which is comparable to Bernhardt's (1991) . Although, as discussed, the dependent criterion variable in this study may not be truly valid, it is also certain that other variables need to be measured, and these should include some measure of grammatical knowledge, some tests of a greater variety of individual differences, and some measure of cultural knowledge and schema for the passages used. Shiotsu (2009) used a more comprehensive battery of tests in his study and this study would benefit from some of those tests, especially the sentence-level reading ability test and a further word recognition exercise. Shiotsu (ibid) also makes the recommendation that "future research should employ standardized test scores or proficiency ratings" (p. 36), and although the VST is not standardized it has been used with thousands of students in Japan and around the world, and at least in part satisfies Shiotsu's recommendation. This study provides little in the way of pedagogical implications; however it has provided some valuable insight and knowledge that will be included in the parent study where some of the data used in this study was taken from.. The. parent study is a reading and writing fluency parallel growth study, and it is hoped it will provide some much needed information for L2, and especially EFL educators to help them prepare students to use language more fluently and effectively. Further examination of reading fluency and its component parts can only lead to greater understanding of what is needed in the classroom to create students who can use English to make their futures brighter.. ( 18 ). -185-.
(19) ::>z:'# . ~1JjIJ. . ::>z:1t / ~ 25 ~~ 1 !i5/ 2013. 8. References Atkins, A. & Cole, S. (2011 ). The development of an online timed reading program. CALL:. What's your motivation? 1-7. Bernhardt, E. B. (1991) . Reading development in a second language. Norwood, NJ: Ablex Publishing Corporation. Bernhardt, E. B. (2005) . Progress and procrastination in second language reading. Annual Review of Applied Linguistics, 25, l33-150. doi:l 0.1 Ol 7/ S0267190505000073. Bertram, R , Laine, M. & Virkkala, M. (2000) . The role of derivational morphology in vocabulary acquisition: Get by with a little help from my morpheme friends.. Scandinavian Journal of Psychology, 41, 287- 296. Brown, T., & Haynes, M. (1985). Litercy background and reading development in a second language. In H. Carr (Ed.), The development of reading skills (pp. 19-34) . San Francisco, CA: Jossey-Bass. Carver, R P. (1992) Reliability and validity of the speed of thinking test. Educational and. Psychological Measurement, 52 (1) , 125-l34. Champeau de L6pez, C. L. (1993) . Developing reading speed. English Teaching Forum, 31 (1), 50-51. Chang, A. c.-S. (2010). The effect of a timed reading activity on EFL learners: Speed, comprehension, and perception. Reading in a Foreign Language, 22 (2) , 284-303. Retrieved from http://nflrc.hawaii.edu/ rfl/ October20l0/ articles/ han.pdf Chung, M ., & Nation, 1. S. P. (2006) . The effect of a speed reading course. English Teaching,. 61 (4) , 181-204. Cobb, T . (2003). The Compleat Lexical Tutor. [Website] available online at http://www. lextutor.ca Day, R R, & Bamford, ]' (1998). Extensive reading in the second language classroom. Cambridge: Cambridge University Press. Fuchs, L., Fuchs, D., Hosp, M., & Jenkins, ]. (200l). Oral reading fluency as an indicator or reading competence: A theoretical, empirical, and historical analysis. Scientific Studies of. Reading, 5, 239-256.. -184-. ( 19 ).
(20) Multi-level components of L2 reading fluency: An exploration Andrew Atkins. Fuchs, L, Fuchs, L., & Maxwell, L. (1988). The validity of informal measures of reading comprehension. Remedial and Special Education, 9,20-28. Gorsuch, G., & Taguchi, E. (2008). Repeated reading for developing reading fluency and reading comprehension: The case of EFL learners in Vietnam. System, 36, 253-278. doi:210.1016/ j.system.2007.1009.1009. Gorsuch, G., & Taguchi, E. (2010). Developing reading fluency and comprehension using repeated reading: Evidence from longitudinal student reports. Language Teaching Research, 14 (1), 27-59. doi: 10.1177/ 1362168809346494.. Haynes, M. & Carr, T. H. (1990). Writing system background and second language reading: a component skills analysis of English reading by native speaker-readers of Chinese. In T. Carr & B. Levy (Eds.) , Reading and Its Development: Component Skills Approaches. (pp. 375-421). San Diego: Academic Press. Meara, P. (1996). The dimensions of lexical competence. In G. Brown, K. Malmkjaer and. J.. Williams (Eds.) Competence and Performance in Language Learning (pp. 35-53). Cambridge: Cambridge University Press. Nation, P. (2007). The Four Strands. Innovation in Language Learning and Teaching. 1 (1), 2-13. Osaka, M., & Osaka, N. (1992). Language-independent working memory as measured by Japanese and English reading span tests. Bulletin of Psycholomic Society. 30 (4),287-289. Samuels, S. J. (1979/1997). The method of repeated readings. The Reading Teacher, 50 (5), 376-381. Retrieved from http://www.li.suu.edu/ Library/ Circulation/ Angell/ educ6390va MethodofRepeatedReadings.pdf Samuels, S.. J. (1994). Toward a theory of automatic information processing in reading,. revisited. In R. Ruddell, M. Ruddell, & H. Singer (Eds.) , Theoretical models and processes of reading (4th ed., pp. 816-837). Newark, DE: International Reading Association. Schmitt. N., & Zimmerman, C. B. (2002). Derivative word forms: What do learners know? TESOL Quarterly, 36(2),145- 171. doi:lO.2307/ 3588328. Segalowitz, N. (2010). Cognitive bases of second language fluency. New York: Routledge. Shiotsu, T. (2009) Reading Ability and Components of Word Recognition Speed: The Case. ( 20 ). -183-.
(21) of L1-J apanese EFL Learners. In Z. Han and N.. J. Anderson (Eds.), Second Language. Reading Research and Instruction: Crossing the Boundaries (pp. 15-39). Ann Arbor: University of Michigan Press. Underwood, P., Myskow, G., & Hattori, T. (2012). The effect of speed reading instruction on Japanese high school students' English reading comprehension. Journal of International. Education Research, 8 (1) ,27-39. Utsu, M. (2004). Timed readings no riyou to sono kouka [Timed readings and their effects on students]. Bulletin of Yonezawa Women's College of Yamagata Prefecture, 39, 31-37. Utsu, M. (2005). Timed readings no riyou to sono kouka 2 [Timed Readings and their effects on students (Part II) ]. Bulletin of Yonezawa Women 's College of Yamagata. Prefecture, 40, 27-34. Waring, R. (1997) . Graded and extensive reading - Questions and answers. The Language. Teacher, 21 (5), 9-12. Webb, S., & Nation, I. S. P. (2008) . Evaluating the vocabulary load of written text.. TESOLANZ Journal, 16, 1-10. Wolf, M. & Katzir-Cohen, T. (2001 ). Reading fluency and its intervention. Scientific Studies. of Reading, 5 (3), 211-239.. -182-. ( 21 ).
(22) Multi-level components of L2 reading fluency: An exploration Andrew Atkins. Appendix A Items 1 to 20 of The Speed of Thinking Test (Carver, 1992). SAME 1 2. 3 4 5 6 7. 8 9 10 11 12 13 14 15 16 17 18 19 20. ( ( ( ( ( ( ( ( ( ( ( ( ( ( ( ( ( ( ( (. ) ) ) ) ) ) ) ) ) ) ) ) ) ) ) ) ) ) ) ). Sb bA Aa Sa aA Ab as bS aA Sa Aa Ab as Sb bS bA Sa Sb bS aA. DIFF ( ) ( ) ( ) ( ) ( ) ( ) ( ) ( ) ( ) ( ) ( ) ( ) ( ) ( ) ( ) ( ) ( ) ( ) ( ) ( ). Note. The complete test contains 184 items.. ( 22 ). -181-.
(23) :x::~. ~1JjIJ' :x::1t /~ 25;g~. 1 ~ / 2013. 9. Appendix B A sample reading passage used in the TR software.. Timed Reading The Inuit The fnul! live In Canada, GreenJand and the north of America. Theyfirsl arrived there about 5,000 years ago.. They lrve in a )snoof ice and snow, a land without trees. For n.lne long months of the year it f$ cold, dark winter; while summer Is only three. short months. Today, many I:n ult live modern lives In w-wnsand cities, but not so long ago the people liVed the way their parents and their parents' parents had Uvea for thousands of years. Uke many people all over the world, tl"te Inuit do not want to lose their :I anguages. There are about 90,000 people who speak Esldmo.A.leut languages and because there Is not much difference between Ille languages, peoprerrom different places can understand each other. They want to remember their oul1ure andtase!'! their ch[ldren the old ways. Most Inuit liVed in small groups of only a few families. Many of these groups ]ived near the sea because most .o f their food came from there • .Beoausethe wealller was too cold! to grow anything, thelr food was the Hsb and: animals that they oo.u.ght. Other Inuit moved from place do place follOwing the anlmals oolfed cariboU, which made up the biggest part of their food. Sometimes the 1nuft boiledthefr rood but ofienil was not cooked at aU. Because it was always very cold , tbe !nult had to wear th!ok, warm clothes. The women made Clothes from the skins of animals. Each piece of clothing cou[d take weeks or eVen months to make and they could be very beautiful. Mothers wore special clothes 00 they could carry their babies on their backs against their skin to keep them warm and safe. Now the Inuit way of life is changing but the o ld ways are remembered and valued,. -180-. ( 23 ).
(24)
図
関連したドキュメント
If condition (2) holds then no line intersects all the segments AB, BC, DE, EA (if such line exists then it also intersects the segment CD by condition (2) which is impossible due
Let X be a smooth projective variety defined over an algebraically closed field k of positive characteristic.. By our assumption the image of f contains
Consider the Eisenstein series on SO 4n ( A ), in the first case, and on SO 4n+1 ( A ), in the second case, induced from the Siegel-type parabolic subgroup, the representation τ and
The theory of log-links and log-shells, both of which are closely related to the lo- cal units of number fields under consideration (Section 5, Section 12), together with the
We relate group-theoretic constructions (´ etale-like objects) and Frobenioid-theoretic constructions (Frobenius-like objects) by transforming them into mono-theta environments (and
The theory of log-links and log-shells, which arise from the local units of number fields under consideration (Section 5), together with the Kummer theory that relates
The theory of log-links and log-shells, both of which are closely related to the lo- cal units of number fields under consideration (Section 5, Section 12), together with the
While our Code does not cover all of the legal or ethical situations that we might face, it embodies ethical guidelines for each of us to apply in our day-to-day business
