Congestion Alleviation Scheduling Technique for Car Drivers Based on
Prediction of Future Congestion on Roads and Spots
Hisaka Kuriyama, Yoshihiro Murata, Naoki Shibata
†, Keiichi Yasumoto, Minoru Ito
Graduate School of Information Science, Nara Institute of Science and Technology, Ikoma, Nara 630–0192, Japan Email:{hisaka-k, yosihi-m, yasumoto, ito}@is.naist.jp
† Department of Information Processing and Management, Shiga University,
Hikone, Shiga 522–8522, Japan Email: shibata@biwako.shiga-u.ac.jp
Abstract— In arranging efficient touring to various areas
in urban areas, taking into account potential congestion is needed in order to schedule the order of these visits it is important to on the roads used and at the places to be visited. A number of scheduling methods have been proposed for finding (1) a noncongested route by sharing route information among users, or (2) a schedule to alleviate congestion at specific places based on the latest congestion information. However, these methods do not suffice since they do not deal with, simultaneously, congestion on road and at sites visited. In this paper, we propose a method of finding schedules for thousands of users by predicting, in advance, both types of congestion. Using the predicted results, the method adjusts each user’s provisional schedule by changing visiting order of places, and reducing their number in keeping with each user’s preferences. We have implemented the proposed method and evaluated it by simulations. The results showed it to achieve higher user satisfaction than existing methods.
I. INTRODUCTION
Traffic jams and congestion at service spots in urban areas interfere with smooth social activities. There have been many efforts to alleviate congestion by making use of information technologies. Whereas car navigation systems used to aim only at calculating the shortest route between two locations and navigating drivers along the route, with the progress of ITS technology, the latest car navigation systems are more intelligent. For example, a system selects a route which avoids congested areas using traffic jam information gathered by sensors installed on the roadside. However, if most of the cars are equipped using navigation systems with this kind of route selection method, the route indicated by the system will quickly become congested [1], since these systems may indicate the same route to many users. To solve this problem, Yamashita et al. have proposed a technique which allows drivers to share route information and select their routes to avoid congestion [2].
Services such as parking lots, restaurants, and theaters in urban areas can also get congested, and scheduling to alleviate these congestions is another problem. Kawamura et al. have proposed a technique which alleviates concentration in specific areas of theme parks by distributing visitors among attractions [3], [4].
These existing studies merely aim at alleviating congestion of either routes or destinations. However, for more effective congestion alleviation, in cases such as sightseeing tours and parcel deliveries in which users visit multiple destinations,
it is desirable to design and develop a scheduling method that takes into account congestion both on routes and at destinations. We also have to consider time constraints, such as when users have to reach the final destination before a specified time.
In this paper, we propose a method for scheduling visits and the routes used for each of several thousands of users, which satisfies their needs as much as possible, while avoid-ing congestion. Given the tour plans of users in advance, the proposed method predicts congestion on each road and at each destination for every second and generates a feasible schedule for each user by modifying each plan so that the user can visit as many places as possible within the overall constraints. We have developed a heuristic algorithm to determine schedules of users from a given road network with service spots and tour plans of the users. The algorithm iteratively removes the least important spot from each user’s plan so that the set of modified plans of all users satisfies time constraints, taking into account the capacity of the roads and the destinations.
We evaluated the algorithm through simulation, and con-firmed that the proposed method achieves higher user sat-isfaction than existing methods when thousands of users simultaneously make a tour of multiple destinations. We also confirmed that users who follow the indications of our method tend to find higher satisfaction than the users who do not. This will be on incentive to use the proposed method.
II. RELATED WORK
There are several studies on congestion-aware scheduling methods for traveling multiple spots in road networks and/or sightseeing resorts.
In [2], Yamashita et al. have proposed a route scheduling method which allows users to select different routes by sharing route information with each other.
In [3], [4], congestion-aware scheduling methods for a large theme park have been proposed. In [3], Kawamura et al. have shown that a user’s average waiting time can be de-creased by making each user obtain congestion information through a mobile terminal and visit the least congested spot, if each attraction has a different service time.
These studies do not take into account of congestions both at destinations and on routes, also they make decisions only according to the latest congestion information. However, in
order to dissolve congestions in actual cases, such as business activities in urban areas or sightseeing in holiday seasons, we need to distribute congestion over space and time. We propose a method which greatly differs from these existing studies, which tries to resolve congestion by predicting the future condition of roads and destinations.
III. ASSUMPTIONS
Our method aims to alleviate congestion around business activities in urban road networks and sightseeing areas where each user visits multiple destinations and receives services. We refer to the destinations as service spots or spots. We assume that cars are used to move between destinations, and that users impose no restriction on the order of places to visit.
We assume that each service spot has a constant time duration to provide service to a user, which we call service time. For example, time to see sights, time to finish dining at a restaurant, and time to negotiate with a customer are all regarded as service time. After a user spends the specified service time at a spot, the user moves to the next destination. When the user has visited all spots planned, he/she goes to the final spot and finishes the activity.
If many users converge on a road, their moving speed of the users decreases according to the capacity of the road and the number of users. When many users converge on a service spot, they will form a long queue, waiting, according to the capacity and the service time of the spot. In Sect. 4 and 5, we introduce the models for these congestions.
IV. PROBLEMDEFINITION
In this section, we formulate and define the scheduling problem explained in Sect. 3. Each user inputs: a starting location, a set of service spots the user wishes to visit, importance degrees for the spots (values representing how important each spot is), and the final destination and fin-ishing time, representing the latest time to reach the final destination. When each user receives a service at a spot, the user obtains the score equal to the importance degree specified for that spot. If the service does not finish before his/her finishing time, the user does not obtain the score for the spot.
The goal of the proposed method is to find a set of schedules for all users which maximizes the total sum of the scores which the users obtain, from the database information and the user requests. The details of input and output of the problem are defined in Sect. 4.A and 4.B, respectively. A. Input
Let U = {u1, ..., un} be the set of all users. The input
consists of database information and user requests, which are defined below.
Database information: The map G and service spots D are given as database information.
• G = (V, E) denotes the target road network where V
andE are the set of intersections and the set of links (i.e., roads), respectively. The length of each linke ∈ E
is given in advance. The moving speed of users ate is calculated using the traffic flow model explained in Sect. 5, according to the number of users and link capacity.
• D = {d1, ..., dm} ⊆ V denotes the set of all service
spots.di.cap and di.st denote the capacity and service
timeof spot di, respectively. The capacity is the
max-imum number of users the spot can accommodate at the same time. The service time is the time required to receive the service from the moment of starting to receive the service. When a user arrives at a spot, if the number of users who are receiving service at the spot is less than its capacity, the user starts to receive the service immediately. Otherwise, the user is added to the end of a waiting queue. When a user finishes receiving service, another user at the top of the waiting queue starts to receive the service. Each user in the queue just waits until he/she starts to receive the service.
User request: The requirement of each user u ∈ U consists of the following items and they are given byu.
• startu is the starting location.
• Du⊆ D is the set of spots which u wants to visit. • for each d ∈ Du, impu(d) is the importance degree
representing how importantd is for u to visit.
• goalu is the final destination.
• impu(goalu) is the importance degree of final
destina-tiongoalu.
• time(goalu) is the finishing time, which represents the
latest time whenu wants to reach goalu.
We assume that each useru specifies different importance degrees for each spot inDu. For keep fairness among users,
we assume that each useru has the same points (e.g., 100) and distributes them to the spots to visit so that the following equation holds.
X
d∈Du
impu(d) + impu(goalu) = 100 (1)
B. Output
We assume that each user u obtains the same points as the importance degree of spotd if u receives the service at d before time(goalu). The total sum of points each user u
obtains is regarded asu’s satisfaction degree. Each user u can request visiting any subset of D, but u cannot always visit all requested spots due to moving time, waiting time at spots, and time restrictiontime(goalu). If all users try force fully to
visit all of the requested spots, roads and spots will become more congested, and thus each user’s satisfaction degree will decrease. We alleviate this situation by having users renounce some of their requested spots. The output of the problem is the set of schedules denoted by S = hs1, ..., sni where si
denotes the schedule of user ui ∈ U . Schedule si is an
ordered list of spots which is the subset ofDu, and denoted
by hdu
1, du2, ..., dului where d
u
j ∈ Du, duj represents the j-th
visiting spot,du
lu isgoalu, and the time foru to reach goalu is no later thantime(goalu).
We want to findS which maximizes the total sum of points all users obtain. So, we use the following objective function.
maxX u∈U lu X i=1 impu(dui) (2)
V. USER BEHAVIOR MODEL
In this section, we describe the traffic model and the strategies to choose the route between two locations. They are used in the proposed method.
A. Traffic model
We use the flow model referred to in [2] to implement our proposed method, where we do not consider the following factors: traffic signals, behavior of users turning at intersec-tions, in multiple lanes, and so on. In our model, each link is divided into fixed-length blocks. Each block is assigned a unique ID number. The block with ID number n is denoted by blockn, hereafter. The length of block n and the number of users on blockn are denoted by Ln andNn, respectively.
DensityDn of blockn is defined as NLnn. The speed of users
Vn in blockn is defined by the following formula.
Vn = Vnf ree(1 −
Dn
Dmax n
) (3)
In the formula, Vf ree
n is the free flow speed, which is the
speed of users in the case of zero density, andDmax n is the
maximum density above which the speed of users becomes zero. In the proposed method, we assume that these values are constants, and we set Vf ree
n = 13.89m/s and Dmaxn =
0.14. We also set Ln to be the distance made by 5 seconds
of movement at the speed ofVf ree
n for eachn.
The traffic simulation is performed as follows. For each block i, Vi is updated once per simulation step, where one
simulation step is one second. A user running on block i moves at Vi of speed. When the user moves into the
neighboring block m, if the density of block m exceeds Dmax
m , the user stops at the border of the block until the
congestion is cleared.
B. Choosing a route between two locations
Below we describe some methods proposed in [2] for choosing a route between two locations.
Route Information Sharing (RIS): This is a method to choose the route to minimize the overlap of routes chosen by users. In RIS, a server, called the route information server, is used to mediate among users. First, each user sends, to the route information server, the route to the destination with the shortest expected arrival time. The server collects the routes from users and estimates, for each link, how many users will follow the link, taking into account that some of the users may take a detour. Then, each user is informed of the number of users expected to follow each link from the server, and selects the route with the lowest congestion. Below, we explain RIS more formally.
For each useru, a route to the destination is denoted by a list ofp links (l1, ..., lp) where liis thei-th link of the route.
Since u may change the route at every intersection due to congestion or other reasons, the probability ofu continuing
on to a further link should be smaller than the nearer link. So, passage assuranceP Au,li of useru regarding link li is defined as follows.
P Au,li = (p − i)
p (4)
Total passage assuranceT P Alof linkl (which represents
the expected number of users following link l) is defined as the sum of passage assurance of all users Ul who pass
through the linkl as follows. T P Al=
X
u∈Ul
P Au,l (5)
EP Tl is the expected passing time of link l based on
the current traffic congestion provided by a system such as VICS (Vehicle Information and Communication System) [7]. Finally, the expected traffic congestion ET Cl of link l is
defined as the product of the expected passing time and the expected number of users by the following formula.
ET Cl= EP Tl· (T P Al+ 1.0) (6)
Here,+1.0 is used to prevent ET Cl from being 0 since
ET Cl is defined in order to represent the expected time to
pass through the linkl.
Each user sends the passage assurance of each link to the server at every intersection. The server calculates the expected traffic congestion of each link and broadcasts it to the users. Each user receives the expected traffic congestion on each link, selects the route with the shortest expected passing time based on the congestion information, and sends the route to the server. This is done whenever each user passes on intersection.
VI. PROPOSED METHOD
In this section, we describe the outline of the proposed method, the scheduling algorithm and the compensation for unpredictable congestion.
A. Outline
In the proposed method, we assume that each user has a wide-area wireless communication device such as a cell phone or WiMAX. Before departure, users input the spots of their tour plans and the importance degrees, as explained in Sect. 4. This information is sent to the central server. The server predicts congestion of routes and spots based on the users’ requests. Then, the server makes changes in each user’s schedule by modifying the order of visiting spots, the routes between each two spots and the number of visiting spots. The server tries to find the set of schedules for all users which allows the users to reach their final destinations by the specified time and maximizes their satisfaction degree. Finally, the server sends the resulting schedules to all the users.
B. The algorithm for modifying tour schedules Below we describe the outline of the algorithm..
1) For each user, find the tour (i.e., an ordered list of routes between every two spots to connect all spots by a single stroke of the brush) which minimizes the total distance of movement through all the requested spots. This is Travelling Salesman Problem (TSP) and we use a heuristic algorithm such as in [5] to solve it. 2) Perform simulation based on the routes generated by step 1), and predict congestion of all places (i.e., links and spots) at this simulation step. The simulation is performed assuming that all users follow the traffic model in Sect. V.A, use RIS to choose routes to their next destinations, and consume some time to wait and/or receive services at spots according to the model described in Sect. 4.A.
3) For each user, calculate the time when the user reaches the final destination, and the total sum of importance degrees of visited spots.
4) For each user, change the set of spots to be visited, and their order according to the method described later, and find the shortest time tour for each user with the modified set of spots.
5) Iterate steps 2) to 4) until the schedules are not changed in these steps or the predetermined time expires. The resulting schedules are sent to users.
Below, we describe how the set of visiting spots and their order are changed.
In order to make all users reach the final destination by the finishing time, if the algorithm detects a user who is not able to reach the final destination by the finishing time according to the current schedule, the schedule is modified, decreasing the number of spots for the user. For each of such users, the algorithm removes a spot and calculates new routes. Based on the congestion calculated using the models in Sect. 4.A and Sect. 5, the algorithm chooses one spot to remove, so as to minimize a loss of the user’s satisfaction degree. After adjusting routes for all users, the system performs a simulation again. If some users are still unable to reach the final destination by the specified time, then a spot of each of these users is removed in similar way. On the other hand, if some users are able to reach the final destination until the specified time even if visiting extra spots already removed, then these spots are added again.
With the algorithm described above, the schedules might not converge. In the proposed method, we use a tabu list to improve convergence. For each user, if the system repeats adding and removing the spot a predetermined number of times, this spot is added to the tabu list for the user. A spot on the tabu list will never be added for the user.
C. Compensation for unpredictable congestion
We have to consider the unpredictable congestion caused by users who do not use the proposed system, in order to enable its gradual deployment. In the proposed system, we compensate for unpredictable congestion by extending the
range of the predicted congestion. For the purpose, we use safety margindefined as follows.
saf etymargin = 1 +non user num
user num · β (7) When congestion is predicted by simulation, we compen-sate by multiplying the safety margin by density of each block, and also by multiplying a reciprocal number of the safety ratio by the capacity of each spot. In the definition, user num and non user num are the numbers of users who do utilize and do not use the proposed system, respec-tively. We presume that non user num can be estimated using a system like VICS, whereβ is a given constant.
VII. EXPERIMENTALVALIDATION
We conducted experiments through simulations to show the usefulness of our method in terms of the following four metrics: (1) satisfaction degree (score obtained by user) (2) incentive for users to follow the schedules computed by our method; (3) tolerance even when some users do not use our method; and (4) feasibility even when new users are added to the road network incrementally.
For simulation, we have developed a simulator in Java, and executed it on a PC with Core2Duo 2.4GHz, 1024MB Memory running WindowsXP pro.
A. Simulation configuration of existing methods
Existing algorithms explained in Sect. 5 aim only at alleviating congestion either in routes or at service spots. Therefore, without extension, they cannot be applied to computing a schedule for each user as an ordered list of spots with paths for moving between those spots. Below, we explain an extended version of the existing algorithm (RIS) to compute the schedules explained in Sect. 3. We use this extended version named E-RIS for the baseline to evaluate the usefulness of our proposed method.
Behavior of E-RIS: The input and the output of the algorithm E-RIS are the same as our method described in Sect. 4. Each user executes the algorithm at the starting location or whenever the user reaches each spot, in order to select the next visiting spot.
Suppose that user u is at spot d ∈ {startu} ∪ Du. Let
Fu⊆ Dudenote the set of spots whichu has already visited.
First,u estimates time to reach each spot du
i ∈ Du−Fufrom
d using the following formula,
reachi= move(d, dui) + stay(d u
i) (8)
where move(d, du
i) is the estimated time to move from
spot d to spot du
i on the path computed by the algorithm
(RIS), andstay(du
i) is the sum of the estimated waiting time
and the service time at spot du
i. The waiting time at spot
du
i is estimated by the formula,
queue length(du i)·d u i.st du i.cap where queue length(d) represents the length of spot d’s waiting queue which is supposed to be known by each user. Letdu
m
denote the spot that reachm is the minimum among spots
TABLE I
ACOMPARISON RESULT WITH THE EXISTING METHOD
ave. num. ave. num. of ave. num. of visited spots score of
visited within excess
spots finishing time users
500 (E-RIS) 4.006 3.664 74.4 110
500 (Our method) 3.842 3.826 94.7 7
1000 (E-RIS) 3.287 2.927 58.2 233
1000 (Our method) 2.909 2.834 72.5 44 Secondly, useru checks if the finishing time to reach the final detinationtime(goalu) is preserved even after u visits
du
mby the inequality
CT + reachm+ α · move(dum, goalu) ≤ time(goalu) (9)
whereα is a constant no less than 1 representing the safety margin.CT is the current time. If the above inequality does not hold for du
m,u checks if the inequality holds for other
spots in the earlier order of their estimated reaching time. If there is no spot to satisfy the inequality,u gives up visiting further spots and goes to the final destinationgoalu.
We think that E-RIS is close to the behavior of most of ordinary users since such users visit the least crowded spot first, and return their final destinations when finishing time approaces.
B. Input data
As map data, we used a road network in Fig. 1, which has 56 links whose total length is 59.6 Km, 32 nodes, and 831 blocks. The service time and capacity of each spot are set at random between 600 to 1,800 seconds and between 10 and 30 users, respectively. The above values were determined so that each user would have to wait for a while before receiving the service if 500 users are distributed evenly among all spots. The requirement of useru is as follows. The number of spots thatu wants to visit (|Du|) is 4. The starting
location startu, each spot d ∈ Du, the importance degree
of spot impu(d) and that of final destination impu(goalu)
were determined at random so as to satisfy equation (1). We assumed that startu = goalu. The finishing time to
reach the final destination time(goalu) is set to the time
to return tostartu after visiting (and receiving services at)
all spots ofDustarting fromstartu, supposing that there is
no congestion on the road network nor at spots. According to preliminary experiment, we set the maximum number of items in each tabu list to be 1.
C. Experimental results
Experiment 1: comparison with E-RIS: In this experiment, all users use the same algorithm (E-RIS or our method) and they start to move at the same time. The results are shown in Table I, where ave. score is the average points obtained by each user, ave. num. of visited spots is the average number of spots (including final destination) visited by each user, ave. num. of visited spots within finishing timeis the average number of spots (including final destination) visited by each user untiltime(goalu), and ave. excess users is the number
of users which could not reach their final destinations on or before their finishing time.
Fig. 1. Road Network used for Simulation
Fig. 2. Ratio of neglecting users who had disadvantage The proposed method achieves a 20-30% higher average score than E-RIS. The average number of visited spots is less than E-RIS, but the average number of visited spots by finishing time is higher than E-RIS in many cases. In the case of 1,000 users, the average numbers of visited spots of E-RIS are higher than our proposed method. This is because our method reduces the number of visiting spots so that users will reach their final destinations on time. Thus the average score of our method is higher than E-RIS. This shows that users could visit most of spots with high importance degrees. In the cases of both 500 and 1,000 users, our method is superior to E-RIS in terms of the number of users who could not reach their final destinations before the finishing time. The computation time needed to perform our algorithm was 4 minutes for 500 users and 5.5 minutes for 1,000 users.
Experiment 2: Evaluation of incentive: In the proposed method, we assume that users follow the schedules computed by the algorithm. However, if some of the users outwit the algorithm by forcing their own strategies and obtaining better results, they would ignore the computed schedules. An incentive to follow the computed schedules is required. To evaluate the incentive value of our proposed method, we simulated situations in which some of the users ignore the computed schedules and force their original tour plans by using E-RIS. We did this by changing the ratio of such users from 10% to 90% for the cases of both 500 users and 1,000 users. We measured the ratio of neglecting users who could not improve score nor reach the final destination on or before the finishing time to all the neglecting users.
The results are shown in Fig. 2. More than 70% of neglecting users could not improve their score nor reach the final destination by the finishing time. The degree of reduction is remarkable when the number of users is 500. These results suggest that the proposed method should give users the incentive to follow the computed schedule.
Experiment 3: Evaluation of tolerance of our method against the diffusion ratio: It might not be realistic to assume
Fig. 3. Performance of our method when E-RIS users co-exist(500 users)
Fig. 4. Performance of our method when E-RIS users co-exist(1,000 users) that all users will use our proposed method and/or start their tours at the same time. Therefore, we measured the average score of each user for the cases in which some users use our proposed method and the others use E-RIS, and that users are added to the road network incrementally (see experiment 4), by changing the ratio of users with our method to all users. According to preliminary experiment, we set safety marginβ to be 0.5.
The results are shown in Figs. 3 and 4. In case of 500 users, the average score is high enough apart from the ratio of those using our method, and the number of users who exceeded finishing time is reasonably small. In case of 1,000 users, congestion at each spot became chronic when the ratio was less than 40%, where the average score with our method was less than E-RIS. However, average scores of users on our method is higher than that of E-RIS when the ratio of users with our method is more than 40 (See Fig. 4). The number of users who overrun the finishing time is also less than that of E-RIS. From the results, our proposed method is considered to be more advantageous than E-RIS for most cases.
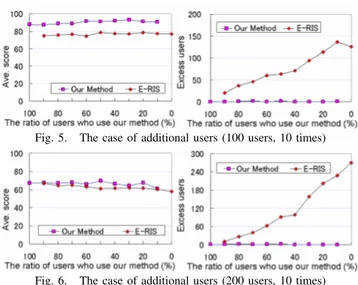
Experiment 4: Evaluation when users are incrementally added: In this experiment, we considered the model that new users are incrementally added on the road network. New users were added to random positions every 600 seconds. When new users are added, all users using the proposed method re-calculate schedules. 100 or 200 users are added at once unless the number of users exceeded 1,000 or 2,000. As in experiment 3, some users used our method and the others users used E-RIS. We changed the ratio between the algorithms from 10% : 90% to 90% : 10 %. The results are shown in Figs. 5 and 6. In the case of adding 100 users at one time, our method was superior to E-RIS. In case of
Fig. 5. The case of additional users (100 users, 10 times)
Fig. 6. The case of additional users (200 users, 10 times) 200 users, the superiority of our method decreased, due to chronic congestion at many spots.
However, most of the users using our method could reach the final destination within their finishing time.
VIII. CONCLUSION
In this paper, we proposed a congestion-aware scheduling method for scheduling visits for several thousands of users. By predicting the congestion of routes and spots by simu-lation, the proposed algorithm finds schedules for all users which alleviate congestion.
Our evaluation experiments showed that with the proposed method, (1) users are able to visit spots important to them more readly than with E-RIS, leading to 20 to 30% higher satisfaction, (2) users can be modified to follow the output schedules and (3) even if there are users who do not utilize the method, or the ratio of such users is changed, the proposed method calculates effective schedules.
For future work, we are planning to implement a more practical and accurate traffic model.
REFERENCES
[1] Mahmassani, H. S. and Jayakrishnan, R.: “Systam Performance and User Response under Real-time Information in a Congested Traffic Corridor,” Transportation Research, Vol. 25A, pp. 293-307 (1991). [2] Yamashita, T., Izumi, K., Kurumatani, K. and Nakashima, H.: “Smooth
Traffic Flow with a Cooperative Car Navigation System,” Proc. of
the fourth international joint conference on Autonomous agents and multiagent systems, pp. 478-485 (2005).
[3] Kawamura, H., Kataoka, T., Kurumatani K. and Ohuchi A.: “In-vestigation of Global Performance Affected by Congestion Avoiding Behavior in Theme Park Problem,” IEEJ Transactions on Electronics,
Information and Systems, Vol. 124, No. 10, pp. 1922-1929 (2004). [4] Kataoka, T., Kawamura H., Kurumatani, K. and Ohuchi, A.:
“Dis-tributed Visitors Coordination System in Theme Park Problem,” Proc.
of International Workshop on Massively Multi-Agent Systems, pp. 105-119, (2004).
[5] Maruyama, A., Shibata, N., Murata, Y., Yasumoto, K. and Ito, M.: “P-Tour: A Personal Navigation System for Tourist,” Proc. of 11th
World Congress on ITS, vol. 2, pp. 18-21, (2004).
[6] Horiguchi, R., Kuwahara, M. and Nishikawa, I.: “The Model Val-idation of Traffic Simulation System for Urban Road Networks: ’AVENUE’,” Proc. of the Second World Congress on Intelligent
Transport, Vol. 4, pp. 1977-1982 (1995).
[7] Vehicle Information and Communication System Center: VICS HOME PAGE, http://www.vics.or.jp/.