Ligand Specificity in Force-induced
Differentiation of Embryonic Stem Cells
著者
宇田 侑平
学位授与機関
Tohoku University
TOHOKU UNIVERSITY
Graduate School of Biomedical Engineering
Ligand Specificity in Force-induced Differentiation of
Embryonic Stem Cells
(力学刺激負荷による胚幹細胞分化のリガンド特異性に関する研究)
A dissertation submitted for the degree of Master of Science (Biomedical Engineering)
Department of Biomedical Engineering
by
Yuhei UDA
修了年度 2011 年度 教育課程 博士課程前期 2 年の課程 Abstract
Title: Ligand Specificity in Force-induced Differentiation of Embryonic Stem Cells Author: Yuhei UDA
Supervisor: Masaaki SATO
Increasing evidence suggests that mechanical factors play a critical role in lineage determination of stem cells. Recently it has been demonstrated that a local force applied via Arg-Gly-Asp (RGD)-containing peptides to mouse embryonic stem (mES) cells increases cell spreading and cell stiffness and downregulates Oct3/4 (Pou5f1) gene expression. However, it is not clear whether the effects of the applied stress on these functions of ES cells can be extended to natural extracellular matrix proteins or cell–cell adhesion molecules. Here I showed that a local cyclic shear force applied via fibronectin or laminin to integrin receptors increased cell spreading and stiffness, downregulated Oct3/4 gene expression, and decreased cell proliferation rate. In contrast, the same cyclic force applied via cell–cell adhesion molecule E-cadherin (Cdh1) had no effects on cell spreading, Oct3/4 gene expression, and the self-renewal of mES cells, but induced significant cell stiffening. These findings demonstrate that biological responses of ES cells to force applied via integrins are different from those to force via E-cadherin, suggesting that mechanical forces might play different roles in different force transduction pathways for the early embryogenesis.
アブストラクト 論文題目: 力学刺激負荷による胚幹細胞分化のリガンド特異性に関する研究 提出者名: 宇田侑平 指導教員: 佐藤正明 これまでの研究により,力学的因子が幹細胞分化に重要であることが示唆されてい る.近年,マウス胚幹(mES)細胞表面にアルギニン-グリシン-アスパラギン酸(RGD) 配列を含む合成ペプチドを介して力学刺激を負荷した際,細胞面積および細胞剛性が増 加し,Oct3/4(Pou5f1)の発現が抑制されることが報告されている.しかし,このよう な合成ペプチドを介した力学刺激に対する細胞応答が,細胞外基質タンパク質や細胞間 接着分子などを介した力学刺激に対しても同様に生じるかについては明らかになって いない.本研究では, mES 細胞表面にフィブロネクチンやラミニンおよび E-カドヘ リンを介して力学刺激を負荷した.その結果,フィブロネクチンおよびラミニンを介し て力学刺激を負荷した細胞では,細胞面積や剛性の増加および Oct3/4 の発現抑制が見 られた.一方,E-カドヘリンを介して力学刺激を負荷した細胞では,細胞剛性の増加 は見られたが,細胞面積や細胞増殖能および Oct3/4 の発現量において変化は見られな かった.これらの結果から,インテグリンおよび E-カドヘリンを介して負荷した力学 刺激に対し,ES 細胞は異なる生化学的応答を示すことが明らかとなった.また,異な る経路を介した力学刺激が,初期胚形成において異なる役割を担うことが示唆された.
i
TABLE OF CONTENTS
CHAPTER 1
INTRODUCTION ··· 1
1.1 Stem cells ··· 1
1.1.1
Embryonic stem cells ··· 1
1.1.2
Adult stem cells ··· 2
1.2 Soluble factors influence pluripotency and differentiation of stem cells ···· 3
1.3 Mechanical factors are critical in stem cell differentiation ··· 4
1.4 Objective and outline of this thesis ··· 9
CHAPTER 2
EMBRYONIC STEM CELLS STIFFEN IN RESPONSE TO
MECHANICAL FORCE
··· 11
2.1 Introduction ··· 11
2.2 Materials and methods ··· 11
2.2.1
Cell culture ··· 11
2.2.2
Polyacrylamide gel making ··· 12
2.2.3
Bead coating ··· 14
2.2.4
Applying a local cyclic stress using magnetic twisting cytometry ··· 14
2.2.5
Cell stiffness measurement ··· 18
2.2.6
Quantification of bead binding specificity ··· 19
2.3 Results ··· 20
2.3.1
Ligand-coated beads interact with specific receptors on the cell
surface ··· 20
2.3.2
Stress-induced stiffening of ES cells ··· 22
2.4 Discussion ··· 25
ii
CHAPTER 3
THE EFFECT OF MECHANICAL STRESS ON EMBRYONIC STEM
CELL SPREADING AND DIFFERENTIATION ··· 27
3.1 Introduction ··· 27
3.2 Materials and methods ··· 27
3.2.1
Cell culture ··· 27
3.2.2
Applying a local cyclic stress using magnetic twisting cytometry ··· 27
3.2.3
Fluorescent staining ··· 29
3.3 Results ··· 29
3.3.1
Stress applied via integrins but not E-cadherin induces ES cell
spreading and slows down the cell proliferation rate ··· 29
3.3.2
Force applied via integrins but not E-cadherin induces
differentiation of ES cells ··· 31
3.4 Discussion ··· 34
3.5 Conclusion ··· 35
CHAPTER 4
CONCLUDING REMARKS ··· 36
REFFERENCES ··· 37
ACKNOWLEDGEMENTS ··· 45
- 1 -
CHAPTER 1
INTRODUCTION
1.1 Stem cells
Stem cells are one of the major focuses in biology and experimental medicine due to their remarkable potential to reproduce themselves and develop into many different cell types in the body during the early development and growth. When stem cells divide, each cell produced has the potential either to remain the same stem cells or become another cell type possessing more specialized functions such as muscle cells, red blood cells, or brain nerve cells. Until recently, scientists have extensively studied two kinds of stem cells from animals and humans: embryonic stem cells and non-embryonic (adult) stem cells.
1.1.1
Embryonic stem cells
Embryonic stem (ES) cells are pluripotent stem cells derived from the inner cell mass (ICM) of embryos during the blastocyst stage [1,2] (Fig. 1-1) ES cells have two remarkable characteristics that distinguish them from all other organ-specific stem cells. First, they can self-renew almost indefinitely by replicating themselves and dividing into the same non-specialized cell type for extended periods of time. This ability allows ES cells to be maintained and expanded as pure populations of undifferentiated cells for the long term in vitro culture. Second, they are pluripotent, meaning that they can differentiate into virtually any cell types of an organism. Under appropriate culture conditions, ES cells are able to develop into all three primary germ layers: ectoderm, mesoderm, and endoderm, and eventually give rise to any tissues and organs of the body [3,4]. For example, the ectoderm gives rise to peripheral and central nervous systems and to epidermal tissues [5,6]. The mesoderm develops into muscle, bone, cartilage, blood, and connective tissues [7,8]. The endoderm develops into pancreas and liver cells [9,10]. Due to these remarkable characteristics, ES cells have provided an in vitro model for understanding the early embryonic development and represented a new source of differentiated cell types for ES cell-based therapies [11-13].
It is known that transcription factors that bind to DNA sequences to regulate specific gene expression are crucial for the early embryonic development and lineage specification of ES cells [14]. Oct3/4 (also known as Pou5f1), one of the transcription factors, is essential for the initial formation of a pluripotent cell population in the ICM [15]. In addition, the expression level of
- 2 -
Oct3/4 is crucial for self-renewal and differentiation of ES cells [16] (Fig. 1-2). To maintain the
undifferentiated ES cell phenotype, Oct3/4 expression must remain within plus or minus 50% of normal expression level. A more than 50% increase in Oct3/4 expression causes differentiation into primitive endoderm or mesoderm, whereas repression of Oct3/4 reduces pluripotency and leads to the dedifferentiation into trophectoderm (Fig. 1-2). Therefore, Oct3/4 has been considered as one of the marker proteins for pluripotency of ES cells.
1.1.2
Adult stem cells
Adult stem cells (also known as somatic stem cells) are undifferentiated stem cells found Figure 1-1 Schematic of the ES cell derivation and the cell-based therapy (Modified from Wobus and Boheler 2005 [11]). Fertilized eggs rapidly divide into many cells (morula) within a few days and form blastocysts composed of the outer layer cells (trophoblast) and the undifferentiated inner cells (inner cell mass; ICM). ES cells are derived from the ICM and subsequently differentiated in vitro into the desired cell types to generate tissues or organs for transplantation.
- 3 -
in organs and differentiated tissues with limited capacity for both self-renewal and differentiation unlike ES cells, meaning that they can only divide and replicate themselves a finite number of times and can only differentiate into a limited number of cell types related to the organs or tissues that the stem cells originally came from [17].
There are many different types of adult stem cells in different parts of the body, including bone marrow, muscles, and the central nervous systems [17]. Mesenchymal stem (MS) cells, for instance, are one of the adult stem cells found in bone marrow [18], and they can develop into the organ-specific cells or tissues such as neural cells, bones, cartilages, and tendons [17]. Since the techniques for isolation and amplification of MS cells have been well established and it is comparatively easy to maintain and expand them in culture [19-21], MS cells have been studied in detail and used in medical treatment for variety of diseases such as diabetes and myocardial infarction [22,23].
1.2 Soluble factors influence pluripotency and
differentiation of stem cells
Since the first isolation of stem cells, many studies have been conducted to adapt the cells to in vitro culture and control their lineage specification [1,2], and it has been demonstrated that soluble factors, including serum and growth factors, influence pluripotency and differentiation Figure 1-2 The expression level of Oct3/4 governs the three distinct fates of ES cells (Adapted from Niwa et al. 2000 [16]). To maintain the self-renewal capacity of ES cells, the Oct3/4 expression must remain within plus or minus 50%. ES cells differentiated into the primitive endoderm or mesoderm if the Oct3/4 expression is increased more than 50%, whereas those dedifferentiated into the trophectoderm lineage if the Oct3/4 expression is decreased less than 50%.
- 4 -
of stem cells [19,24].
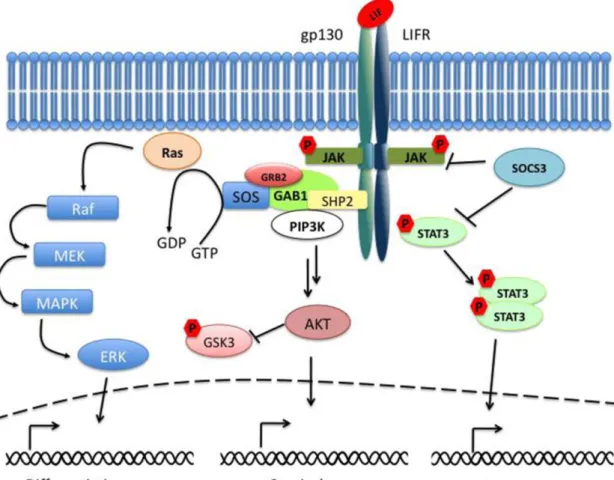
MS cells, for example, are usually cultured in the presence of fetal calf serum (FCS) to maintain and expand them as a population of undifferentiated cells [25]. Human ES (hES) cells are cultured and maintained their undifferentiated state in culture media supplemented with growth factors such as basic fibroblast growth factor (bFGF) and transforming growth factor beta (TGF-β) to promote self-renewal and pluripotency of the cells [26-28]. Unlike hES cells, mouse ES (mES) cells are maintained their pluripotent state by supplementing with another soluble factor termed as leukemia inhibitory factor (LIF), a soluble glycol protein of the interleukin (IL)-6 family cytokine. mES cells were initially cultured onto mouse embryonic fibroblasts (MEFs) feeder cells because the MEFs produced some soluble factors either to promote self-renewal or to suppress differentiation of mES cells [1,2]. Subsequent studies then identified that LIF was a MEF-derived soluble factor which inhibits differentiation of mES cells [29,30]. As shown in the Fig. 1-3, LIF binds directly to a heterodimeric receptor complex containing two transmembrane glycoproteins, gp130 and LIF receptor (LIFR), and leads to phosphorylation of receptor-associated Janus kinases (JAKs) [31,32]. The phosphorylated JAKs recruit signal transducer and activator of transcription 3 (STAT3) molecules and phosphorylate them to dimerize with another phosphorylated STAT3 molecule. The dimers are then translocated to the nucleus to regulate target gene expression. This JAK/STAT3 signaling pathway promotes self-renewal in mES cells. Furthermore, the binding of LIF to gp130/LIFR activates mitogen-activated protein kinase (MAPK) pathway, which induces mES cell differentiation, and phosphatidylinositol-3 phosphate kinase (PI3K) pathway, which promotes mES cell survival and progression of the cell cycle [33,34] (Fig. 1-3).
1.3 Mechanical factors are critical in stem cell
differentiation
Stem cell differentiation normally occurs during the development of an organism and the wound healing. During these events, stem cells may experience different kinds of mechanical stimuli such as fluid shear stresses and tensile forces, as well as rigidity and topography of the extracellular matrix (ECM). Increasing evidence suggests that these mechanical factors, in addition to soluble factors, play an important role in gene expression and fate determination of stem cells. McBeath et al. [35] demonstrated that the cell shape regulates lineage specification of human MS (hMS) cells (Fig. 1-4). hMS cells allowed to adhere, unspread, and round on small micro-patterned islands (1024 μm2) tended to differentiate into adipocytes, whereas those allowed to spread and flatten on larger micro-patterned islands (10000 μm2) differentiated into osteoblasts (Fig. 1-4A, B). Interestingly, the cells allowed to adhere on intermediate-sized
- 5 -
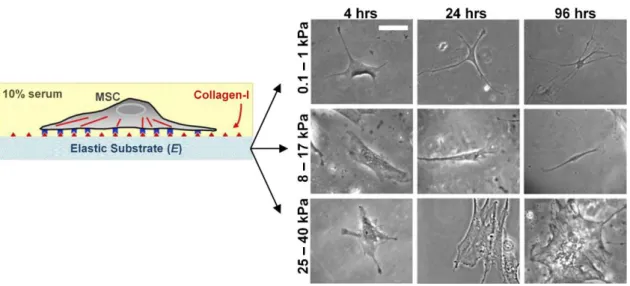
islands (2025 μm2) differentiated into both adipocytes and osteoblasts (Fig. 1-4B). Engler et al. [36] reported that substrate elasticity directs lineage specification of naive MS cells. Naive MS cells plated on soft substrates (0.1 – 1 kPa), mimicking brain elasticity, differentiated into neurons, whereas those plated on stiffer (8 – 17 kPa; mimicking muscle) and comparatively rigid (25 – 40 kPa; mimicking collagenous bone) substrates differentiated into myoblasts and osteoblasts respectively (Fig. 1-5). It has also been shown that soft substrates promote
self-renewal
Figure 1-3 Schematic of the LIF signaling pathway (Adapted from Graf et al. 2011 [32]). The binding of LIF to the two transmembrane glycoproteins, gp130 and LIFR, causes the activation of the JAK/STAT3, PI3K, and MAPK signaling pathways. The suppressor of the cytokine signaling 3 (SOCS3) acts as a negative regulator of the JAK/STAT3 pathway. The PI3K pathway mediates signal transductions through the downstream effectors including the serine/threonine protein kinase B (PKB, also known as AKT). The active gp130 receptors associate with the protein tyrosine phosphatase SHP-2, a positive regulator of the MAPK signaling cascade, and lead to the recruitment of the Gab1 (GRB2-associated binder 1).
- 6 -
Figure 1-4 The cell shape directs the lineage determination of hMS cells (Adapted from McBeath et al. 2004 [35]). (A) hMS cells seeded on the small (1024 μm2) and larger (10000 μm2
) islands differentiated into adipocytes and osteoblasts respectively. Lipids, markers of adipogenesis, stain red; alkaline phosphatase, a marker of osteogenesis, stains blue. Scale bar = 50 μm. (B) The cells seeded on the intermediate-sized islands (2025 μm2) differentiated into both the adipocytes and osteoblasts.
Figure 1-5 The substrate elasticity helps the lineage specification of naive MS cells (Modified from Engler et al. 2006 [36]). Naive MS cells plated onto the soft substrates (0.1 – 1 kPa) that mimic brain elasticity differentiated into neurons, whereas those plated onto the stiffer substrates (8 – 17 kPa) that mimic muscle differentiated into myoblasts. The cells seeded on the comparatively rigid substrate (25 – 40 kPa), mimicking collagenous bone, differentiated into osteoblasts. Scale bar = 20 μm.
- 7 -
self-renewal and pluripotency of mES cells (Fig. 1-6) [37]. mES cells seeded onto soft substrates (0.6 kPa) that match the intrinsic mES cell stiffness generated undifferentiated colonies with high level of Oct3/4 expression, the master regulator of pluripotency, and enzyme activities of alkaline phosphatase (AP), another pluripotent marker, even in the absence of LIF for 5 days (Fig. 1-6C).
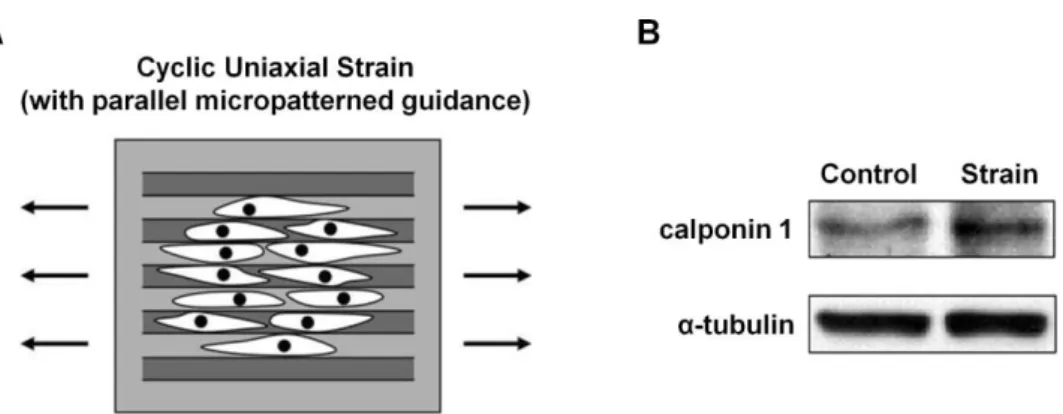
In addition, Kurpinski et al. [38] demonstrated that mechanical strain also plays an important role in MS cell differentiation (Fig. 1-7). Here they used a micro-patterned guidance to align MS cells along the direction of the uniaxial strain (Fig. 1-7A). Following the cyclic loading of the strain, the expression of calponin 1, a smooth muscle cell marker, was increased (Fig. 1-7B), whereas the expression of cartilage matrix markers was decreased. However, when the cyclic strain was loaded in the perpendicular direction to the aligned cells, the changes in gene expression were diminished. Recently, Poh et al. [39] and Chowdhury et al. [40] reported
Figure 1-6 Soft substrates promote the self-renewal and pluripotency of mES cells (Adapted from Chowdhury et al. 2010 [37]). (A, C) mES cells on the soft substrates (Gel (0.6 kPa)) formed the round and compact colonies (Phase; left) with the uniform Oct3/4 expression (Oct3/4::EGFP; middle) and the high alkaline phosphatase (AP; right) activity even in the absence of LIF (– LIF) for 5 days. The arrowheads indicate the colonies which were washed out during the staining process of AP. (B) mES cells on the rigid substrates of polystyrene dishes (Rigid dish (>4 MPa)) formed the round colonies and a spread colony (left; white arrows) with the low Oct3/4 expression and AP activity even in the presence of LIF (+ LIF). (D) In the absence of LIF (– LIF) for 5 days, mES cells on the rigid dishes formed the spread colonies with the extremely low Oct3/4 expression and AP activity. Scale bars, 100 μm.
- 8 -
that
that a local cyclic force induces stiffening, spreading and downregulation of Oct3/4 expression in mES cells (Fig. 1-8). They used magnetic twisting cytometry (MTC; see the section 2.2.4 in chapter 2) to apply a local cyclic stress on the cell membrane. In this MTC technique, Figure 1-8 The stress-induced spreading and differentiation in mES cells (Adapted from Chowdhury et al. 2010 [40]). A local cyclic force (17.5 Pa at 0.3 Hz) applied via RGD peptides-coated beads (black circles) induced the mES cell spreading (A) but diminished the Oct3/4 expression (Oct3/4::EGFP; B). Scale bars, 15 μm (A) and 10 μm (B) respectively.
Figure 1-7 Mechanical strain plays an important role in gene expression and lineage determination of MS cells (Adapted from Kurpinski et al. 2006 [38]). (A) MS cells were plated onto the micro-patterned guidance and aligned along the direction of the cyclic strain. (B) The loading of the cyclic strain induced the expression of calponin 1, a marker of smooth muscle cells.
- 9 -
ferromagnetic (Fe3O4) microbeads (~4 µm in diameter) coated with Arg-Gly-Asp
(RGD)-containing peptides were used and bound to the apical surface of mES cells. The surface-bound beads were then twisted by applying sinusoidal magnetic forces, resulted in the application of the cylic shear stress to the cells. In response to the local cyclic stress applied via RGD peptides-coated beads, mES cells stiffened and spreaded (Fig. 1-8A), and the Oct3/4 expression was downregulated (Fig. 1-8B).
1.4 Objective and outline of this thesis
As described previously, growing evidence suggests that mechanical factors, in addition to soluble factors, play an important role in stem cell differentiation. Although stem cells, especially pluripotent ES cells, hold a promising future in biomedical research and cell based therapies due to their remarkable capacity for unlimited self-renewal and multi-lineage differentiation, it has not been well investigated the effect of the mechanical stimuli on ES cells. Only recently, it has been shown that a local cyclic force applied via RGD-containing peptides-coated beads induces stiffening, spreading, and differentiation in mES cells [39,40]. However, the RGD peptides are synthetic peptides and are structurally different from natural RGD sequences in ECM proteins such as fibronectin, whose RGD-containing domains can be unfolded and deformed by mechanical stretching [41,42]. This deformation affects the binding affinity with ECM proteins [41,42]. Fibronectin is also known to play an important role in the early embryogenesis [43]. In addition, another ECM protein such as laminin, which is the first ECM component expressed in the developing mammalian embryo [44], are also critical in the early embryonic development [45]. It is therefore important to examine how ES cells respond to force applied via these ECM proteins. Moreover, cell-cell adhesion molecule E-cadherin (also known as Cdh1) (Fig. 1-9B), which is highly expressed in mES cells, is also known to play an important role in the compaction process of mouse embryos during the morula stage (Fig. 1-1) [46,47]. However, the effect of force applied via E-cadherin on biological responses in ES cells is unknown.
For understanding the lineage determination and embryonic development, it is important to understand the fundamental mechanisms by which individual ES cells sense mechanical stimuli and convert them into biochemical signals within the cell, a process known as mechanotransduction. Thus, the objective of this thesis is to investigate how ES cells respond to a local cyclic stress applied via different ligand-coated magnetic beads by using the MTC. The MTC is a well established device that can apply controlled and precise local mechanical stresses
- 10 -
of physiologic magnitudes to a living cell through different ligand-receptor interactions by coating magnetic beads with different ligands [48-50].
This thesis is organized as follows: Chapter 1 is introduction.
In Chapter 2, how ES cells respond mechanically to a local cyclic stress via different ligands is described.
In Chapter 3, the effect of a local cyclic stress via different ligands on ES cell spreading and differentiation is described.
Chapter 4 is conclusion.
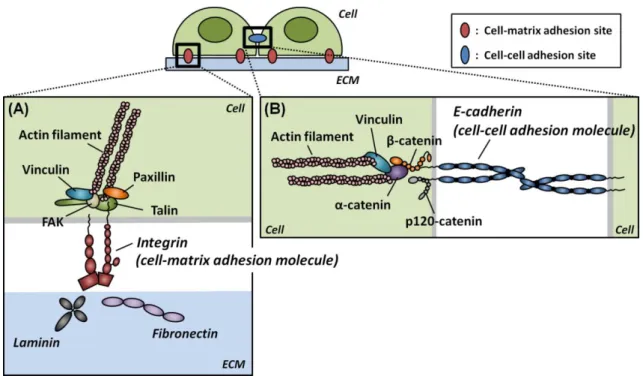
Figure 1-9 Schematic of the ligand-receptor interactions at the two different adhesion sites. (A) Fibronectin and laminin, natural ECM proteins, interact with the cell-matrix adhesion molecules, integrins. The integrin-mediated adhesion sites recruit various kinds of proteins including talin, paxillin, focal adhesion kinese (FAK), and vinculin, connecting ECM proteins with actin filaments through integrins. (B) E-cadherin interacts with itself (homophilic interactions) and links between two cells through adaptor proteins such as α-catenin, β-catenin, p120-catenin, and viculin.
- 11 -
CHAPTER 2
EMBRYONIC STEM CELLS STIFFEN IN
RESPONSE TO MECHANICAL FORCE
2.1 Introductinon
As described in chapter 1, it has recently been shown that mechanical force applied via synthetic RGD (Arg-Gly-Asp)-containing peptides can cause stiffening responses of mouse embryonic stem (mES) cells [39,40]. However, the synthetic RGD peptides are structurally different from natural RGD sequences in extracellular matrix (ECM) proteins like fibronectin, whose RGD-containing domains can be unfolded and deformed by mechanical stretching [41,42]. In addition to fibronectin, laminin, another ECM protein, has been demonstrated to induce signaling at focal adhesion sites and to promote mES cell migration [44]. Furthermore, it has recently been reported that cell-cell adhesion molecule E-cadherin, which is highly expressed in mES cells, can also mediate stiffening response in other cell type [51]. However, it is not clear how ES cells respond to force applied via these ECM proteins or the cell-cell adhesion molecules. In this chapter, I therefore applied a local cyclic stress to mES cells via different ligand-coated magnetic beads using magnetic twisting cytometry (MTC) and measured the changes of cell stiffness over time.
2.2 Materials and methods
2.2.1
Cell culture
A mES cell line, namely OGR1, that expresses enhanced green fluorescence proteins (EGFPs) under the promoter of Oct3/4 (Oct3/4::EGFP) [52], which is a primary marker for pluripotency [15], was used in this study and maintained under feeder free conditions with leukemia inhibitory factor (LIF; Chemicon) as described before [49]. Briefly, the undifferentiated mES cells were thawed and seeded onto 6 well tissue culture (TC)-treated polystyrene plates (CORNING; Fig. 2-1A) coated with 0.1% gelatin (Sigma) and cultured in high glucose Dulbecco’s modified Eagles medium (DMEM; Invitrogen) supplemented with 15% ES-qualified fetal bovine serum (FBS; Millipore), 2 mM GlutaMAX-I (Invitrogen), 1 mM sodium pyruvate (Invitrogen), 0.1 mM modified Eagle’s medium non-essential amino acids
- 12 -
(MEM NEAA; Invitrogen), 50 units/ml penicillin and 50 µg/ml streptomycin (Sigma), 0.1 mM 2-mercaptoethanol (Sigma), and 1000 units/ml LIF at 37 °C with 5% CO2. Cells were passaged
every 2-3 days at a ratio of 1:6 using TrypLE (Invitrogen). For experiments, cells were plated onto type I collagen (collagen-I; Sigma-Aldrich) coated (200 µg/ml) polyacrylamide gels whose elastic Young’s modulus was 0.6 kPa which is similar to the intrinsic mES cell stiffness [49] (see the section 2.2.2 in this chapter) because it has been shown that soft substrates that match ES cell’s intrinsic stiffness promote the self-renewal and pluripotency [37]. The polymer layers formed by the collagen-I molecules are too thin (<<0.2 µm) to affect the modulus of the polyacrylamide gel (~75 µm in thickness).
2.2.2
Polyacrylamide gel making
Polyacrylamide gels (referred to gels hereafter) were made on 35 mm glass bottom culture dishes (MatTek) as described before [53]. Before start making gels, the dishes were activated by the following steps. First, the glass surface (14 mm in diameter) of the dishes was covered with 200 µl of 0.1N NaOH (Sigma-Aldrich) and left overnight to dry off. 3-aminopropyltrimethoxysilane (Sigma-Aldrich) was then smeared over the glass surface by using a cotton-tipped swab, and then the dishes were left for 6 min. After washing the dishes with distilled water, the glass surface was covered with 200 µl of 0.5% gluteraldehyde (Sigma-Aldrich) and left for 30 min. These surface-activated dishes were then washed with distilled water and left to dry off (Fig. 2-2A).
One milliliter of the 0.6 kPa polyacrylamide gel solution containing 0.06% bis-acrylamide, Figure 2-1 mES cell culture. (A) Cells were cultured onto the 6 well polystyrene plates coated with 0.1% gelatin (cell growth areas, 9.5 cm2). (B) Phase contrast image of mES cells on the plates. Undifferentiated mES cells normally form the colonies as shown in the middle of the image. Scale bar = 50 μm.
- 13 -
3% polyacrylamide, and the initiators of polymerization, which are 10% ammonium persulfate solution (APS) and N,N,N,N-tetramethylenediamine (TEMED) (all from Bio-Rad) at 1/200 and 1/2000 volume ratio, respectively, was prepared and mixed gently to start polymerization. Before the polymerization was complete, an aliquot (15 μl) of the solution was immediately applied onto the activated dishes and then flattened with circular cover glasses (12 mm in diameter; Fisher Scientific) (Fig. 2-2B). After incubation of the dishes at 37 °C for 30 min (Fig. 2-2C), the cover glasses were carefully removed by a single edge razor. The surface of the polymerized gels was then treated with 1 mM crosslinker solution of Sulfo-SANPAH (Pierce) in dimethyl sulfoxide (DMSO; Sigma) and 100 mM HEPES buffer (Sigma) (Fig. 2-2D), making it easier to coat the gels with collagen-I later, and was exposed to UV light for 6 min (15 cm away from the lamp) to activate the SANPAH solution. After washing the dishes with 100 mM HEPES buffer, the SANPA treatment and the photoactivation procedure were repeated. The gels were then coated with collagen-I (200 μg/ml) and incubated overnight at 4 °C. Before seeding cells, the dishes were washed with PBS and sterilized under UV light.
Figure 2-2 Polyacrylamide gels were made on the glass bottom dishes as described before [53]. (A) The glass surface of the dishes was first activated for gel making. (B) An aliquot of the gel solution was then applied onto the glass surface and flattened with the cover glasses. (C) The dishes were incubated at 37 °C for 30 min to polymerize the gels. (D) The completely polymerized gels were then treated with the cross-linker solution of Sulfo-SANPAH and coated with collagen-I for seeding cells.
- 14 -
2.2.3
Bead coating
Ferromagnetic (Fe3O4) microbeads (~4 μm in diameter) were coated with different
ligands: RGD-containing peptides, fibronectin, laminin, and E-cadherin. For RGD or fibronectin coated beads, 50 μg of RGD peptide or 25 μg of fibronectin (Sigma-Aldrich) was added to 1 mg of beads suspended in 1 ml of carbonate buffer (pH9.4). The bead solution was then incubated overnight at 4 °C while being gently rotated. For laminin-coated beads, 10 μg of beads and 20 μg of laminin (Sigma-Aldrich) were suspended in 100 μl of PBS buffer and incubated for 10 min at room temperature. For E-cadherin-coated beads, 1 mg of beads was suspended in 1 ml of coating buffer (20 mM HEPES buffer supplemented with 100 mM NaCl and 5 mM CaCl2 at pH 8.0). The bead solution was mixed with 100 μg of E-Cadherin/Fc
Chimera (Sigma-Aldrich) and incubated overnight at 4 °C while gently being rotated. After coating, the RGD, fibronectin, laminin, or E-cadherin coated beads were suspended in serum-free medium or the coating buffer before storing at 4 °C or used immediately in the experiments.
2.2.4
Applying a local cyclic stress using magnetic twisting cytometry
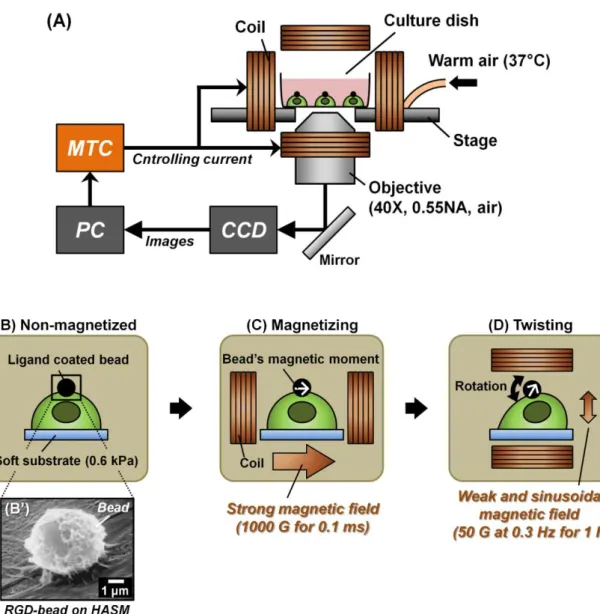
The magnetic twisting cytometry (MTC) is a well-established device to apply controlled and precise mechanical forces to specific sites on the cell surface [48,50,54] (Fig. 2-3). Before using the MTC, ferromagnetic microbeads coated with different ligands at saturated density were added to the cell culture dishes and incubated at 37 °C for 15 min, allowing for the beads to interact with specific receptors on the cell surface [55] (Fig. 2-3B, B’). Unbound beads were then washed off with PBS, and the dishes were placed under the inverted optical microscope (Leica) and maintained at 37 °C during the experiments (Fig. 2-3A). For applying a cyclic stress to cells, a brief and strong external magnetic field (1000 gauss (G) for 100 μs) was first applied horizontally over the entire dish, resulting in magnetization and alignment of the magnetic moments of all beads in the dish (Fig. 2-3C). Next, a weaker and sinusoidal ―twisting‖ magnetic field (50 G at 0.3 Hz) was applied vertically over the entire dish without remagnetizing the beads, resulting in the application of torque to the beads. This torque caused the rotation of the beads and the application of the cyclic shear stresses to the cell surface (Fig. 2-3D).
- 15 -
Figure 2-3 Schematic principle of the MTC. (A) The experimental system is shown. The cell culture dishes were placed under the inverted optical microscope to be surrounded by the coils. The cell images were captured with the CCD attached to the microscope. MTC can control the current flow to apply magnetic field. (B) Before applying the magnetic force, the ligand-coated beads were first bound to the cell surface. (B’) A representative SEM image of the binding of a RGD-coated bead to the apical surface of a human airway smooth muscle (HASM) cell is shown (Adapted from Maksym et al. 2000 [55]). (C) A brief and strong magnetic field (1000 G for 100 μs) was applied over the entire dish to magnetize the beads at horizontal direction. (D) A weaker and sinusoidal “twisting” magnetic field (50 G at 0.3 Hz) was then applied vertically. This caused the bead rotation and the stress application to the cells.
- 16 -
The magnitude of the applied shear stress to cells can be estimated from the following equations. The applied torque, T to the magnetic beads on the cell surface as described by Valberg and Butler [56] is
where μ0 is magnetic permeability in vacuum (4π × 10
-7
N/A2), is bead’s magnetic moment,
and is the ―twisting‖ magnetic field. The cross product of the equation 1 above can be simplified to
where θ is the angle between the bead’s magnetic moment, and the ―twisting‖ magnetic
field, , and where α is the angle of deflection of the beads as shown in Fig. 2-4A.
Here torque, T is a moment of force calculated by taking the vector product of the force vector, and the radius vector, , from the axis of rotation to the point of force application (Fig. 2-4B). When torque is applied to a spherical bead, the coupled force is applied on both sides of the bead in the same counter clockwise direction (Fig. 2-4B). The net torque is therefore the sum of the torques produced by the coupled forces.
Since force, F is equivalent to the average applied stress, τ multipled by the bead’s surface area
(4πr2), the equation 3 can be rearranged to yield the stress, τ as a function of applied torque, T
and the bead’s volume, v.
- 17 -
By defining specific torque, Tsp as the applied torque per bead volume, T/v, the average applied
stress, τ can be described as 1/6 of the specific torque.
From the above equations 2 and 5, the average applied stress, τ can be simplified to
Figure 2-4 Twisting force diagram. (A) A 1000 G magnetic impuls was applied to the bead, and the bead’s magnetic moment, was aligned to the horizontal direction. The twisting magnetic field, was then applied vertically, causing the twisting torque, T on the bead. Due to the twisting torque, T, the shear stress, τ was applied to the cell surface, where θ is the angle between and , and α is the angle of the bead’s deflection. (B) A torque applied on a spherical bead can be calculated by taking the product of the radius vector, and the force vector, . Since the coupled force acts on both sides of the bead in the same counter clockwise direction in this case, the net torque is therefore the sum of torques generated by the coupled forces.
- 18 -
where c is the bead constant (in Pa/G), which is defined as . The bead constant, c can be experimentally determined by rotating the beads in a viscosity standard and measuring the angular velocity of the beads while applying a twisting field of variable magnitude [48]. The bead constant of the beads which were used in this study was determined to be 0.35 Pa/G. Due to the fact that when beads are bound to the cell surface, the bead’s rotation is resisted by the connection with the cytoskeleton within the cells [48], thereby reducing the angle of deflection,
α, of the beads. When α becomes extremely small, . Thus, the equation 5 can be approximated as
The average applied stress, τ can be easily expressed as the known bead constant, c multiplied by the magnitude of the applied ―twisting‖ magnetic field, H. Since a 50 G twisting magnetic field was applied to beads in this study, the average applied stress was estimated to be 17.5 Pa.
2.2.5
Cell stiffness measurement
The cell stiffness measurement technique using MTC has been described before [48,49,54,57]. In short, the cell stiffness can be measured from the displacement of ferromagnetic microbeads bound to the cell surface during applying a sinusoidal magnetic field (50 G at 0.3 Hz). The bead displacements were monitored by using a charge-coupled device camera (Hamamatsu) attached to the microscope and quantified by using an intensity-weighted center-of-mass algorithm [58]. The bead displacements that did not conform to the input sinusoidal waveform and frequency, and that were less than the detection resolution (5 nm; root mean square) were excluded for data analysis. For the quantification of the cell stiffness, I measured the complex shear stiffness (G*) that is defined as
where Tsp, is the specific torque defined as the applied torque, T per bead volume, v as described
in the previous section, and d is the peak amplitude of the horizontal bead displacement (Fig. 2-5A). To increase the signal to noise ratio, the bead amplitude, d was averged over 5 consecutive cycles. The measured cell stiffness, G* has the unit of Pa/nm and can be converted to the shear modulus, G by quantifying the embedded area of the beads into the cells as described previously [40,59]. Chowdhury et al. [40] have experimentally estimated that the embedded area of ferromagnetic (Fe3O4) microbeads (~4 μm in diameter), the same beads as I
- 19 -
used in this study, into mES cells was about ~50% (Fig. 2-5B) by comparing the diameter of the bead and the actin ring, which is a ring-like structure formed by actin molecules surrounding the bead due to the formation of integrin-mediated focal adhesion sites at the bead-cell surface contact (Fig. 2-5C, D). Thus 1 Pa/nm measured stiffness, G* can be equivalent to 2.5 kPa shear modulus, G in this study.
2.2.6
Quantification of bead binding specificity
It was determined whether the ligand-coated beads bind to specific receptors on the cell surface. Cells were seeded onto 200 µg/ml collagen-I coated glass bottom dishes (MatTek) at a density of 6.5 × 10³ cells/cm2. After incubation of the cells for 8 h at 37 °C with 5% CO2, the
culture medium was replaced with a serum free medium. Cells were then pre-treated with Figure 2-5 Quantification of cell stiffness. (A) The cell stiffness (G*) was quantified by measuring the peak amplitude of the horizontal bead displacement, d. (B, C) To convert the quantified cell stiffness (G*) to shear modulus (G), the embedded area of the bead was experimentally estimated (Modified from Chowdhury et al. 2010 [40]). By just binding the RGD peptides-coated beads to the cells, the actin molecules spontaneously accumulated around the beads and formed the ring-like structure, the actin ring (the white arrow), due to the formation of the integrin-mediated focal adhesions. (C) is the schematic lateral view of the cell bound with the RGD-coated bead from the point a to a’ in (B). (D) The embedded area of the beads was estimated by comparing the diameters of the bead and actin ring.
- 20 -
soluble RGD, fibronectin or laminin for 10 min at a final concentration of 10 or 50 µg/ml (Fig. 2-6A). For the quantification of the binding specificity of the E-cadherin-coated beads, EGTA (Sigma–Aldrich), a calcium chelator, was used at a concentration of 3 or 9 mM instead of using soluble E-cadherin. After treating cells with soluble ligands or EGTA, the ligand-coated beads were added (Fig. 2-6B) to the culutre. Unbound beads were then washed away and the total number of beads left on the apical surface of cells was counted. A two-tailed Student’s t-test was used for statistics.
2.3
Results
2.3.1
Ligand-coated beads interact with specific receptors on the cell
surface
I first quantified the binding specificity of the different ligand-coated magnetic beads. The total number of the beads remained on the apical surface of the cell membrane after washing is shown in Fig. 2-7. Obviously the number of beads was significantly decreased by the addition Figure 2-6 Quantification of the binding specificity of the ligand-coated beads. (A) Cells were pre-treated with soluble ligands or EGTA at different concentrations and incubated for 10 min at 37 °C with 5% CO2. (B) The ligand-coated beads were added to the dishes and incubated
for 15 min, and then the unbound beads were washed off with PBS. The total number of beads bound to the cell surface was counted under the microscope.
- 21 -
of soluble ligands or EGTA, a calcium chelator. For RGD, fibronectin, and laminin coated beads, binding of these beads to the cell surface showed dose-dependent competition with soluble ligands (Fig. 2-7A, B, C). Furthermore, binding of E-cadherin-coated beads to the cells was decreased by increasing the concentrations of EGTA (Fig. 2-7D), meaning that the cell–cell Figure 2-7 Binding of ligand-coated magnetic beads to ES cells showed ligand specificity. The total number of surface-bound beads coated with each ligand was quantified before (0 min) and 10 min after addition of each soluble ligand (10 and 50 μg/ml for RGD, fibronectin (FN) and laminin (LN), and 3 and 9 mM for EGTA). (A) RGD peptide-coated beads; p < 0.003 and p < 0.033, 0 vs 10 μg/ml and 10 vs 50 μg/ml soluble RGD peptides respectively. (B) Fibronectin (FN)-coated beads; p < 0.011 and p < 0.05, 0 vs 10 μg/ml and 10 vs 50 μg/ml soluble fibronectin respectively. (C) Laminin (LN)-coated beads; p < 0.015 and p > 0.25, 0 vs 10 μg/ml and 10 vs 50 μg/ml soluble laminin respectively. (D) E-cadherin (ECad)-coated beads; p < 0.001 and p < 0.002, 0 vs 3 mM and 3 vs 9 mM EGTA respectively. Data were collected from 3 biological replicates for each condition. Means + SE are shown.
- 22 -
adhesions via hemophilic interactions of E-cadherin proteins are strongly dependent on the presence of calcium [51]. These results suggest that the ligand-coated magnetic beads interact with specific receptors on the cell surface membrane.
2.3.2
Stress-induced stiffening of ES cells
A local cyclic force applied via synthetic RGD-containing peptides has been recently shown to cause stiffening of ES cells [39,40]. However it remains elusive how the cells respond to stress applied via natural ECM proteins such as fibronectin and laminin or different adhesion molecules like E-cadherin. Here I applied a local cyclic shear stress (17.5 Pa at 0.3 Hz) to the apical surface of ES cells for 1 h using the MTC and quantified the cell stiffness during the stress application by measuring the peak amplitude of the surface-bound bead’s displacement (Fig. 2-8A). As the stress was applied to the cells for 1 h, the peak amplitude of the bead displacements was decreased over time for all conditions as shown in Fig. 2-8B–E. The quantified cell stiffness shown in Fig. 2-9 was increased over time for all conditions, which was correlating with the decrease of the bead displacements (Fig. 2-8B-E). Although the cell stiffness was almost doubled in response to the applied stress within 1 h for all, the cell stiffening rate varied depending on the ligand-coating beads (Fig. 2-9A, B). The baseline stiffness of ES cells bound with RGD, fibronectin, laminin, or E-cadherin coated beads was similar and ~0.5 kPa (Fig. 2-9B, 0 min), consistent with previously published results [39,40]. Since the cell stiffening in response to the same magnitude of stress is an index of mechanotransduction-dependent cytoskeletal remodeling [60], these results indicate that both integrin focal adhesion complexes and E-cadherin complexes are bona fide mechanosensors in ES cells, consistent with previously published results in other cells types [51,60].
- 23 -
Figure 2-8 The peak amplitude of the bead displacement was decreased over time for all conditions. (A) Representative images of the peak-to-peak displacement of a laminin-coated bead are shown. T is the length of time taken by one cycle of twisting (3.3 sec). Scale bar = 5 µm. (B-E) Representative bead displacements are shown for all conditions during the 1 h stress application. (B) RGD peptides-coated bead; (B) fibronectin (FN)-coated bead; (C) laminin (LN)-coated bead; (D) E-cadherin (ECad)-coated bead.
- 24 -
Figure 2-9 Stress-induced stiffening in mES cells bound with ligand-coated beads. (A) The relative cell stiffness for each ligand-coated bead is shown as a function of duration of the stress application. The peak of cyclic stress is 17.5 Pa; the frequency of loading is 0.3 Hz. All stiffness measurements are normalized with respect to time zero. Means + SE are shown. (B) Absolute magnitudes of cell stiffness (shear modulus, G) are shown before (0 min) and after (60 min) stress application. Each comparison of the cell stiffness before and after stress application showed significant differences; RGD, p < 0.012; fibronectin, p < 0.017; laminin, p < 0.041; and E-cadherin, p < 0.044. Data were collected from 5, 10, 9, and 7 cells for RGD, fibronectin (FN), laminin (LN), and E-cadherin (ECad) coated beads, respectively. Means + SE are shown.
- 25 -
2.4
Discussion
As described previously, it has recently been shown that mechanical force applied via synthetic RGD-containing peptides induces mES cell stiffening [39,40]. However, synthetic RGD peptides are structurally different from RGD sequences in fibronectin [41,42]. Here I showed that ES cells stressed via RGD peptides or fibronectin stiffened in response to stress application, suggesting that force applied through synthetic or natural RGD sequences can both mediate the ES cell stiffening response (Fig. 2-9). In addition, the similar stiffening response was also observed in the cells stressed via other ECM proteins, laminin (Fig. 2-9). Thus, this result demonstrates that forces applied via these ECM proteins play important roles in ES cell stiffening.
Interestingly, ES cells stressed via E-cadherin also stiffened in the same way as those stressed via RGD peptides, fibronectin, or laminin (Fig. 2-9). It is known that RGD peptides, fibronectin, and laminin interact with integrins, the cell-ECM adhesion molecules, but E-cadherin is a different type of adhesion molecules that can mediate cell-cell adhesions, and interacts with itself (hemophilic interactions). It is unclear at the moment why forces applied via different types of adhesion molecules, integrins and cadherins, elicit similar response in ES cell stiffening, but there are some possibilities. Both integrin-based focal adhesions and cadherin-based complexes provide anchoring support to cells through the links to the actin cytoskeleton (Fig. 1-9). Integrin clusters via cell-ECM interactions recruit proteins such as talin [61] and vinculin [62] that can be deformed, unfolded, and activated by forces of physiologic magnitudes (Fig. 1-9A). Vinculin has been shown to play an important role in strengthening at the integrin-mediated focal adhesion sites [63]. E-cadherin at cell–cell adhesion sites, on the other hand, recruits proteins such as α-catenin [64], β-catenin [65], and vinculin [51] (Fig. 1-9B). It has also been shown that vinculin facilitates E-cadherin mediated mechanosensing and stiffening in response to shear force at cell-cell junctions [51]. Vinculin knockout cells display a reduction in the stress-induced stiffening response through E-cadherin whereas vinculin-reconstituted cells fully restore the force-dependent reinforcement of cadherin junctions [51]. Because vinculin is localized in both cell-ECM adhesions and cell-cell junctions as described above (Fig. 1-9), I hypothesize that vinculin is at least partly responsible for the stress-induced ES cell stiffening response in both integrin and cadherin mediated pathways.
- 26 -
2.5 Conclusion
In this chapter, I quantified the ES cell stiffeness during stress was applying via different ligad-coated magnetic beads using the MTC to investigate how ES cells respond to force applied via natural ECM proteins or cell-cell adhesion molecules. As a result, no difference was observed in the stiffening response of mES cells between forces applied via synthetic or natural RGD sequences. In addition, force applied through ECM proteins such as fibronectin and laminin induced ES cell stiffening. Interestingly, the two different pathways through integrins and cadherins were both important for stress-dependent ES cell stiffening response.
- 27 -
CHAPTER 3
THE EFFECT OF MECHANICAL STRESS
ON EMBRYONIC STEM CELL
SPREADING AND DIFFERENTIATION
3.1 Introductinon
As described in chapter 1, the effects of mechanical stimuli on ES cell spreading and differentiation have not been well investigated. Only recently it has been shown that a local cyclic stress applied via synthetic Arg-Gly-Asp (RGD) peptides promotes mouse ES (mES) cell spreading and differentiation [40]. However, it remains unknown how ES cells respond to force applied via natural ECM proteins, such as fibronectin and laminin, and cell-cell adhesion molecules like E-cadherin. In this chapter, therefore, I applied a local cyclic force to mES cells via different ligand-coated magnetic beads using the magnetic twisting cytometry (MTC) to examine the effects of the stress on ES cell spreading and pluripotency.
3.2 Materials and methods
3.2.1
Cell culture
Undifferentiated mES cells (OGR1) that express enhanced green fluorescence proteins (EGFPs) under the promoter of Oct3/4 (Oct3/4::EGFP) [52], a master regulator of pluripotency [15], were cultured and maintained under the feeder-free conditions with the leukemia inhibitory factor (LIF; Chemicon) as described in the section 2.2.1.
3.2.2
Applying a local cyclic stress using magnetic twisting cytometry
As described in the section 2.2.4, individual mES cells were plated sparsely onto polyacrylamide gel substrates (elastic modulus = 0.6 kPa, 0.06% bis-acrylamide, 3% polyacrylamide [53]) because it has been shown that soft substrates, whose stiffness was similar to the intrinsic mES cell stiffness [49], promote self-renewal and pluripotency in mES cells [37]. These gel substrates were made on gridded glass-bottomed dishes (MatTek; see the section 2.2.2; Fig. 3-1A) to track cells of interest over a long period (24 h) and the gel surface was coated with 200 μg/ml type-I collagen (Sigma-Aldrich) 24 h before plating cells. After seeding
- 28 -
cells on the gel substrates, ligand-coated beads were added to the culture dishes and were bound to the cell surface membrane (Fig. 2-3B, B’). A local cyclic shear stress (17.5 Pa at 0.3 Hz) was then applied to the cells via the surface-bound beads for 1 h by using the MTC (Fig. 2-3B-D, Fig. 3-1B). Before (0 h) and after (1, 12, and 24 h) stress was applied, bright-field (BF) and fluorescent images of the cells were captured with a coupled-charge device camera (Hamamatsu) attached to an inverted optical microscope (Leica) (Fig. 3-1B). Cell projected area was measured from the obtained BF images by using an active contour algorithm of ImageJ (NIH). In addition, cell proliferation was also assessed by staining their nuclei (see the section 3.2.3) and by counting the number of nuclei after the stress application. Undifferentiated state of ES cells was quantified from the captured fluorescent images by measuring the fluorescent intensity of EGFP within the cells. To make certain that decrease in EGFP expression is not because the cells are dying or losing their general transcription capacity, the cells were simultaneously transfected with pCAGGS DsRedT3_T2A_Puro (CAGGS) that expresses DsRed under CAG, a constitutively active promoter [40].
Figure 3-1 Schematic of the experimental system. (A) Gridded glass-bottomed dishes were used in this experiment to track specific cells for a long period of time (24 h). (B) The gridded dishes were placed under the microscope to be surrounded by the coils. The cells were stressed via ligand-coated beads for 1 h and were captured BF and fluorescent images before (0 h) and after (1, 12, and 24 h) stress application. The EGFP is excited with a light of wavelength 475 nm.
- 29 -
3.2.3
Fluorescent staining
Cells were fixed in 4% paraformaldehyde (Sigma) for 15 min at 37 °C and their membranes were permeabilized with 0.5% Triton X-100 (Sigma) for 2 min at room temperature. Actin filaments (F-actin) within the cells were first stained with 1 μg/ml rhodamine-phalloidin (Sigma) for 30 min. Cell nuclei were then counter-stained with 300 nM DAPI (Invitrogen) for 1 h. The cells were rinsed two times with cytoskeleton (CSK) buffer (pH 6.8), containing 10 mM PIPES, 300 mM sucrose, 100 mM NaCl, and 4 mM MgCl2 (all from Sigma), and were rinsed
once with distilled water.
3.3 Results
3.3.1
Stress applied via integrins but not E-cadherin induces ES cell
spreading and slows down the cell proliferation rate
Although force applied via synthetic RGD peptides has been recently shown to induce ES cell spreading [40], it remains unclear whether force applied via different ligands leads to different responses in ES cells. Here I show that local cyclic forces applied via magnetic beads coated with RGD, fibronectin (FN), or laminin (LN) induced bleb formation of mES cells and caused a ~50% increase in cell projected area in 12 h after stress was applied (Fig. 3-2, Fig. 3-3 RGD, FN, LN). These ES cells remained spread and flattened for up to 24 h after stress was applied (Fig. 3-2, RGD, FN, LN at 24 h). In contrast, control cells that were not stressed (– Stress) or cells stressed via E-cadherin (ECad)-coated magnetic beads exhibited a 20% decrease in cell projected areas in 24 h (Fig. 3-3, – Stress, ECad). It should be noted that the apparent increases in the projected area of these control cells (– Stress) and cells stressed via E-cadherin at 12 h and 24 h are not due to cell spreading, but due to increasing the number of cells as a result of cell division (Fig. 3-2, Fig. 3-3). It is known that normal self-renewing pluripotent mES cells have a cell-doubling time of ~10.5 h [39]. Comparing the number of nuclei in control stress-free cells or cells stressed via E-cadherin-coated beads at 12 h with that at 24 h, it clearly demonstrates that these ES cells doubled normally (Fig. 3-2, – Stress, ECad at 12 and 24 h). In sharp contrast, the cells stressed via RGD, fibronectin, or laminin coated beads remained as single cells at 24 h (Fig. 3-2, RGD, FN, LN at 24 h), suggesting that the force applied via integrin pathways delayed cell proliferation rates in these ES cells, possibly by impeding the self-renewing capacity of the ES cells. These results demonstrate that there are no differences in the effects of force applied via RGD, fibronetin, or laminin on ES cell spreading and proliferation, but interestingly, the significant differences were observed between integrin and E-cadherin mediated force transduction pathways. Forces via integrin-mediated pathways
- 30 -
induced cell spreading and slowed down cell proliferation, whereas forces via E-cadherin- mediated pathways had no effect on either cell spreading or cell proliferation rate.
Figure 3-2 Force via integrins but not E-cadherin increased cell spreading and doubling time. Representative bright field (BF; top row) images of ES cells and fluorescent images indicating the presence of the nucleus (DAPI; 2nd row) and F-actin (actin, 3rd row) are shown at 12 h and 24 h without stress (– Stress) or after stress was applied for 1 h. Fluorescent images for DAPI and F-actin staining were merged on the bottom row. Cells stressed via RGD, fibronectin (FN), and laminin (LN) coated beads remained as single cells 24 h after stress was applied. However, control cells (– Stress) and cells stressed with E-cadherin (ECad) coated beads continued to proliferate, which is evident from the number of nuclei at 12 and 24 h. Scale bars, 10 μm.
- 31 -
3.3.2
Force applied via integrins but not E-cadherin induces
differentiation of ES cells
A recent report showed that a local force influences mES cell differentiation [40], but it is unknown whether forces applied to ES cells via different ligands cause different differentiation responses. To address this question, I assessed the pluripotent state of mES cells after 1 h stress application by quantifying the EGFP intensity and the results are shown in the Fig. 3-4 and Fig. 3-5. The individual ES cells were healthy and pluripotent before stress was applied, as indicated by the round shape and high EGFP expression (Fig. 3-4, 1st, 5th column). When a cyclic shear stress (17.5 Pa at 0.3 Hz) was applied to the cells for 1 h through RGD, fibronectin or laminin coated beads (Fig. 3-4, 2nd, 3rd, 4th row), EGFP expression in these cells decreased by ~15% in Figure 3-3 The cell area per cell was summarized as a function of time after stress. Cells stressed with RGD, FN, or LN-coated beads increased projected areas by 50–70% by 24 h. However, control cells or cells stressed with ECad-coated beads decreased cell projected areas slightly due to cell division. Values for cell areas at 12 and 24 h are statistically significant when compared with those before application of the stress (time 0; p < 0.01 for all conditions). Values at 12 h did not show statistical significance when compared with those at 24 h (for all conditions, p > 0.1). The cell projected area before stress application was ~230 μm2. Data were collected from 10, 8, 8, 7, and 8 for – Stress, RGD, FN, LN, and ECad-coated beads respectively. Means + SE are shown.
- 32 -
12 h and ~30% by 24 h (Fig. 3-4, Fig. 3-5). In sharp contrast, the cells that were stressed via E-cadherin-coated beads did not have any decrease in EGFP expression in 12 or 24 h (Fig. 3-4, 5th row), similar to control cells in the same culture dish that were not stressed or not bound with beads (Fig. 3-4, 1st row). Despite the local cyclic force via RGD peptides, fibronectin, or laminin decreased EGFP expression within the cells, the expression of DsRed (CAGGS), which are derived under the CAG promoter, was remained constant >24 h, indicating that the decrease in EGFP expression was not due to dying or losing general transcription capacity of the cells (Fig. 3-6). These results demonstrate that there were no differences in the effects of force via RGD, fibronectin, or laminin on ES cell differentiation, which was the same tendency as the effects on the ES cell spreading and proliferation. More importantly, there were significant differences in ES cell differentiation between integrins and E-cadherin mediated force Figure 3-4 Force via integrins but not E-cadherin downregulated Oct3/4 expression. Representative bright field (BF, left) and fluorescence (Oct3/4::EGFP, right) images of mouse ES cells that were bound with beads coated with ligands as indicated on left at different times as indicated on top. Expression of Oct3/4 was shown by fluorescence of EGFP driven by the Oct3/4 promoter (Oct3/4::EGFP). Cyclic shear stress was applied for 1 h (peak stress was 17.5 Pa at 0.3 Hz). Note that the EGFP fluorescence intensity decreased in the cells stressed with RGD, fibronectin (FN), and laminin (LN) coated beads at 12 and 24 h after stress was applied. Scale bars, 10 μm.
- 33 -
transduction
Figure 3-5 Expression levels of Oct3/4 were quantified up to 24 h after stress was applied. Force via RGD (n = 9), FN (n = 10), or LN (n = 10) coated beads decreased Oct3/4 at 12 or 24 h. *p < 0.05; **p < 0.01. However, force via E-cadherin (ECad)-coated beads has no effect on Oct3/4 expression (n = 8). Cells that had no beads bound were used as a control (– Stress; n = 8). Means + SE are shown.
Figure 3-6 ES cells showed the general transcription capacity during experiments. Representative BF and fluorescent images of an the cells stressed with RGD-coated beads are shown at different time. The cells were transfected with CAGGS that expresses DsRed under CAG, a constitutively active promoter. Scale bar = 10 μm.
- 34 -
transduction pathways, which was also the same tendency as shown in the previous section of this chapter. Forces applied via integrin pathways is capable of downregulating Oct3/4 expression, leading to ES cell differentiation, whereas forces applied via E-cadherin pathways maintained Oct3/4 expression, maintaining pluripotent state of ES cells.
3.4 Discussion
In this chapter, I applied a local cyclic shear stress to mES cells via different ligand-coated beads to investigate the effects of the stress on cell spreading, proliferation, and differentiation. Here I demonstrated that forces applied via RGD peptides and fibronectin both induced spreading and downregulation of Oct3/4 expression and slowed down proliferation rate in mES cells. This finding suggests that forces applied via synthetic and natural RGD can both mediate biological responses of ES cells almost in the same way. In addition, forces applied via fibronectin or laminin also both caused the same responses in ES cells. It is known that fibronectin and laminin interact with different integrin subsets: α5β1 and αvβ3 integrins for fibronectin [66], α6β1 and α7β1 integrins for laminin [67]. Therefore, it will be interesting to determine in the future whether fibronectin or laminin plays different roles in lineage differentiation of mES cells.
In contrast, I showed that force applied via E-cadherin had no effect on spreading, proliferation, and Oct3/4 expression in mES cells, suggesting that these biological responses of the cells are strongly dependent on specific pathways through transmembrane adhesion molecules, integrins and caderins. The underlying mechanisms of why the same force applied through integrin and cadherin pathways elicited totally different responses is unclear yet, but there are a few clues. Cell spreading is a complicated process that includes plasma membrane protrusion mediated by coordinated actin polymerization, which depends on activities of actin associated proteins such as Arp2/3 and WASP [68,69]. Stress-induced cell spreading also requires activated Src, cdc42, and myosin II [40]. When a force is applied via the integrin pathways, it induces cell membrane protrusion within ~30 s after force application [40]. The ES cell continues to spread in response to the cyclic stress and the cell increases its projected area by ~50–70% after 1 h of force application [40] (Fig. 3-3). The significant downregulation of
Oct3/4 expression, quantified by changes in EGFP fluorescence intensity in the cells, was only
apparent at ~12 h (Fig. 3-4, Fig. 3-5). These results suggest that cell spreading might precede downregulation of Oct3/4 expression and might be necessary for Oct3/4 downregulation and ES cell differentiation. However, this conclusion should be dealt with caution since the fluorescence intensity in these ES cells depends on the turnovers of EGFP, which might be much slower than
- 35 -
the actual force-induced downregulation of the Oct3/4 gene. The relationship between ES cell spreading and ES cell differentiation needs to be examined carefully in the future. It will also be interesting to elucidate the mechanisms of why the same force results in totally different responses in spreading and Oct3/4 expression for integrins and E-cadherin.
It has been implicated that E-cadherin promotes the pluripotency and self-renewal of ES cells. When ES cells are plated on E-cadherin coated dishes, they maintain self-renewal and pluripotency [70]. These ES cells must adhere via E-cadherin molecules and should have generated tractions and transmitted forces from the cell to the substrate via E-cadherin [71]. Therefore the fact that they maintain self-renewal and pluripotency is completely consistent with our results that the force applied via E-cadherin maintains self-renewal and Oct3/4 expression.
3.5 Conclusion
In this chapter, I quantified cell spreading, proliferation rate, and differentiation before and after stress was applied via different ligad-coated magnetic beads using the MTC to examine the effects of the stress on ES cells. As a result, force applied via integrin pathways induced cell spreading and differentiation and slowed down proliferation rate. In contrast, force applied via E-cadherin pathways had no effect on ES cell spreading, differentiation, and proliferation rate. These findings demonstrate that biological responses of ES cells to force applied via integrins are different from those to force via E-cadherin, suggesting that mechanical forces might play different roles in different force transduction pathways for the early embryogenesis.

![Figure 2-2 Polyacrylamide gels were made on the glass bottom dishes as described before [53]](https://thumb-ap.123doks.com/thumbv2/123deta/5917071.1050838/19.892.229.662.142.477/figure-polyacrylamide-gels-glass-dishes-described.webp)