SLEEP APPLIANCES
Evaluation of the effect of oral appliance treatment on upper-airway ventilation
conditions in obstructive sleep apnea using computational fluid dynamics
Hokuto Suga DDSa, Tomonori IwasakiDDS, PhDa, Katsuaki Mishima DDS, PhDb, Hiroyuki Nakano DDS, PhDc,Yoshiya Ueyama DDS, PhDband Youichi Yamasaki DDS, PhDa
aDepartment of Pediatric Dentistry, Kagoshima University Graduate School of Medical and Dental Sciences, Kagoshima, Japan;bDepartment of Oral and Maxillofacial Surgery, Yamaguchi University Graduate School of Medicine, Yamaguchi, Japan;cDepartment of Dentistry and Oral Surgery, Division of Medicine for Function and Morphology of Sensory Organs, Faculty of Medicine, Osaka Medical College, Osaka, JAPAN
ABSTRACT
Objective: To evaluate the effect of oral appliance (OA) treatment on upper-airway ventilation conditions in patients with obstructive sleep apnea (OSA) using computational fluid dynamics (CFD).
Methods: Fifteen patients received OA treatment and underwent polysomnography (PSG) and computed tomography (CT). CT data were used to reconstruct three-dimensional models of nasal and pharyngeal airways. Airflow velocity and airway pressure measurements at inspiration were simulated using CFD.
Results: The apnea–hypopnea index (AHI) improved from 23.1 to 10.1 events/h after OA treat-ment. On CFD analysis, airflow velocity decreased at the retropalatal and epiglottis-tip levels, while airway pressure decreased at the retropalatal, uvular- and epiglottis-tip levels. The AHI of patients with OSA before OA treatment was correlated with airway pressure at the epiglottis-tip level.
Discussion: Treatment with OA improved the ventilation conditions of the pharyngeal airway and AHI. Results of CFD analysis of airway pressure and airflow velocity helped determine the severity and ventilatory impairment site of OSA, respectively.
KEYWORDS Airway obstruction; computational fluid dynamics; computed tomography; obstructive; oral appliance; polysomnography; respiration; sleep apnea
Introduction
Obstructive sleep apnea (OSA) is an obstructive respiratory disorder that occurs repeatedly during sleep. Consequently, sleep is fragmented, which results in the shortage of sleep; thus, patients experience som-nolence during the day, leading to a decrease in activ-ity. Moreover, when left untreated, OSA can cause long-term complications, such as cardiac, circulatory, and endocrine diseases, and mental illness. Several adverse effects of OSA on vital prognosis have been reported [1–3].
Currently, mainstream therapies for OSA include weight loss for obese patients and conservative treat-ment using continuous positive airway pressure (CPAP) and oral appliances (OAs) [4–6]. Although CPAP treatment is the gold standard, there are cases in which the CPAP apparatus cannot be employed due to issues with its operability or portability or a sense of continuous incongruity with the mask [7].
Guidelines issued by the American Academy of Sleep Medicine (AASM) state that OA treatment is indicated in patients with mild-to-moderate OSA and in those for whom CPAP is not indicated [8]. However, severe OSA has been shown to respond to OA treat-ment. Johal et al. [9] reported that six of eight subjects with severe OSA were successfully treated with OA treatment. Therefore, the indication for OA treatment cannot be determined solely on the basis of OSA severity. To determine whether OA treatment is indi-cated for a patient, it is necessary to evaluate and consider not only the apnea–hypopnea index (AHI) but also upper-airway ventilation conditions.
Previously, cephalometry [10], computed tomography (CT) [11], and endoscopy [12] were used for the evaluation of upper-airway ventilation conditions during OA treat-ment. However, because the upper airway is complicated and extends from the nose to the hypopharynx, the positive effects of OA treatment on ventilation conditions cannot be determined solely by morphologic observation. Recent
CONTACTTomonori Iwasaki [email protected] Department of Pediatric Dentistry, Kagoshima University Graduate School of Medical and Dental Sciences, 8-35-1 Sakuragaoka, Kagoshima City, Kagoshima 890-8544, Japan
Color versions of one or more of the figures in the article can be found online atwww.tandfonline.com/ycra. 2021, VOL. 39, NO. 3, 209–217
https://doi.org/10.1080/08869634.2019.1596554
© 2019 The Author(s). Published with license by Taylor & Francis Group, LLC.
This is an Open Access article distributed under the terms of the Creative Commons Attribution License (http://creativecommons.org/licenses/by/4.0/), which permits unrestricted use, distribution, and reproduction in any medium, provided the original work is properly cited.
OSA–airflow studies have employed computational fluid dynamics (CFD) for analysis [13–17]. In two of those studies, the pharyngeal airway ventilation conditions were changed by use of rapid maxillary expansion and Herbst appliance using CFD [15,16]. Additionally, Mihaescu et al. [14] evaluated changes in the ventilation conditions of the upper airway by maxillomandibular advancement surgery using CFD. The authors of the present study believe that CFD is very effective for the evaluation of upper-airway ventilation conditions, as it can evaluate the flow of air in a manner similar to that during actual breathing, even in cases of upper airways with complicated morphologies. The large negative pressure measured in the pharyngeal airway by CFD may predict pharyngeal-airway collapse during sleep [18,19].
Moreover, functional evaluation of the upper airway using CFD might provide new findings that are not available from morphologic evaluation alone.
This retrospective study was conducted for the pur-pose of evaluating the effect of OA treatment on upper-airway ventilation conditions in OSA using CFD.
Materials and methods
Subjects
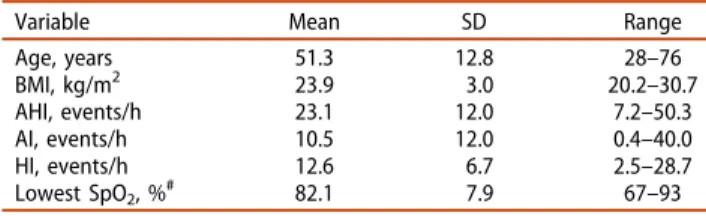
This retrospective study included 15 patients (13 men and 2 women) with OSA who first visited Yamaguchi University Hospital in Ube, Japan between June 2009 and March 2012. The mean age and body mass index (BMI) of the study group were 51.3 years and 23.9 kg/m2, respectively (Table 1). The mean AHI, apnea index (AI), hypopnea index (HI), and lowest oxygen saturation level (SpO2) were 23.1 events/h, 10.5 events/h, 12.6 events/h, and 82.1%, respectively. Those with mild to moderate OSA, determined by polysomnographic (PSG) examina-tions, received OA treatment. In addition, those with severe OSA who dropped out of CPAP treatment received OA treatment [8]. Patients were administered OA treatment with one of two types of mandibular-repositioning devices: seven patients with a history of temporomandibular disorder (TMD) symptoms, such as clicks, received duoblock-type OAs [20–22], while eight
patients without the TMD symptoms received mono-block-type OAs [21,23,24]. For both OA types, the man-dibular protruded positions were titrated. Initially, mandible advancement was set at 50% of the maximum mandibular protruded position. OAs were incrementally titrated according to either a maximal comfortable pro-truded position of the mandible or a resolution of snoring and daytime symptoms [25]. Isacsson et al. [26] reported that there was no significant difference in the treatment effects between the duoblock-type and monoblock-type devices. In this study, there was no significant difference in the amount of mandibular advancement set with either device (monoblock vs. duoblock). Additionally, there was no significant difference in the PSG data (AHI, AI, HI, or SpO2) measured before and after the treatment. Therefore, the present study analyzed the data of the monoblock and duoblock OA groups together.
This study was performed under the approval of Kagoshima University (Kagoshima, Japan; No. 180073 (657) Epi-ver.1) and Yamaguchi University (Yamaguchi, Japan; No. H28-138). Because of the retrospective nature of this study, the requirement for informed consent was waived, and an exemption was granted in writing by the institutional review board.
Polysomnographic and CT examinations
All patients underwent PSG (Alice 5 Diagnostic Sleep System, Philips Respironics, Best, The Netherlands) and CT during the initial consultation and after confirming that there was no problem with the use of OAs after the titration. After the symptom improvement PSG and CT examinations were performed at a mean of six months following the start of OA treatment, with the OA in place. The AHI, AI, HI, and lowest SpO2level were measured by PSG. Apnea was defined as complete cessation of airflow for 10 s, and hypopnea was defined as a 50% reduction in oronasal airflow lasting 10 s with at least 3% desaturation. The AHI was calculated as the number of apnea and hypopnea events per hour of sleep [8].
During the CT examination, each patient was asked not to move his or her head or swallow at the end of expiration. Multi-slice helical CT (SOMATOM Definition, Siemens AG, Erlangen, Germany) images of the upper airway were acquired in supine position in order to reproduce sleep-related breathing conditions. The slice thickness was 0.6 mm. Imaging data were transferred directly to a personal computer and stored in the Digital Imaging and Communications in Medicine format. Before the CT exam, the patients were fully informed of the purpose and risks of the procedure.
Table 1.Baseline characteristics of patients in the study group.
Variable Mean SD Range
Age, years 51.3 12.8 28–76 BMI, kg/m2 23.9 3.0 20.2–30.7 AHI, events/h 23.1 12.0 7.2–50.3 AI, events/h 10.5 12.0 0.4–40.0 HI, events/h 12.6 6.7 2.5–28.7 Lowest SpO2, %# 82.1 7.9 67–93 SD: standard deviation; BMI: body mass index; AHI: apnea–hypopnea index;
AI: apnea index; HI: hypopnea index; SpO2: oxygen saturation. #
Evaluation of upper airway ventilation conditions
Three-dimensional (3D) reconstructions of the upper air-way were generated from the CT data using volume-rendering software (Intage Volume Editor; Cybernet, Tokyo, Japan). The airway was segmented pri-marily on the basis of image intensity with the threshold set midway between the soft tissue and clear airway value. As a result, the threshold was shown from−550 to 1024 Hounsfield Units [27]. Subsequently, the 3D models were converted into smoothed models using mesh-morphing software (DEP Mesh Works/Morpher; IDAJ Co., Kobe, Japan), without losing the patient-specific shape of the upper airway. The ventilation conditions of these upper-airway models were then evaluated by CFD. The models were exported to a fluid-dynamics program (Phoenics; CHAM-Japan, Tokyo, Japan) in stereolithographic format. The fluid was assumed to be Newtonian, homogeneous, and incompressible. Elliptic-staggered equations and the continuity equation were used for analysis. The CFD of the upper-airway models were analyzed at a volumetric flow rate of 500 cm3/s and a no-slip condition at the wall surface [28]. Mean values were calculated after 500 iterations.
Convergence was judged by monitoring the magnitudes of absolute residual sources of mass and momentum nor-malized to their respective inlet fluxes. Iteration was con-tinued until all residuals fell below 0.2% [15,16]. The simulation estimated the airway pressure and airflow velo-city at the hard-palate, retropalatal, uvular-tip, and epiglot-tis-tip levels (Figure 1).
Statistical analysis
In this study, no significant differences in variables were found in relation to sex and age. Therefore, statistical analysis was performed using a pooled sample. For all variables, the paired t-test was performed to determine the significance of the treatment-associated changes
detected after PSG. Whenever a variable exhibited non-normal distribution of data or differing variance, the sig-nificance of treatment-associated changes after CFD was determined using the nonparametric Wilcoxon rank test. Intersite differences were determined using the Friedman test with Bonferroni correction. Spearman’s correlation coefficients were calculated to evaluate the relationships between PSG data and maximal negative pressure within the four parts of the pharyngeal airway. Statistical signifi-cance in all tests was set atp < 0.05.
A power analysis was performed to calculate the β error (1 – β error = 0.80; α = 0.05; two-tailed test); the target sample size was 13 subjects. Therefore, the present sample size was sufficient for this analysis. All measurements were repeated after one week by the same investigator (HS), and method errors were calculated using Dahlberg’s for-mula [29]. The method errors of maximal airway pressure and airflow velocity were 1.712 Pa and 0.062 m/s, respectively. On the basis of the results of repeated analyses, these method errors were con-sidered negligible.
Results
Results of PSG
After OA treatment, the mean AHI, AI, HI, and lowest SpO2 level significantly improved from 23.1 events/h, 10.5 events/h, 12.6 events/h, and 82.1% to 10.1 events/ h, 3.3 events/h, 6.8 events/h, and 88.7%, respectively (Table 2).
Results of CFD analysis
Before OA treatment, airflow velocities at the retro-palatal and uvular-tip levels were faster than those at the hard-palate level (Table 3), while negative-pressure
Figure 1.Evaluations of airway pressure and airflow velocity at each pharyngeal-airway location: (a) hard-palate level; (b) retro-palatal level; (c) uvular-tip level; and (d) epiglottis-tip level.
levels at the uvular- and epiglottis-tip levels were higher than those at the hard-palate level (Table 4). After OA treatment, airflow velocities at the retropala-tal and epiglottis-tip levels significantly decreased from 9.0 to 5.3 m/s (p = 0.006) and 6.8 to 4.8 m/s (p = 0.024), respectively (Table 3). Moreover, negative-pressure levels at the retropalatal, uvular-tip, and epi-glottis-tip levels significantly decreased from−130.3 to −51.3 Pa, −163.1 to −76.4 Pa, and −167.2 to −77.2 Pa, respectively (Table 4). Before OA treatment, AHI was
correlated with negative pressure at the epiglottis-tip level (rs = −0.521; p = 0.046; Table 5). However, after OA treatment, AHI was not correlated with negative pressure at any of the levels (Table 6). In addition, post-treatment change in AHI was correlated with that in negative pressure at the uvular- (rs = −0.582; p = 0.023) and epiglottis-tip (rs = −0.536; p = 0.040;
Table 7) levels. Discussion
The present study investigated changes in the airway ven-tilation conditions after OA treatment in patients with OSA by means of CFD analysis of upper-airway models extending from the nasal cavity to the hypopharynx.
Relationship between AHI and airway pressure in CFD models
In a previous study that performed CFD analysis of upper-airway ventilation conditions at inspiration in obese children with adenoidal hypertrophy, Wootton
Table 2.Comparison of polysomnographic indices recorded during the initial consultation and after symptom improvement in the study group.
Variable
Before After
Post-treatment change
p-value Mean SD Mean SD Mean SD
AHI, events/h 23.1 12.0 10.1 6.0 −13.0 10.7 < 0.001 AI, events/h 10.5 12.0 3.3 4.0 −7.2 8.5 0.005 HI, events/h 12.6 6.7 6.8 4.1 −5.8 7.7 0.011 Lowest SpO2, % # 82.1 7.9 88.7 4.4 6.1 5.6 0.001 SD: standard deviation; AHI: apnea–hypopnea index; AI: apnea index; HI:
hypopnea index; SpO2: oxygen saturation. #
It was not possible to measure the SpO2level in one case.
Table 3.Post-treatment change in airflow velocity in the upper airway.
Airflow velocity, m/s
Hard-palate level Retropalatal level Uvular-tip level Epiglottis-tip level Intersite differencesa
Mean SD Mean SD Mean SD Mean SD p Post-hoc
Before 2.6 1.3 9.0 5.7 8.2 5.5 6.8 3.1 < 0.001 12, 13
After 2.1 0.9 5.3 2.9 6.6 3.2 4.8 2.0 < 0.001 12, 13, 14
Post-treatment change −0.5 1.0 −3.7 5.0** −1.6 4.4 −2.0 2.9* 0.147
SD: standard deviation. Significant difference between pre- and post-treatment levels: **p < 0.01 and *p < 0.05.aSignificant intersite differences identified by the Friedman test with Bonferroni’s correction: 12, hard-palate level vs. retropalatal level; 13, hard-palate level vs. uvular-tip level; 14, hard-palate level vs. epiglottis-tip level.
Table 4.Post-treatment change in upper-airway pressure.
Airway pressure, Pa
Hard-palate level Retropalatal level Uvular-tip level Epiglottis-tip level Intersite differencesa
Mean SD Mean SD Mean SD Mean SD p Post-hoc
Before −50.9 44.2 −130.3 85.8 −163.1 119.8 −167.2 113.9 <0.001 13, 14 After −27.8 21.0 −51.3 38.3 −76.4 45.4 −77.2 46.2 <0.001 13, 14 Post-treatment change 23.1 46.2 79.0 80.1** 86.7 100.8* 90.0 100.5** 0.006
SD: standard deviation. Significant difference between pre- and post-treatment levels: **p < 0.01 and *p < 0.05.aSignificant intersite differences identified by the Friedman test with Bonferroni’s correction: 13, hard-palate level vs. uvular-tip level; 14, hard-palate level vs. epiglottis-tip level.
Table 5.Correlation between sleep data and upper-airway pressure before oral-appliance treatment.
Airway pressure (Pa)
Hard-palate level Retropalatal level Uvular-tip level Epiglottis-tip level
rs p rs p rs p rs p
AHI, events/h 0.247 0.376 −0.450 0.092 −0.496 0.060 −0.521 0.046
AI, events/h −0.127 0.652 −0.404 0.136 −0.386 0.156 −0.314 0.254
HI, events/h 0.297 0.283 −0.129 0.648 −0.132 0.639 −0.232 0.405
Lowest SpO2, %# −0.006 0.985 0.317 0.270 0.387 0.171 0.387 0.171 AHI: apnea–hypopnea index; AI: apnea index; HI: hypopnea index; SpO2: oxygen saturation. rs: Spearman’s rank correlation coefficient.
#It was not possible to measure the SpO
et al. [18] reported that negative pressure of the phar-yngeal airway was closely associated with the severity of OSA. Therefore, the present study examined the rela-tionship between airway pressure and PSG data in patients with OSA before OA treatment and found a correlation between pretreatment negative airway pressure at the epiglottis-tip level and AHI.
Downing and Ku [30] reported that large negative pressure in the pharyngeal airway at inspiration induces pharyngeal-airway collapse. In the present study, the pretreatment negative pressure at the epi-glottis-tip level was large and correlated with pretreat-ment AHI. The epiglottis-tip level is the anatomical site that can easily induce glossoptosis. Therefore, the pre-sent study concluded that negative pressure at the epiglottis-tip level is correlated with pharyngeal-airway collapse.
Additionally, it is easy to physically transform the airway at the retropalatal and uvular-tip levels. It is, therefore, believed that pharyngeal-airway collapse is easily induced at these levels. In the present study, although negative-pressure levels at the retropalatal (rs = −0.450; p = 0.092) and uvular-tip (rs = −0.496; p = 0.060) levels were not significantly different, they showed a weak correlation with AHI; they showed the same tendency at the epiglottis-tip level. It is possible that these results might have been influenced by the small sample size. Nevertheless, these results suggest that CFD analysis of negative-airway pressure at inspiration is an effective method for evaluating the severity of OSA, which the authors believe to be
a novel finding because it cannot be obtained solely by morphological observation.
Airflow velocity in CFD models
In a previous study, Downing and Ku [30] reported that airflow velocities obtained from CFD models are affected by the size and shape of the airway and that a narrowed airway is subject to higher airflow velocities than an unob-structed one. In other words, in a CFD model, the site with the higher airflow velocity indicates the region of ventila-tory impairment. In the present study, airflow velocities at the retropalatal and uvular-tip levels in OSA patients before OA treatment were faster than those at the hard-palate level. The authors believe that, in these patients, airways at the retropalatal and uvular-tip levels were nar-row, which caused ventilatory impairment. In many stu-dies, endoscopy findings have revealed that patients with OSA exhibit obstruction in the velopharynx [31,32]. The retropalatal and uvular-tip levels defined in the present study correspond to the velopharynx, and the results observed in this study are similar to those reported in previous studies. These findings indicate that airflow velo-cities determined by CFD analysis might be effective for detecting sites of ventilatory impairment in the airway.
CFD findings after OA treatment
The present study evaluated the changes in upper-airway ventilation conditions after OA treatment by performing CFD analysis. After OA treatment, airflow
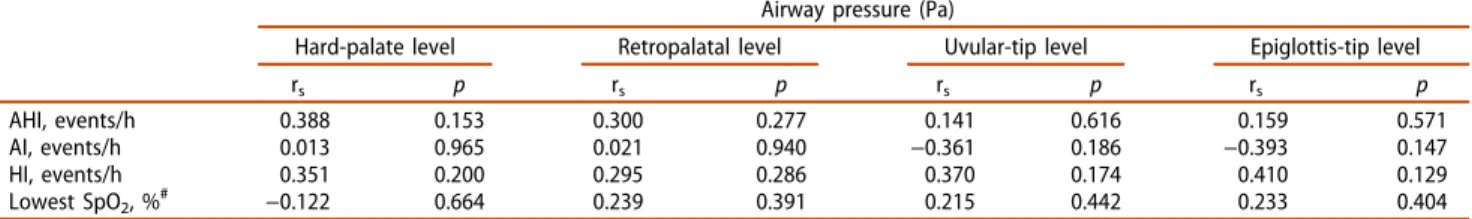
Table 6.Correlation between sleep data and upper-airway pressure after oral-appliance treatment.
Airway pressure (Pa)
Hard-palate level Retropalatal level Uvular-tip level Epiglottis-tip level
rs p rs p rs p rs p
AHI, events/h 0.388 0.153 0.300 0.277 0.141 0.616 0.159 0.571
AI, events/h 0.013 0.965 0.021 0.940 −0.361 0.186 −0.393 0.147
HI, events/h 0.351 0.200 0.295 0.286 0.370 0.174 0.410 0.129
Lowest SpO2, %# −0.122 0.664 0.239 0.391 0.215 0.442 0.233 0.404 AHI: apnea–hypopnea index; AI: apnea index; HI: hypopnea index; SpO2: oxygen saturation. rs: Spearman’s rank correlation coefficient.
#It was not possible to measure the SpO
2level in one case.
Table 7.Correlation between sleep data and upper-airway pressure with relation to treatment change.
Airway pressure (Pa)
Hard-palate level Retropalatal level Uvular-tip level Epiglottis-tip level
rs p rs p rs p rs p
AHI, events/h 0.168 0.550 −0.475 0.073 −0.582 0.023 −0.536 0.040
AI, events/h 0.016 0.955 −0.239 0.391 −0.274 0.324 −0.145 0.607
HI, events/h 0.221 0.428 −0.442 0.100 −0.386 0.156 −0.507 0.054
Lowest SpO2, %# −0.038 0.898 0.030 0.919 0.193 0.510 0.075 0.798 AHI: apnea–hypopnea index; AI: apnea index; HI: hypopnea index; SpO2: oxygen saturation. rs: Spearman’s rank correlation coefficient.
#
velocities at the retropalatal and epiglottis-tip levels, as well as negative-pressure levels at the retropalatal, uvu-lar-tip, and epiglottis-tip levels, decreased significantly relative to pretreatment levels.
Chan et al. [33] evaluated morphological changes of the pharyngeal airway after OA treatment on the basis of magnetic resonance imaging findings and found that the volume of the velopharynx and hypopharynx had increased after treatment. Additionally, the present findings indicated that OA treatment might help enlarge the pharyngeal airway at the retropalatal and epiglottis-tip levels, leading to improvement of ventila-tion condiventila-tions in the pharyngeal airway.
Changes in CFD and PSG data after OA treatment
In the present study, the post-treatment change in AHI was correlated with that in negative pressure at the uvular- and epiglottis-tip levels. This suggests that it is important to improve the negative-pressure levels at the uvular- and epiglottis-tip levels to achieve a decrease in AHI. In an endoscopy study, Sasao et al. [12] evaluated morphological changes in the pharyn-geal airway when the lower jaw was moved forward. The authors found that the velopharynx enlarges with OA treatment, which easily allows improvement of AHI.
Expansion of the velopharynx, leading to ventilatory impairment, has an influence on downstream airflow. It is possible that, in the present study, the velopharynx was enlarged because of OA treatment, leading to improvement in ventilatory impairment. This, in turn, might have helped relieve the negative pressure at the uvular- and epiglottis-tip levels, causing a decrease in AHI.
Validity of CFD models
In a study by Zhao et al. [34], pharyngeal-airway pres-sure before OA treatment in patients with OSA was approximately−50 Pa, which is lower than the pressure level observed in the present study. However, the flow rate reported in the previous study was one-third of the value observed in the present study. Therefore, the authors believe that the present results show a similar tendency as those reported by Zhao et al. and that the CFD methodology is accurate in the present study.
Case presentation
Although there have been several reports on the elig-ibility criteria for OA treatment and the effect of OAs on OSA [8,9,12,35], there are few reports on the reason
for failure of OA treatment in some instances. This section depicts the results of CFD analysis of patients who were responsive or nonresponsive to OA treatment.
One of the responsive patients exhibited severe OSA and a pretreatment AHI of 50.3 events/h. However, after OA treatment, the AHI had decreased to 15.7 events/h, which indicated a 68.8% improvement (Figure 2). The results of CFD analysis revealed that OA treatment had led to improvement of airflow velocity and negative pres-sure from the retropalatal level to the epiglottis-tip level. Although this patient did not meet the AASM eligibility criteria for OSA severity [8], the authors believe that improvement of ventilatory impairment with OA treat-ment led to a decrease in AHI in this case.
In a representative nonresponsive case, in which the AHI did not improve upon OA treatment, a patient exhibited a pretreatment AHI of 20.1 events/h and moderate OSA in accordance with the AASM guide-lines; this was a case in which OA treatment was indicated [8]. The pretreatment airflow velocity and negative pressure at the epiglottis-tip level were high. After treatment, the AHI in this case had increased to 29.0 events/h (Figure 3a,b), and negative-pressure levels had increased in the entire upper airway. In the present study, these findings were confirmed by ana-lyzing a sagittal section of the left side of the nose (Figure 3c), which revealed a site in the nasal airway that exhibited relatively high airflow velocity; the nega-tive-pressure level downstream from the site was also high. In this case, although OA treatment helped improve the airflow velocity at the epiglottis-tip level, the AHI was thought to have increased because of a problem in the nose that had occurred during treatment.
The findings of these two cases suggest that CFD analysis of not only the pharyngeal airway but also the upper airway (including the nasal airway) is effective for detecting sites of ventilatory impairment and might contribute to improvement of treatment outcomes in OSA.
Limitations
The upper-airway model constructed in this study used data generated in the wake state (not the sleep state); therefore, it did not include an adjustment for transfor-mation during breathing. However, pharyngeal-airway pressure at inspiration and in deep stages of sleep with complete muscle atonia and airway collapse influence airway transformation during sleep. However, the authors believe that the results obtained by analysis of data generated in an awakened state may be useful
because the present data revealed a correlation between pharyngeal airway pressure and sleep parameters.
With regard to OA treatment, because of differences in the clinical states of individuals, the present study did not administer a uniform type of OA or achieve a uniform change in mandibular position. This was
a preliminary study, and the authors intend to perform detailed and individual analyses in a larger sample in the future.
Furthermore, a randomized sampling approach was not used, which may have introduced a bias based on the available patients; this should be considered when
Figure 2.A case of severe OSA in which the symptoms improved after OA treatment. (a) Before treatment – The AHI was 50.3 events/h. Left: The airflow velocity was extremely high from the retropalatal level to the epiglottis-tip level, which revealed the causative site of the severe OSA (large red arrows). Right: The negative pressure at the lower part of the retropalatal level was extremely high, causing strong contraction of the lower part of the retropalatal level (large red arrows). (b) After treatment– The AHI had improved to 15.7 events/h. Left: The airflow velocity from the retropalatal level to the epiglottis-tip level had decreased after OA treatment (small yellow arrow). Right: The negative pressure at the lower part of the retropalatal level had decreased after OA treatment (small yellow arrows). OSA: obstructive sleep apnea; OA: oral appliance; AHI: apnea–hypopnea index.
Figure 3.A case of mild-to-moderate OSA in which the symptoms did not improve with OA treatment. (a) Before treatment– The AHI was 20.1 events/h. Left: The airflow velocity was extremely high at the epiglottis-tip level (large red arrow). Right: The negative pressure was extremely high at the epiglottis-tip level (large red arrow). (b) After treatment– The AHI had worsened to 29.0 events/ h. Left: The airflow velocity at the epiglottis-tip level had decreased after OA treatment (small yellow arrow). Right: However, the negative pharyngeal-airway pressure had become even more severe (large red arrow). (c) After treatment– Left: Frontal view of the upper airway; the red line cuts off the left part of the nose. Right: Sagittal view of a plane on the left side of the nose. The airflow velocity at the nose was extremely high, which indicated the site of ventilatory impairment (large red arrow). In this case, OSA was thought to be caused by nasal-airway obstruction. OSA: obstructive sleep apnea; OA: oral appliance; AHI: apnea–hypopnea index.
interpreting the findings of this study. A future study should include a randomized approach, in order to reduce the risk of bias during patient sampling.
Conclusion
The present study examined the changes in upper-airway ventilation conditions after OA treatment using CFD. The results demonstrated that OA treatment improved the ventilation conditions of the pharyngeal airway and significantly improved the AHI. Additionally, airway pressure and airflow velocity data obtained from CFD models demonstrated the severity of OSA and the site of ventilatory impairment in OSA, respectively.
Conflicts of interest
The authors have no potential conflicts of interest to declare.
Funding
This work was supported by Grants-in-Aid for Scientific Research (KAKENHI) from the Japan Society for the Promotion of Science (JSPS) (15K20605, 16K15841, 17K11965, and 18K09859)
References
[1] He J, Kryger MH, Zorick FJ, et al. Mortality and apnea index in obstructive sleep apnea. Experience in 385 male patients. Chest.1988;94(1):9–14.
[2] Campos-Rodriguez F, Peña-Griñan N, Reyes-Nuñez N, et al. Mortality in obstructive sleep apnea-hypopnea patients treated with positive air way pressure. Chest. 2005;128(2):624–633.
[3] Marin JM, Carrizo SJ, Vicente E, et al. Long-term car-diovascular outcomes in men with obstructive sleep apnoea-hypopnoea with or without treatment with con-tinuous positive airway pressure: an observational study. Lancet. 2005;365(9464):1046–1053.
[4] Clark GT, Blumenfeld I, Yoffe N, et al. A crossover study comparing the efficacy of continuous positive air-way pressure with anterior mandibular positioning devices on patients with obstructive sleep apnea. Chest.1996;109(6):1477–1483.
[5] Ferguson KA, Ono T, Lowe AA, et al. A randomized cross-over study of an oral appliance vs nasal-continuous positive airway pressure in the treatment of mild-moderate obstruc-tive sleep apnea. Chest.1996;109(5):1269–1275.
[6] Engleman HM, McDonald JP, Graham D, et al. Randomized crossover trial of two treatments for sleep apnea hypopnea syndrome. Am J Respir Crit Care Med. 2002;166(6):855–859.
[7] Sawyer AM, Gooneratne NS, Marcus CL, et al. A systematic review of CPAP adherence across age groups: clinical and empiric insights for developing CPAP adherence interventions. Sleep Med Rev. 2011;15(6):343–356.
[8] Kushida CA, Morgenthaler TI, Littner MR, et al. Practice parameters for the treatment of snoring and obstructive sleep apnea with oral appliances: an update for 2005. Sleep.2006;29(2):240–243.
[9] Johal A, Battagel JM, Kotecha BT. Sleep nasendoscopy: a diagnostic tool for predicting treatment success with mandibular advancement splints in obstructive sleep apnoea. Eur J Orthod.2005;27(6):607–614.
[10] Doff MH, Hoekema A, Pruim GJ, et al. Effects of a mandibular advancement device on the upper airway morphology: a cephalometric analysis. J Oral Rehabil. 2009;36(5):330–337.
[11] Kaur A, Chand P, Singh RD, et al. Computed tomographic evaluation of the effects of mandibular advancement devices on pharyngeal dimension changes in patients with obstruc-tive sleep apnea. Int J Prosthodont.2012;25(5):497–505. [12] Sasao Y, Nohara K, Okuno K, et al. Videoendoscopic
diagnosis for predicting the response to oral appliance therapy in severe obstructive sleep apnea. Sleep Breath. 2014;18(4):809–815.
[13] Xu C, Sin S, McDonough JM, et al. Computational fluid dynamics modeling of the upper airway of children with obstructive sleep apnea syndrome in steady flow. J Biomech.2006;39(11):2043–2054.
[14] Mihaescu M, Mylavarapu G, Gutmark EJ, et al. Large eddy simulation of the pharyngeal airflow associated with obstructive sleep apnea syndrome at pre and post-surgical treatment. J Biomech.2011;44(12):2221–2228.
[15] Iwasaki T, Takemoto Y, Inada E, et al. The effect of rapid maxillary expansion on pharyngeal airway pres-sure during inspiration evaluated using computational fluid dynamics. Int J Pediatr Otorhinolaryngol.2014;78 (8):1258–1264.
[16] Iwasaki T, Sato H, Suga H, et al. Herbst appliance effects on pharyngeal airway ventilation evaluated using computa-tional fluid dynamics. Angle Orthod.2017;87(3):397–403. [17] De Backer JW, Vanderveken OM, Vos WG, et al.
Functional imaging using computational fluid dynamics to predict treatment success of mandibular advance-ment devices in sleep-disordered breathing. J Biomech. 2007;40(16):3708–3714.
[18] Wootton DM, Luo H, Persak SC, et al. Computational fluid dynamics endpoints to characterize obstructive sleep apnea syndrome in children. J Appl Physiol. 2014;116(1):104–112.
[19] Wu MJ, Ho CY, Tsai HH, et al. Retropalatal Müller grade is associated with the severity of obstructive sleep apnea in non-obese Asian patients. Retropalatal Müller grade and OSA in non-obese. Sleep Breath.2011;15(4):799–807. [20] Nakano H, Mishima K, Matsushita A, et al. Efficacy of
the Silensor for treating obstructive sleep apnea syndrome. Oral Maxillofac Surg.2013;17(2):105–108. [21] Suga H, Mishima K, Nakano H, et al. Different therapeutic
mechanisms of rigid and semi-rigid mandibular reposition-ing devices in obstructive sleep apnea syndrome. J Craniomaxillofac Surg.2014;42(8):1650–1654.
[22] Sutherland K, Chan ASL, Ngiam J, et al. Qualitative assessment of awake nasopharyngoscopy for prediction of oral appliance treatment response in obstructive sleep apnoea. Sleep Breath.2018;22(4):1029–1036.
[23] Rose EC, Schnegelsberg C, Staats R, et al. Occlusal side effects caused by a mandibular advancement appliance
in patients with obstructive sleep apnea. Angle Orthod. 2001;71(6):452–460.
[24] Doff MH, Veldhuis SK, Hoekema A, et al. Long-term oral appliance therapy in obstructive sleep apnea syn-drome: a controlled study on temporomandibular side effects. Clin Oral Investig.2012;16(3):689–697.
[25] Okuno K, Sasao Y, Nohara K, et al. Endoscopy evalua-tion to predict oral appliance outcomes in obstructive sleep apnoea. Eur Respir J.2016;47(5):1410–1419. [26] Isacsson G, Nohlert E, Fransson AMC, et al. Use of bibloc
and monobloc oral appliances in obstructive sleep apnoea: a multicentre, randomized, blinded, parallel-group equiva-lence trial. Eur J Orthod.2018. doi:10.1093/ejo/cjy030. [27] Iwasaki T, Saitoh I, Takemoto Y, et al. Evaluation of
upper airway obstruction in Class II children with fluid-mechanical simulation. Am J Orthod Dentofacial Orthop.2011;139(2):e135–145.
[28] Mukaihara K, Hasegawa-Moriyama M, Iwasaki T, et al. Evaluation of the pharyngeal airway using computa-tional fluid dynamics in patients with acromegaly. Laryngoscope Investig Otolaryngol.2018;3(2):133–138. [29] Dahlberg G. Statistical methods for medical and biological
students. London: George Allen and Unwin, Ltd.;1940.
[30] Downing JM, Ku DN. Effects of frictional losses and pulsatile flow on the collapse of stenotic arteries. J Biomech Eng.1997;119(3):317–324.
[31] Ravesloot MJ, de Vries N. One hundred consecutive patients undergoing drug-induced sleep endoscopy: results and evaluation. Laryngoscope. 2011;121 (12):2710–2716.
[32] De Corso E, Bastanza G, Della Marca G, et al. Drug-induced sleep endoscopy as a selection tool for mandib-ular advancement therapy by oral device in patients with mild to moderate obstructive sleep apnoea. Acta Otorhinolaryngol Ital.2015;35(6):426–432.
[33] Chan AS, Sutherland K, Schwab RJ, et al. The effect of mandibular advancement on upper airway structure in obstructive sleep apnoea. Thorax.2010;65(8):726–732. [34] Zhao M, Barber T, Cistulli P, et al. Computational fluid
dynamics for the assessment of upper airway response to oral appliance treatment in obstructive sleep apnea. J Biomech.2013;46(1):142–150.
[35] Gjerde K, Lehmann S, Berge ME, et al. Oral appliance treatment in moderate and severe obstructive sleep apnoea patients non-adherent to CPAP. J Oral Rehabil.2016;43(4):249–258.