ANALYSIS OF NITROGEN RUNOFF PROCESSES USING
ISOTOPIC APPROACH: A CASE STUDY IN A PADDY FIELD IN
JAPAN
同位体アプローチによる窒素流出過程の解析:日本の水田におけるケースス タディ
September 2015
ANALYSIS OF NITROGEN RUNOFF PROCESSES USING
ISOTOPIC APPROACH: A CASE STUDY IN A PADDY FIELD IN
JAPAN
同位体アプローチによる窒素流出過程の解析:日本の水田におけるケースス
タディ
A dissertation submitted in partial fulfillment of the requirements for the degree of Doctor of Philosophy in Engineering
Special Doctoral Course on Integrated River Basin Management Interdisciplinary Graduate School of Medicine and Engineering
University of Yamanashi
September 2015
i
ACKNOWLEDGMENTS
I could never have been accomplished my research without the guidance of my committee members, support and encouragement from a lot of people throughout my life in Japan.
Foremost, I would like to express my deepest gratitude to my supervisor Assoc.Prof.Nishida Kei for his guidance, lots of encouragement, patience, caring and providing me with an excellent atmosphere for my PhD life. I also would like to give my thankfulness to co-advisors and committee members: Prof. Sakamoto Yasushi, Prof. Kazama Futaba, Prof. Shindo Junko, Assoc. Prof. Ishidaira Hiroshi and Assoc. Prof. Ichikawa Yutaka for their insightful comments, suggestions and hard questions.
My sincere thank also goes to Dr. Takashi Nakamura for his continuous discussions and supports during my research. I would like to express my acknowledge to Sano Myumi for her supports in the isotope laboratory activities during my research work. Many thanks to Mr. Takehiro Okamoto for his help in the field as well as in the laboratory. I would like to thank Mr. Kohshi Otoguro for kindly providing access to his paddy field. I would like to express my sincere appreciation to Assoc. Prof. Nguyen Thi Hue – Institute of Environmental Technology for her kindly supports to my study.
I am very grateful to the Ministry of Education, Culture, Sport, Science and Technology (MEXT) for the financial support during my PhD study.
I would like to extend my sincere thanks to all professors and colleagues of ICRE and to all my friends in Environmental Dynamics lab for their kindly helps and supports.
I would like to thank all my dear friends for their friendships, which have been cheering me up and stood by me through the good times and bad in Japan.
Finally, I would like to special acknowledgement to my family: my parents, sisters and brother for their support and love during my life. Special thanks to my husband for your patient waiting and taking care of our lovely son.
iii
ABSTRACT
Demand of rice production is increasing with rapid growth of population over the world. Nitrogen (N) input is essential for cropping rice and, at the present time, chemical fertilizers, organic fertilizers or animal wastes are more applied for higher yield of rice especially in Asian and African regions. However, when the N input is excessive, significant amount of N becomes pollution load to surrounding environments through various pathways (e.g. runoff, denitrification, volatilisation). To reduce the N loss from paddy field to the environment, it is necessary to understand the original sources of N inputs as well as transformation and transport processes in paddy field.
A number of studies have identified the sources of N or N-transformation and transport processes in water system or paddy fields by using stable isotope or N budget calculation. However, few studies identified N sources and their transformation processes in drainage or percolation, or N transport in paddy field. In addition, these researches focused on identification of N sources and their transformation processes in only one type of water flow (drainage or percolation). Only limited number of researches focused on N transport processes in paddy field and temporal variation under paddy practices in long-term. Therefore, in this study, the combined analysis of concentration, N budget and N stable ratio was applied to identify the sources of N and their transformation processes in runoff waters (drainage and percolation) and the pathways of N losses to environment (i.e. water runoff, air emission, rice plant uptake) by conducting field survey in a paddy field in Japan for two years (detailed in Chapter 3).
Chapter 4 showed that the results from the continuous survey demonstrate that NO3− and
PN were dominant form of TN in both drainage and percolation waters during soil paddling period. DON was the main forms of TN in drainage water, whereas NO3− and DON were
the main forms of TN in percolation water, during the irrigation and non-irrigation period. During the fallow (non-cropping) period, NO3− was dominant form of TN in percolation
water. Highest nitrogen concentrations were observed during soil paddling period and it tended to rapidly decrease at the beginning of the irrigation period and increased during the non-irrigation and fallow periods.
Chapter 5 showed that the estimated N loading budget indicates that annual losses of N via drainage and percolation were 57 – 138 kgN/ha, accounting for 32 – 64% of total N output. Losses of NO3− and DON load were predominant in percolation, amounting to 48.6
iv
and 39.7% on average of the total N load via percolation, respectively, while DON load was predominant in drainage water (50.1% on average of TN load) during the irrigation period. During the non-irrigation and fallow periods, contribution of NO3− load in percolation
amounted to 60% of TN load, whereas losses of NO3− and DON load accounted for 34 and
51 % of annual TN load in drainage, respectively. The N budget calculation also showed that N loss by denitrification was less than 1% of total N output, whereas high contribution of irrigation water to a paddy field, 47 – 65% of total N input.
Chapter 6 showed that the runoff water samples collected during soil paddling period had low δ15N–NO
3− values of -3.8 to 0.6‰, suggesting that chemical fertilizer was the main
source of NO3−. Strong correlation between the δ15N–NO3− values in irrigation and
drainage waters and the N isotope ratios during irrigation period suggested that irrigation water and chemical/organic fertilizers in soil were N sources in drainage, while chemical/organic fertilizers in soil were N sources in percolation during the same period. During both non-irrigation and fallow periods, the N isotope ratios in NO3− implied that
chemical/organic fertilizers in soil were the source of NO3− in drainage and percolation
waters. The combined analysis of concentration and a dual isotope of NO3− indicated that
denitrification was not clearly observed in most samples in this case study, while nitrification was possibly enhanced during the non-irrigation and fallow periods.
In summary, the proposed analysis with combination of concentration variation, N budget and N stable isotopes demonstrated the usefulness to identify N sources, transport and transformation processes in paddy field for better agricultural management and water environment.
v TABLE OF CONTENTS ACKNOWLEDGMENTS ... i ABSTRACT ... iii LIST OF FIGURES ... ix LIST OF TABLES ... xi CHAPTER 1 ... 1 INTRODUCTION ... 1 1.1. Statement of purpose ... 3 1.2. Research objectives ... 5 1.3. Dissertation structure ... 5 CHAPTER 2 ... 9 LITERATURE REVIEW ... 9
2.1. Overview of N processes in paddy filed ... 11
2.1.1. N-transformation processes ... 11
2.1.2. N-transport processes ... 13
2.2. N loss from paddy field to water environment ... 13
2.3. Applying stable isotope to identity the N sources in groundwater and surface water ... 15
2.3.1. Nitrogen isotope ratio and kinetic isotope fractionation... 15
2.3.2. Identification of nitrogen sources ... 16
2.4. Conclusion ... 18 CHAPTER 3 ... 19 METHODOLOGY ... 19 3.1. Research framework ... 21 3.2. Study area ... 22 3.3. Sampling ... 24 3.3.1. Water sampling ... 24
3.3.2. Soil and plant ... 24
3.4. Analysis method ... 25
3.4.1. Analysis of temperature, pH, EC and nitrogen concentrations in water ... 25
vi
3.4.3. Analysis of δ 15Nand percentage of N in the soil and plant and fertilizer ... 27
3.5. Hydrological measurement ... 27
3.6. Nitrogen budget ... 29
CHAPTER 4 ... 33
TEMPORAL VARIATION OF NITROGEN CONCENTRATION AND COMPOSITIONS33 4.1. Introduction ... 35
4.2. Nitrogen concentration in irriagation water ... 35
4.3. Characteristic of nitrogen in drainage water ... 36
4.4. Characteristic of nitrogen in percolation water ... 39
4.5. Conclusions ... 42
CHAPTER 5 ... 43
BALANCE ANALYSES FOR WATER AND NITROGEN ... 43
5.1. Introduction ... 45
5.2. Water balance ... 45
5.2.1. Rainfall ... 45
5.2.2. Estimation of water balance ... 46
5.3. Nitrogen losses through drainage ... 47
5.4. Nitrogen losses through percolation ... 52
5.5. Nitrogen budget ... 55
5.6. Conclusions ... 59
CHAPTER 6 ... 61
IDENTIFICATION OF NITROGEN SOURCES, TRANSPORT AND TRANSFORMATION PROCESSES ... 61
6.1. Introduction ... 63
6.2. Isotopic signature of potential nitrogen sources ... 63
6.3. Nitrogen sources in runoff waters (drainage and percolation) ... 64
6.3.1. End Member Mixing Analysis (EMMA) for sources and processes identification65 6.3.2. Identification of nitrogen source during the soil paddling period ... 66
6.3.3. Identification of nitrogen source during the irrigation periods ... 69
6.3.4. Identification of nitrogen source during the non-irrigation and fallow periods . 73 6.4. Conclusions ... 74
vii
SUMMARY OF THE RESEARCH ... 77
7.1. Conclusions ... 79
7.2. Recommendation and contributions ... 80
REFERENCES ... 81
APPENDIXS ... 91
Appendix 1. Concentration of suspended solids in runoff water of two years observation ... 93
Appendix 2. The δ15N values and percentage of N in a paddy soil ... 97
Appendix 3. The δ15N and δ18O of NO3− in soil water extracts ... 98
ix
LIST OF FIGURES
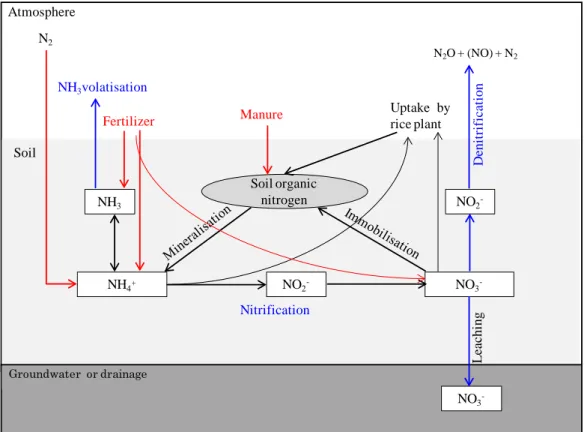
Figure 2.1. A simplified nitrogen cycle in paddy field. Red, blue and black arrow colors are
representative N input to paddy filed, the pathways of N losses to environment and N cycling,
respectively. Adapted from Hofman & Cleemput (2004) and Duetsch PhD thesis (2005). ... 11
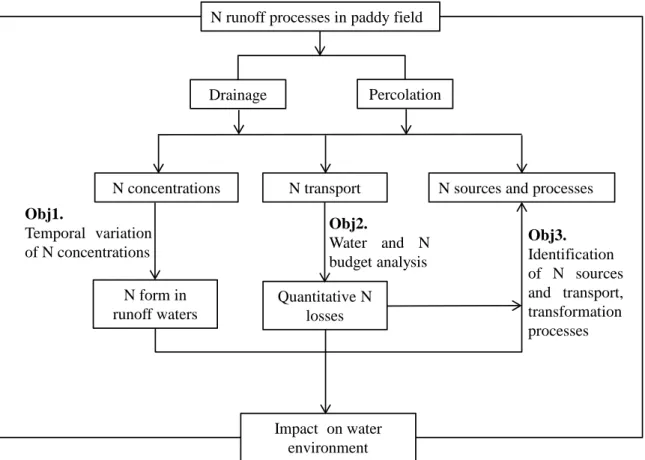
Figure 3.1. Research framework to combine chemical analysis, N budget calculation and isotopic approach ... 21
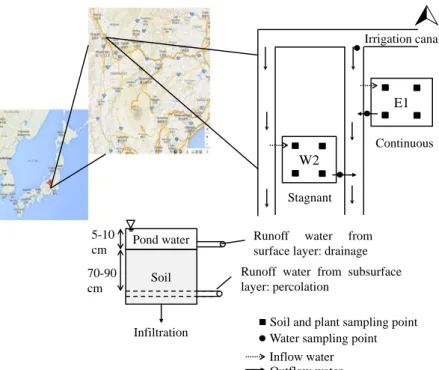
Figure 3.2. Location and schematic of the experimental field in Kai City, Yamanashi Prefecture, Japan ... 22
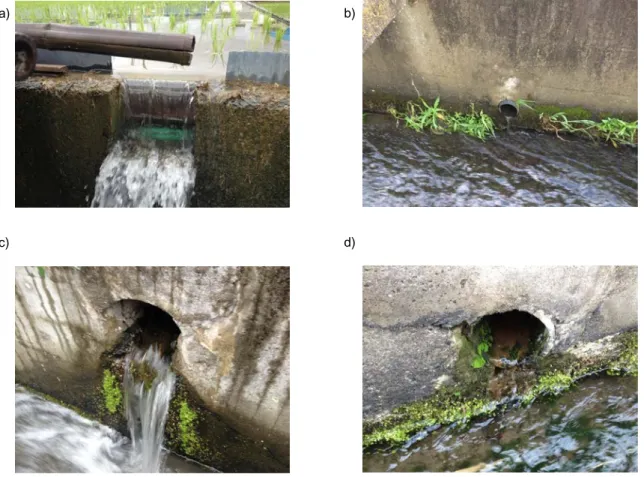
Figure 3.3. Sampling site of drainage and percolation; a) E1drainage, b) E1percolation, c) W2 drainage, d) W2 percolation ... 25
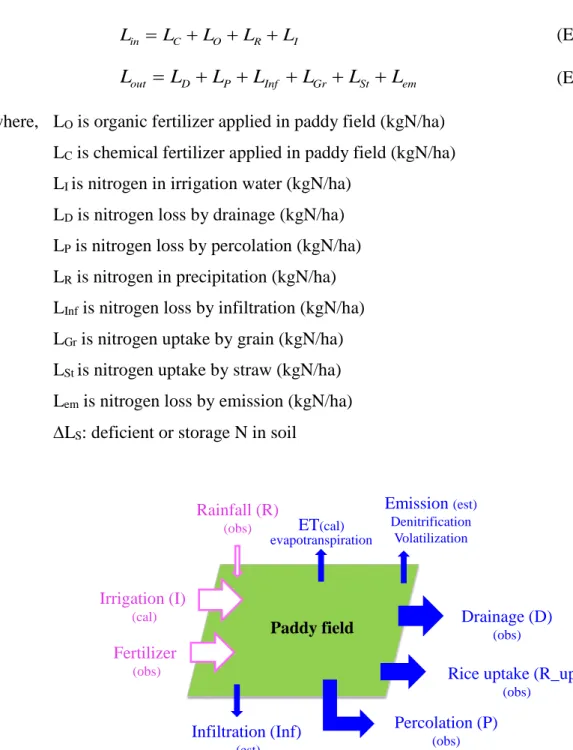
Figure 3.4. A simplified illustration of nitrogen budget calculation in a paddy field; open and close arrows indicated N input and output, respectively. ... 30
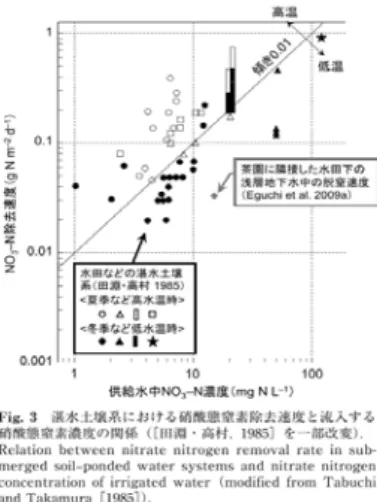
Figure 3.5. Estimation of N loss via denitrification, referred to Eguchi (2012) ... 31
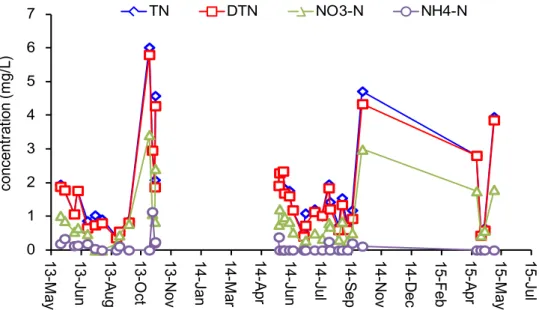
Figure 4.1. Concentrations of nitrogen in irrigation water during the field experiment ... 35
Figure 4.2. Temporal variation of nitrogen forms in drainage water a) E1 continuous flow), b) W2 stagnant ... 37
Figure 4.3. Temporal variation of nitrogen forms in percolation water ... 40
Figure 5.1. Daily rainfall in a paddy field from May 2013 to May 2015 ... 45
Figure 5.2. N load in input and output flow in a paddy field of the two years ... 58
Figure 6.1. Relationship between δ15N and δ18O of NO3− in runoff waters ... 65
Figure 6.2. Temporal change in contribution rate of NO3 sources ... 66
Figure 6.3. Changes in variation in drainage and percolation water of the two years 2013
– 2014. a) NO3− concentration, b) δ15N−NO3−,c) δ15N−NO3− ... 68
Figure 6.4. Relation between δ15N of NO3 – in irrigation water and runoff waters during the cultivation period of two year 2013 – 2014 ... 70
Figure 6.5. δ15N – NO3- versus NO3- concentration in paddy runoff waters of the two years (a), paddling period (b), irrigation period (c), non-irrigation and fallow periods (d). ... 72
xi
LIST OF TABLES
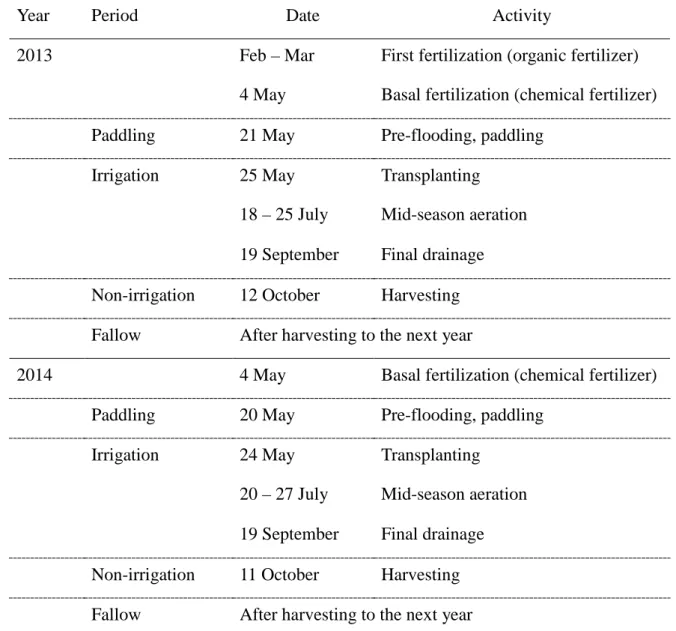
Table 3.1. Management practices in the studied paddy field ... 23
Table 4.1. Concentration percentage of N compositions in TN in irrigation water ... 36
Table 4.2. Concentration percentage of N compositions in TN in drainage water ... 38
Table 4.3. Concentration percentage of N compositions in TN in percolation water ... 41
Table 5.1. Water balance during the cultivation period in the experimental paddy field ... 46
Table 5.2. Nitrogen losses through drainage from a paddy filed ... 49
Table 5.3. Contribution of nitrogen compositions of total nitrogen load in drainage water .. 51
Table 5.4. Nitrogen loss through percolation from a paddy filed ... 53
Table 5.5. Contribution of N compositions to TN load in percolation water ... 54
Table 5.6. Nitrogen budget in a paddy field of the two year, 2013 – 2014 ... 56
1
CHAPTER 1 INTRODUCTION
3
1.1. Statement of purpose
Rice is one of the most widely consumed foods by humans, and paddy fields occupy large areas in Asia. For example, 70% of the agricultural land in Taihu Region, China (Guo et al. 2004), 40% of the agricultural land in Vietnam (General Satiates Office, 2011) and 60% of the farmland in Korea are paddy fields (Cho et al. 2003). In Japan, paddy fields account for 55% of the agricultural land (Ministry of Agriculture, Forestry and Fisheries, 2008). To gain a higher yield of rice, fertilizers and animal wastes are more applied to paddy fields, with the application of fertilizer being increased by 2.2% every year from 1961 to 2002 in Asia (Food and Agriculture Organization’s Fertilize). Some studies on paddy field have showed that the increasing use of nitrogen fertilizer rate is positively related to nitrogen (N) loss via runoff from paddy field (Tian et al. 2007; Qiao et al. 2012; Zhang et al. 2012). The nitrogen (N) input is excessive, significant amount of N becomes pollution load to surrounding environments through various pathways (e.g. runoff, denitrification, volatilisation), in which runoff is great contribution of total N loss to water environment (Takada et al. 1991; Cho et al. 2002; Guo et al. 2004; Zhao et al. 2012). The N losses from paddy outflow were not only dependent on the volume of runoff water (Zhao et al. 2012) but also nitrogen concentration (Tian et al. 2007). To reduce these losses of N from paddy field to the environment, it is crucial for understanding the original sources of N inputs as well as transformation and transport processes in paddy field.
A number of studies have give information about transformation and transport of N in paddy filed by using chemical analyses and N budget calculation. Tian et al. (2007) studied on N runoff load form paddy field indicated that NO3- loss (48 - 92%) is great contribution
of TN loss via drainage, while NH4+ and DON losses is high in percolation (Zhao et al.
2009, 2012). Studies on nitrogen constitutes in paddy runoff waters show that particulate nitrogen (PN) was predominant form of total nitrogen (TN) export from paddy field (Liang et al. 2004), but other author reported dissolved total nitrogen (DTN) is the main form of nitrogen rather than particulate nitrogen (PN), 88% of total nitrogen in drainage water (Tian et al. 2007). Among several types of N forms, some studies reported that NO3− is the main
form of nitrogen in the drainage water from paddy fields (Feng et al. 2004) or percolation water (Zhu et al. 2000, Tian et al. 2007), while dissolved organic nitrogen (DON) was main form of nitrogen in ponded water (Liang et al. 2007) or percolation water (Zhao et al. 2009).
4
However, most of them focused on N concentration and loss of N load from paddy runoff water, the identification of originating N sources and its temporal were not specifically discussed.
Nitrogen isotope ratio has been used to identify the origin N sources in river, groundwater or watersheds (Kendall. 1998; Ostrom et al. 1998; Mayer et al. 2002; Kellman et al. 2005). Stable isotope analyses is a powerful tool to trace the nitrogen fate in agricultural lands for soil under controlled laboratory condition (Choi et al. 2002; Choi and Ro et al. 2003), rice plant with different fertilizer application (Yun et al. 2011, Zhang et al. 2012) and nitrogen dynamic in paddy soil (Zhou et al. 2011; Lim et al. 2015). A dual isotope approach also has been used to identify nitrogen sources and transformation in watershed for agricultural area with different land use such as wheat, sugar beet, maize, barley, chickpeas, corn, carrot, soya, beet (Mayer et al. 2002; Deutsch et al. 2005; Kellman et al. 2005; Kelley et al. 2013) and river basin (Lee et al. 2008; Yue et al.2013), in groundwater under agricultural actives in vegetable field such as tomatoes, cucumbers, beans, squash, apples, pears, graph Kaown et al. 2009) and corn (Ostrom et al. 1998). Other studies focused on estimation and quantification of diffuse nitrate source in surface water from agricultural field (Deutsch et al. 2006; Xue et al. 2012; Ding et al. 2014) as well as identification of denitrification in groundwater (Fukade et al. 2003).
Recently, two studies focused on identifying NO3-–N source in paddy runoff water by using
NO3- isotope analysis. The NO3–−N source in surface water was identified by Ding et al.
(2014). However, problems were found with uncertain calculation results, i.e. “a wide range of individual source contributions” caused by seasonal factors and this uncertain was also reported by Xue at al. (2009). In addition, this study has been conducted on rice –wheat rotation. Jin et al. (2012) had no analysis of the seasonal factors affecting the contribution of NO3-–N sources in groundwater because of the single time sampling for each of the two
seasons (cultivation and fallow). In addition, the two studies focused on NO3-–N sources
in only one type of outflow water (groundwater or surface water) in short- term, however, both surface and groundwater environments are highly probably polluted from paddy fields. Moreover, nitrogen transport processes and quantitative N load in paddy runoff were not investigated under paddy practices. Based on these, in this study, the combination of analysis of concentrations, N budget and N stable ratio were continuously monitored under
5
paddy practices for two years including cultivation (cropping) and fallow periods (non-cropping) was applied to identify the sources of N and their transformation processes in runoff waters (drainage and percolation) and the pathways of N losses to environment (i.e. water runoff, air emission, rice plant uptake) in a paddy field in Japan.
1.2. Research objectives
The main objective of this study is analysis of nitrogen runoff processes from paddy field to water bodies using isotopic approach: a case study in a paddy field in Japan.
This research has three specific objectives as follows:
1. To analyses of temporal variation of N forms in runoff flows
2. To estimate of N losses and the contribution of N compositions from a paddy field to environment
3. To identify N sources and runoff processes in a paddy field using isotopic approach.
1.3. Dissertation structure
This dissertation consists of 7 chapters: 1. Chapter 1: Introduction
This chapter introduces general N pollution and N loss in water system as well as nitrogen sources. The originality of this study and dissertation structure is also explained here.
2. Chapter 2: Literature review
This chapter summary the nitrogen compositions, nitrogen budget in paddy field, and previous study results to identify nitrogen sources by using a dual isotope were present here. In this research, the combined analysis of N concentration, N budget and N isotopic ratio in nitrate have been used to trace N sources and transformation and transport processes in a paddy field.
3. Chapter 3: Methodology
This chapter describes the research framework. The combined analysis of N concentration, N budget and N stable ratio have been used to trace N sources and transformation and transport of N processes in a paddy field.
6
This chapter presents temporal variation of N concentrations in drainage and percolation waters and the main form of nitrogen during the paddling, irrigation, non-irrigation and fallow periods is presented here.
5. Chapter 5: Balance analyses for water and nitrogen
This chapter shows N pathways losses and contribution of N compositions from a paddy field to environment. The N transport processes i.e. drainage, percolation and plant uptake as well as denitrification are estimated based on nitrogen budget. 6. Chapter 6: Identification of nitrogen sources, transports and transformation processes
The purpose of this chapter is the identification of N sources, transports and transformation processes in a paddy field. The combination of N budget and N stable ratio was applied to improve information regarding transformation and transport of N in paddy field.
7. Chapter 7: Summary of the research
This chapter summarizes the results, conclusions and recommendation for further research
7
1. High contribution of N load from non-point sources (paddy field) to water environment.
2. To reduce N sources pollution from paddy field to water environment, nitrogen transport and transformation processes are needed.
3. Isotope approach have been used to trace N sources in paddy filed Chapter 1. Introduction
1. Determination of nitrogen compositions and N load by using physicochemical analyses or modeling.
2. Identification of N sources by isotope tracer
The combined analysis of N concentration, N budget and N isotopic ratio in nitrate have been used to trace N sources and transformation and transport of N processes in a paddy field.
Chapter 3. Methodology Chapter 2. Literature review
Chapter 6. Identification of N sources, transports and transformation processes (Objective 3)
N sources and N- transformation and transportation processes are to be rechecked by new method.
N sources runoff process
Chapter 7. Research summary and further work
Nitrogen transport (Objective 2): Chapter 5. Analysis of water and nitrogen budget
− Quantified N losses
− N transportation processes in paddy field
Nitrogen transformation (Objective 1): Chapter 4. Temporal variation of nitrogen concentrations and compositions
− Nitrogen concentrations − The main form of nitrogen
9
CHAPTER 2
11
2.1. Overview of N processes in paddy filed
Nitrogen (N) transport from paddy field to environment is very complicated due to the complex set of N-transformation processes in paddy field: nitrification, denitrification, volatilisation, mineralisation/immobilisation, uptake by rice plants. A simplified nitrogen cycle in paddy field is shown in Fig 2.1 and each stage of the nitrogen cycle is described below.
Figure 2.1. A simplified nitrogen cycle in paddy field. Red, blue and black arrow colors are
representative N input to paddy filed, the pathways of N losses to environment and N cycling, respectively. Adapted from Hofman & Cleemput (2004) and Duetsch PhD thesis (2005).
2.1.1. N-transformation processes
Mineralisation/immobilisation
Mineralisation and immobilisation are N-transformation processes which occur simultaneously in flooded soils. Mineralisation process is the conversion of organic N to ammonium. Immobilisation is inorganic N compounds assimilation by soil organisms and transformation of them into organic N constituents of their cells, tissues and soil mass (Chowdary et al. 2004). Soil NO3 -NH4+ NO2 -NH3 N2O + (NO) + N2 Uptake by rice plant Fertilizer NH3volatisation D en itr if ic atio n Nitrification NO2 -N2 Soil organic nitrogen Groundwater or drainage L each in g NO3 -Atmosphere Manure
12
Nitrification
Nitrification is process that microorganisms oxidize available ammonium (NH4+) to
nitriate (NO3-) in order to get energy (Figure 2.1). Firstly, the microorganism Nitrosomonas
oxidizes NH4+ to NO2- (nitrite), and then the microorganism Nitrobacter oxidizes NO2- to
NO3-. Nitrification process is took place according to the following reaction:
2 NH4+ + 3 O2 → 2 NO2- + 4 H+ + 2 H2O
2 NO2- + O2 → 2 NO3 -Denitrification
Denitrification is process that nitrate is reduced to N2 and nitrous oxide (N2O) gas and lost
to the atmospheric. The process is carried out by microorganisms under low oxygen condition. It occurs in soil, sediment, sea, river and groundwater. The main pathway of N2O emission from rice paddy soil depends on the soil water status. Yan et al. (2003)
reported when the soil was flooded, N2O was emitted predominantly through the rice plant,
whereas in the absence of flood water N2O emitted mainly via the soil surface. Some
studied shown that N2O emission makes up only a small of total N applied, accounting for
0.4 – 1.4% (Xing et al. 2002) or 0.12% of total N applied (Zhao et al. 2009). Other reported N2O emitted about 22% of from rice-based cropping systems in China (Xing et al. 1998).
The reason possibly is different water management or crop rotation.
Volatilization losses
Volatilization is process that organic nitrogen source and other inorganic fertilizers (urea) is converted to ammonia gas and lost to the atmospheric. Rate of loss ammonia volatilization is depended on temperate, humidity, win speed, soil pH, water content and other factor. For example, Li et al. (2008) reported that ammonia volatilization loss from rice fields with zero-drainage water management was 4.4 – 15.5% of the applied urea; other reported loss N via ammonia volatilization was 1.4 – 14.6 % of the applied urea from a paddy filed (Hayashi et al. 2006, 2008).
Uptake
This processes that plant uptake nitrogen available (predominantly nitrate, nitrite and ammonium) for the growth from soil.
13
2.1.2. N-transport processes
Considered pathways of N losses to water system include erosion, runoff, infiltration, percolation/leaching.
Nitrogen loss through drainage
Runoff is process that nitrogen in fertilizers, manure and soil are carried to surface water by overflow, flood flow and return flow from paddy fields. Quantity of N losses depends on rainfall events, amount of fertilizer application, water management in paddy fields and other factor. N losses through runoff from paddy field increased with the amount of applied N and the amount of water runoff (Tian et al. 2007; Zhao et al. 2012; Qiao et al. 2012; Cho et al. 2002, 2003). Thus, the volume of water runoff and amount of fertilizer application could be a key factor controlling N losses by runoff.
Nitrogen loss through percolation/leaching
N loss through leaching is mainly nitrate because it is very mobile, highly soluble and negatively charged. Loss of NO3- via leaching makes NO3- in soil paddy enter the
groundwater as well as rice plants cannot use NO3- for growth. NO3- loss depends on the
amount and intensity of rainfall, water practices and the concentration of NO3- in the soil
profile. N leaching caused an increase NO3- concentration in percolation water after
applying N fertilizers because of the hydrolysis and nitrification process after applied fertilizers (Zhu et al. 2000; Liang et al. 2008; Zhang et al. 2013). Loss of N via percolation from paddy field was 8.5% (Ha et al. 2001), 8.4 - 9.4% (Cho et al. 2002), 4.0 – 4.9% (Liang et al. 2007) and less than 1% of the applied fertilizer (Tian et al. 2007; Zhao et al. 2009), nitrogen contamination has increased in groundwater through percolation in long time period. Therefore, it is necessary to a minimum of N loss through to reduce N export to groundwater.
2.2. N loss from paddy field to water environment
Runoff (drainage or percolation) is one the pathways of N loss to surrounding environment. Many studies have been conducted field survey to estimate N load from paddy fields to water environment and predominant N compositions and its temporal trends in paddy runoff water. For instance, some studies indicated that N loss from paddy field by drainage accounted for 57 – 66 % of applied N fertilizer (Cho et al. 2003). Several studies showed
14
that contribution of N load vary in range of 2 – 5% (Tian et al. 2007), 5 – 21% (Qiao et al. 2012) or 10% of applied fertilizers to catchment (Tang et al. 2008). On the contrary, other researcher reported contribution of N load to surface water was negligible (Ha et al. 2001; Zhao et al. 2009). The difference of N loss via drainage was probably because of changed in spatially/ temporally and other factor such as precipitation intensity, fertilization application time, water management. Research measurements of N loss to groundwater by percolation has been conducted by some authors (Tian et al. 2007; Zhu et al. 2000; Zhao et al. 2009) and indicated that N loss was from 0.95 to 1.8% of total N applied. Although N loss by percolation was much less than that by drainage, both drainage and percolation are pathways of N losses from paddy field to water environment by directly or indirectly pathways and impact on water system. In addition, these studies revealed that N form and the contribution of N form in drainage and percolation was different, depending on paddy soil properties and type of fertilizer. For example, NO3− was main form of N in drainage
(Feng et al. 2004) or percolation water (Zhu et al. 2000; Tian et al. 2007), while NH4+ was
main form of N in drainage water (Guo et al. 2004) and DON was main form of N in ponded water (Liang et al. 2007) or percolation water (Zhao et al. 2009). Tian et al. (2007) also reported that loss of NO3− through drainage amounted to 48 − 92% of the TN losses,
whereas NH4+ loss was predominant in percolation water (Zhao et al. 2012) or DON in
percolation water (Zhao et al. 2009).
Estimation of N loading budget can give information regarding the effect of contaminated N load from paddy field on water system. Some studies have carried out loss of N from paddy field by using net outflow load of N and indicated that N discharged from paddy field to surface water was negligible (Feng et al. 2004; Takeda et al. 1997, 2006; Hama et al. 2011) or nitrogen discharge from water affected on water surface (Sugimoto et al. 2008). A number of studies have been conducted to estimate N loading budget in paddy field and reported that runoff from paddy field is a great contribution of N load to water bodies, 57 – 65.7% of applied fertilizer (Cho et al. 2002). Several studies show that contribution of N loading from paddy field varied in range of 2 – 5% (Tian et al. 2007 and Zhao et al. 2012), 2 – 21% (Qiao et al. 2012) of applied fertilizers depend on spatial or temporal variation.
Other method has been used to estimate the N of losses. Modeling calculation have been developed to describe N transformation or transport processes in paddy field based on
15
applied fertilizers. For example, Liang et al. (2007) has developed field models to estimate the loss of N load to runoff water and N-transformation processes in a near trench field based on amount of N fertilizer application. A Generalized Regression Neural Network (GRNN) and “Groundwater Loading Effects of Agricultural Management Systems in Paddy fields” (GLEAMS-PADDY) models were applied to assess N transport from paddy field to the environment, but N-transformation processes in paddy fields were not considered (Chung et al. 2003; Kim et al. 2007). The coupled water and N-balance model has been used to quantify N loss to groundwater by percolation and described N-transformation processes (urea hydrolysis, volatilization, denitrification, nitrification, mineralization, immobilization) in flooded rice fields, however, a great of N loss through drainage from paddy filed was not presented by applying this model (Chowdary et al. 2004).
Thus, in order to reduce the N load from paddy runoff to water environment, it is necessary to understand N sources and processes in paddy. The combined analyses of concentration and N budget can propose transformation and transport of N processes as well temporal trends in paddy runoff water. However, it cannot provide the information of the origin and transformation of N in drainage and percolation waters. N stable ratio is a useful tool to identify the source of N and transformation in both surface and groundwater. In our study, the combination of N budget and stable isotope was applied to identify the source of N and their transformation processes to environment (described in section 2.4).
2.3. Applying stable isotope to identity the N sources in groundwater and surface water
2.3.1. Nitrogen isotope ratio and kinetic isotope fractionation
Isotope method has been applied to investigate hydrological processes in groundwater and identify the sources and pathways in groundwater contamination. Isotopes can divide into two groups: stable isotope and non-stable isotope (radioactive). Many researchers have applied stable isotopes of nitrogen to identify the sources of N and its transformation processes in surface water or groundwater (Kendall. 1998; Mayer et al. 2002; Xue et al. 2009; Fenech et al. 2012). Nitrogen has two stable isotopes 14N and 15N, the majority of N
in the atmospheric is light isotope 14N (99.6337%) and remainder is heavy isotope 15N (0.3663%) (Junk and Svec.1958). Because variation in ratios may be small, the differences in ratios are usually expressed in delta (δ) units and a per mil (‰) notation as following
16 equation
δsample(‰)=
(
Rsample−Rstandard)
/Rstandard×1000where R (15N/14N) is the ratio of the heavy to the light isotope. Negative δ values indicate enrichment in the heavy isotope and positive δ values indicate depletion in the heavy isotope.
N isotope ratios in nitrate have been used to identify NO3- sources in water because the
isotope composition of N in NO3- is different among various NO3- sources such as
chemical fertilizer, soil, atmospheric N2, and manure. Isotope fractionation occurs as a
result of the discriminating isotopic composition, which results in depleted instantaneous products, and the remaining substrate becomes gradually more enriched with the heavy isotope. It occurs because atomic masses and bond strengths are isotope dependent (Cravotta 1997). Kinetic fraction factors depend on reaction rates, concentration of products and reactants, environment conditions, and specifies of the organism (Kendall.1998). Generally, the lighter isotope will tend to reach more quickly.
A kinetic fractionation factor is reported as:
/ p s Rp Rs
α − =
where Rp and Rs represent the ratio of the heavy isotope to the light isotope in the product
and in the substrate, respectively.
An isotope enrichment fractionation is reported as:
( 1) 1000
p s
ε − = α− ×
The Rayleigh equation describes the change of the isotope composition of the residual reactant (substrate) during both kinetic and equilibrium processes, as given below:
ln( )
o p s f
δ δ= +ε −
where δo andƒ are the initial composition of the substrate and the remaining fraction of the
subtract, respectively, εp-s is enrichment factor.
2.3.2. Identification of nitrogen sources
Many researchers have been applied N isotope analyses to give information on the dynamic of N in soil – plant (Högberg. 1997; Choi et al. 2002; Yoneyama et al. 2012; Chalk et al. 2013), nitrogen transformation processes in soil under controlled conditions (Choi et al. 2002; Choi and Ro. 2003) or rice plant (Yun et al. 2011; Lim et al. 2015). Most of them,
17
however, focused on nitrogen transformation and its sources in soil – plant, and N sources and their transformation in paddy runoff water was not presented.
Stable N isotope ratios in nitrate have been widely used to identify the N sources in ground water and surface water (Mayer et al. 2002) because of different N isotope composition in NO3- among various NO3- sources (i.e. chemical fertilizers, manure or soil). However,
numerous of NO3- sources cannot be discriminated due to overlapping δ15N-NO3- values
and kinetic isotope fractionation (Kendall. 1998). Ostrom et al. (1998) and Kellman et al. (2005) suggesting combination of δ15N and δ18O can provide more conclusive information
of NO3- sources in water bodies. The dual isotope approach can apply to trace NO3- sources
in water bodies (Kendall. 1998) because of:
1. Oxygen isotopic separation of some sources is greater than for nitrogen isotopes with the spread of δ18O being at around 80‰, while that for δ15N being at 35‰, thus,
allowing better source resolution by having two tracers.
2. Some nitrate sources that are presently indistinguishable with δ15N alone (e.g. fertilizer
vs soil nitrate, or atmospheric vs. soil nitrate) may be identified once δ18O values are
incorporated.
3. Oxygen isotopic compositions of nitrate vary systematically with nitrogen isotopic compositions during denitrification. Thus, in systems where the dominant sources of nitrate are isotopically distinctive, source contributions can (in theory) be determined despite significant denitrification.
Besides, N isotope ratios in NH4+ and NO3- have been used extensively to trace N sources
and its processes in ground water and surface water (Li et al.2007; Yue et al. 2013). However, availability of isotope analyses in NH4+ is still limited at the present technology;
developing δ15N-NH
4+ analyses in paddy runoff water may be tested in our study to well
understand N transformation.
Based on determination of NO3- concentrationand isotope composition of NO3-, a number
of studies have successfully applied dual isotope approach (δ15N and δ15O in NO 3-) to
provide meaningful insight the sources and transformation processes of NO3- in small
18
2013) and river basis (Mayer et al. 2002; Deutsch et al. 2006; Lee et al. 2008; Yue et al. 2013) and ground water (Choi et al. 2007; Li et al. 2007; Kawon et al. 2009; Hosono et al. 2013). Most of study, nevertheless, focused on the NO3- transformation in surface or
ground waters, investigation of nitrogen transformation in paddy field was not observed.
To date, only two studies concentrated on NO3-–N source in paddy runoff water by using
NO3- isotope analysis. Ding et al. (2014) tried to identify NO3-–N source and the
contribution of each NO3- sources to a stream, however, “seasonal” is a factor that affects
calculated results of the individual sources contribution. Other study, Jin et al. (2012) also has applied stable isotope to identify the source in groundwater of an agricultural area in China but did not discuss on the seasonal factors in detail because of the limitation of sampling design (two- time sampling). Moreover, both of them focused on NO3- sources in
groundwater or surface water and short-term observation, observation of N sources under paddy practices by long-term frequent monitoring was not present. In addition, N load were not estimated with identification of N and transport/transformation processes. It is necessary to investigate temporal variation and sources of nitrogen in both drainage and groundwater in long-term in order to reduce effect of the seasonal factors and improve information on N sources and transformation from paddy to water bodies.
2.4. Conclusion
For the reasons mentioned above, to propose countermeasures for better agricultural management and improvement of analytical method to reduce N load from paddy to water environment, the combined analysis of concentration, N budget and N stable ratio was applied to identify the sources of N and their transport/transformation processes in runoff waters (drainage and percolation) and the pathways of N losses to environment (i.e. water runoff, air emission, rice plant uptake) by conduction field observation under paddy management in Japan for the two years.
19
CHAPTER 3
21
3.1. Research framework
The research framework was developed based on the combined analysis of nitrogen (N) concentration and N isotopic ratios, N budget to provide more detailed information of the origin N sources and N-transformation and transport processes in a paddy field in long-term observation. Fig 3.1 was represented three steps in proposed framework to give more detailed information of N runoff processes in paddy field in order to reduce the N loss from paddy field to water system.
Figure 3.1. Research framework to combine chemical analysis, N budget calculation and
isotopic approach
Step1. Temporal variation of nitrogen concentrations
Firstly, water samples were taken from paddy runoff waters (drainage and percolation) were analysed to determine N concentrations (i.e. ammonium (NH4+), nitrate (NO3-),
nitrite (NO2-), dissolved organic nitrogen (DON) and particulate nitrogen (PN) in order to
provide information on temporal variations of N concentrations and main form of N in drainage and percolation waters for the two years 2013 – 2014 consecutive monitoring
N runoff processes in paddy field
N concentrations N transport N sources and processes
Drainage N form in runoff waters Obj1. Temporal variation of N concentrations Percolation Quantitative N losses Obj2. Water and N budget analysis Obj3. Identification of N sources and transport, transformation processes Impact on water environment
22
during the cultivation and fallow periods. However, determination of concentration only gives information regarding temporal trends of N concentrations in paddy runoff waters. The detailed N-transformation would be identifying in step 3 by the combination of NO3- concentration and N isotopic ratios in nitrate/ammonium.
Step2. Nitrogen transport processes
This step was described the pathways of N losses (i.e. runoff, air emission, uptake by rice plant) in paddy field to examine N transport processes in paddy field and assess N load contribution to environment. Analysis of water and N budget can give the contribution of N losses to surrounding environments. N budget balance was estimated by total load N input and N output (detailed in section 3.6).
Step 3. N sources and runoff processes
Finally, identification of N sources and transport/transformation processes in runoff waters were analysed by combing NO3- concentration and N isotope ratios in NO3-.
3.2. Study area
Figure 3.2. Location and schematic of the experimental field in Kai City, Yamanashi
Prefecture, Japan
E1 W2 Irrigation canal Continuous StagnantWater sampling point Inflow water Outflow water
Soil and plant sampling point Soil Pond water 70-90 cm 5-10 cm
Runoff water from surface layer: drainage Runoff water from subsurface layer: percolation
23
The study area is a paddy field, shown in Fig 3.2, in the north of Kofu in Yamanashi Prefecture, Japan. The experimental area is 0.2 ha divided into two small sections named E1 (0.1 ha) and W2 (0.1 ha).The water flow in the E1 section is continuous and is stagnant in W2 section. In continuous flow, irrigation inlet and drainage outlet are always open except mid-season aeration period while in stagnant, irrigation inlet and drainage outlet are controlled by a famer. Irrigation water from Kugawa River is distributed to each paddy section via inlet gate systems. Irrigation gate open for paddy activities during irrigation period from May 20 to September 19 in 2013 and 2014. During non-irrigation period, irrigation water can distribute to a paddy field only when the typhoon storm occurred.
Table 3.1. Management practices in the studied paddy field
Year Period Date Activity
2013 Feb – Mar First fertilization (organic fertilizer)
4 May Basal fertilization (chemical fertilizer)
Paddling 21 May Pre-flooding, paddling
Irrigation 25 May Transplanting
18 – 25 July Mid-season aeration 19 September Final drainage Non-irrigation 12 October Harvesting Fallow After harvesting to the next year
2014 4 May Basal fertilization (chemical fertilizer)
Paddling 20 May Pre-flooding, paddling
Irrigation 24 May Transplanting
20 – 27 July Mid-season aeration 19 September Final drainage Non-irrigation 11 October Harvesting Fallow After harvesting to the next year
24
Organic fertilizers were applied to a paddy field from February to March 2013, the amount of organic fertilizers was 18 kgN/ha. Amount of chemical fertilizers (N:P:K = 8:8:8) was 48 kgN/ha in May, and only chemical fertilizers (N:P:K = 8:8:8) were used in 2014 (72 kgN/ha). The cultivation period was from May to October and the fallow period from after harvesting to the next year. Young rice plants were transplanted on 25 May 2013 and 24 May 2014 after irrigating and soil paddling. Paddling was conducted to mix water and soil on 21May 2013 and 20 May 2014. Irrigation period started on 22 May 2013 and ended on 19 September 2013, non-irrigation period was from 20 September 2013 to the next year. In 2014, irrigation period started on 21 May and ended on 19 September, non-irrigation period was from 20 September to the next year. The dates for the application of fertilizers and management practices in a paddy field in Kai city in Yamanashi are listed in Table 3.1.
3.3. Sampling
3.3.1. Water sampling
Drainage and percolation waters samples were collected manually at the outlet of drainage and the percolation (70 – 90 cm depth) pipelines from May 2013 to May 2015 at weekly to bi–weekly intervals, but more frequently immediately after every rainfall event or typhoon occurred. The drainage samples were collected from surface layer and percolation samples were collected from subsurface layer through a pipeline at 70 – 90 cm depth. PCV–perforated pipes with a 10 cm inside diameter were installed horizontally at 70 – 90 cm depth to collect percolation water. Four pipes were installed in E1 paddy field and one pipe was installed in W2 paddy field. The sampling sites were shown in Fig 3.3. Irrigation water samples were collected at the inlet gate that distributed water to a paddy field. Samples were stored in stored in 250-mL-polyethylene bottles and stored at 4oC. Rainwater was collected monthly from May 2013 to Nov 2013 at University of Yamanashi 5 km northern of the study area.
3.3.2. Soil and plant
Soil samples were collected from each paddy section before and after the application of fertilizers and at harvest. The soil samples from four sampling point of each section were collected from a 5-cm-deep layer shown in Fig 3.2, and then stored in plastic bags. The soil samples were dried at 60οC in an oven overnight, homogenized and passed through a
25
2-mm sieve. Plant tissue samples (stem, leaves and grain) were collected from each paddy section at the time of harvesting. Plant tissue samples were oven-dried at 60oC in an oven
overnight and were ground to fine power. Chemical and organic fertilizer samples were taken from a farmer’s house stored in plastic bags and treated similarly as the soil samples.
Figure 3.3. Sampling site of drainage and percolation; a) E1drainage, b) E1percolation,
c) W2 drainage, d) W2 percolation
3.4. Analysis method
3.4.1. Analysis of temperature, pH, EC and nitrogen concentrations in water
Temperature, pH and electrical conductivity were measured on site using EC/pH meter. The EC/pH meter (WM – 32EP) should be calibrated in the laboratory before field measurement. The pH electrode was calibrated using buffer solution pH 4.01 and 6.86. The EC electrode was calibrated using 1413µS/cm standard solution. The irrigation, drainage and percolation waters were filtered through 0.47µm using a glass microfiber filter (Whatman, GF/F 47 mm) for analyzing dissolved total nitrogen (DTN) in the
a) b)
26
laboratory on the sampling day. Samples for the stable isotope and inorganic constituents (NO3-, NH4+, and NO2-) analysis were filtered through 0.2µm membrane filters
(Millipore) in the laboratory on the sampling day. The filtrated samples were frozen at –20oC for further analysis.
Nitrate, nitrite and ammonium concentrations were analysed by ion chromatography (DIONEX ICS – 1100, USA). Total nitrogen (TN) and the dissolved total nitrogen (DTN) were analysed using the alkaline potassium peroxodisulfate digestion (120oC, 1.5 atm, 30 min) – UV absorbance (260 nm) method. The dissolved organic nitrogen was calculated by subtracting the NO2-−N, NH4+−N and NO3-−N from DTN. PN was calculated by
subtracting the DTN from TN. The concentration of each sample was measured in duplicate, and the mean values were reported.
3.4.2. Analysis of nitrogen and oxygen isotopes in nitrate
The δ15N and δ18Ovalues of nitrate samples were analysed at Environment Isotope Laboratory of University of Yamanashi using the “Bacterial denitrification method” (Sigman et al. 2001; Casciotti et al. 2002). This method allow for simultaneous determination of δ15N and δ18O of N
2O produced from the conversion of NO3− by
denitrifying bacteria which naturally lack N2O-reducase activity. Firstly bacterial cultures
were grown for 6 – 10 days, and then cells were harvested and concentrated by centrifugation, and then split into 2 mL aliquots in 20 mL headspace vials. The vials were crimp – sealed with Teflon – backed silicone and purged for 4 hours with high purity N2
to ensure anaerobic conditions. Samples of dissolved NO3- (30 nmol) were then injected
into headspace vials and were incubated overnight in 25oC to allow for the complete
conversion of NO3- to N2O. The next day, 0.2 mL of NaOH 10% was injected into the
headspace vials to stop bacterial activity and to remove all CO2 gas that can interfere with
N2O measurement. The δ15N and δ18O values of nitrate were analysed the produced N2O
using an isotope ratio mass spectrometer (Hydra 20-20, Sercon, UK). The analytical precision is ± 0.2‰for δ15N and ± 0.3‰ for δ18O. The δ15N and δ18O in nitrate of each
sample was measured in duplicate, and the mean values were reported.
The isotopic signature of nitrogen is expressed in delta (δ) units using the per mil (‰) notation
27 δ𝑠𝑠𝑠𝑠𝑠𝑠𝑠𝑠𝑠𝑠𝑠𝑠�‰� = � 𝑅𝑅𝑠𝑠𝑠𝑠𝑠𝑠𝑠𝑠𝑠𝑠𝑠𝑠
𝑅𝑅𝑠𝑠𝑠𝑠𝑠𝑠𝑠𝑠𝑠𝑠𝑠𝑠𝑠𝑠𝑠𝑠− 1� × 1000 (Eq 3.1)
where,Rsample and Rstandard are 15N/14N or 18O/16O ratios of the sample and standard,
respectively. δ15N standard is atmospheric N2 and δ18O standard is VSMOW (Vienna
Standard Mean Ocean Water).
In the bacteria denitrification method, three international references, USGS32 (180.0 ± 1.0‰ for δ15N, 25.7 ± 0.4‰ for δ18O), USGS34 (-1.8 ± 0.2‰ for δ15N, -27.9 ± 0.4‰
for δ18O), USGS35 (2.7 ± 0.2‰ for δ15N, 57.5 ± 0.3‰ for δ18O) were used to corrected
the raw δ15N and δ18O in NO
3- values base on blank correction method and correction
factor method (Casiotti et al. 2002, Xue et al. 2010).
3.4.3. Analysis of δ 15Nand percentage of N in the soil and plant and fertilizer
The δ15N and percentage of nitrogen in samples (soil, grain, straw, chemical and organic
fertilizers) were analysed via a combustion method using the mass spectrometer. Fifteen milligram of soil, 20 mg of plant and 1 mg of fertilizer were placed in silver micro-cups and were carried out using the elemental analyzer mass spectrometer (ANCA-GSL, Sercon, UK). The nitrogen isotope compositions were
𝛿𝛿15𝑁𝑁�‰� = � 𝑅𝑅𝑠𝑠𝑠𝑠𝑠𝑠𝑠𝑠𝑠𝑠𝑠𝑠
𝑅𝑅𝑠𝑠𝑠𝑠𝑠𝑠𝑠𝑠𝑠𝑠𝑠𝑠𝑠𝑠𝑠𝑠− 1� × 1000 (Eq 3.2)
where, Rsample and Rstandard are 15N/14N for sample and standard (atmospheric N2),
respectively. The δ15N of each sample was measured in duplicate, and the mean values were reported.
The percentage of N in the solid sample (plant parts, soil or fertilizer) was calculated as the following equation:
(%) (%) w 100 s N N w = × (Eq 3.3)
where, N is percentage of N in sample (%)
Nw is N weigh that measured by EA – MS (ANCA – GSL)
ws: sample weight (gram)
3.5. Hydrological measurement
28
manually by bucketing at the time sampling. In this study, infiltration in shallow layer was not directly measured in the two years 2013 – 2014, so it was assumed to be average of percolation rate during the fallow period in 2014, infiltration rate was assumed to be 3.14 mm/day for E1 section and 2.35 mm/day for W2 section for all periods. Comparted to other study in paddy field, the rate of infiltration was 0.5 mm/day by Sugimoto et al. (2008), 2 mm/day by Zhao et al (2012) and 3 mm/day by Cho et al (2002). Thus, the rate of infiltration can be acceptable by using our assumption.
The amount of precipitation was obtained from the rainfall recorded at Kofu Station, Japan Meteorological Agency (http://www.data.jma.go.jp/gmd/risk/obsdl/index.php) in 2013. Kofu Station is about 6 km southwest of this study field. From May 2014, the amount of precipitation was recorded by rain gauge with self-register at W2 section. The total rainfall was 383 mm and 462 mm during the irrigation period in 2013 and 2014, respectively. During the non-irrigation, the total rainfall was 664 mm and 694 mm in 2013 and 2014, respectively.
The water of evapotranspiration (ET) during the irrigation period in this area was calculated by Penman Monteith with crop coefficient method as flowing.
c c o
ET =K ×ET (Eq 3.4)
o p pan
ET =K ×E (Eq 3.5)
where, ETc, Kc, ETo, Kp and Kpan are the crop evapotranspiration, crop coefficient,
reference crop evapotranspiration, pan coefficient and pan evaporation, respectively. The average evapotranspiration was approximately 4.4 mm/day and 3.4 mm/day in 2013, 3.7 mm/day and 2.9 mm/day in 2014 during the irrigation and non-irrigation periods, respectively.
Irrigation water was distributed to the each section via ditch system during the cultivation period for paddy activities, the volumes of irrigation water was estimated by water budget as the following equation:
+ = + + + + ∆
I R D P Inf ET
Q Q Q Q Q Q S (Eq 3.6)
29 QR: water volume of rainfall (m3) at time ti
QD: water volume of drain (m3) at time ti
QP: water volume of percolation (m3) at time ti
QInf: water volume of infiltration (m3) at time ti
QET: water volume of evapotranspiration (m3) at time ti
∆S: the change of flooding water and groundwater
The amount of infiltration water was estimated by multiply the rate of infiltration water by time t (day) as the following equation:
Inf = Inf × i
Q r t (Eq 3.7)
In our study, water flows of drainage and percolation outlet was measured by manually at weekly/biweekly intervals during the irrigation period but more frequently immediately after heavy rainfall or when the drain occurred for mid-season aeration period. Thus, flow rates during the non-measured were calculated by the average of the previous measurement i-1 to the next measurement i+1 using representative method, as well as N concentrations.
(
1 1)
/ 2 n i i Q = Q+ +Q− (Eq 3.8)(
1 1)
/ 2 n i i C = C+ +C− (Eq 3.9)where, Ci and Qi were concentration (mg/L) and flow rate (m3/s) at time ti that obtained
by observations.
Cn and Qn: were concentration (mg/L) and flow rate (m3/s) during the
non-measured
n: drainage, percolation water
3.6. Nitrogen budget
Nitrogen budget in the paddy field would be estimated based on total amount of nitrogen input (Nin) and output (Nout), shown in Fig 3.4. Total nitrogen input includes fertilizer
applied on a paddy field, precipitation, irrigation water. Total nitrogen output includes nitrogen loss by emission, drainage, percolation, infiltration, plant uptake.
Nitrogen budget calculation can be described as following equation:
= + ∆
in out
30 = + + + in C O R I L L L L L (Eq 3.11) = + + + + + out D P Inf Gr St em L L L L L L L (Eq 3.12)
where, LO is organic fertilizer applied in paddy field (kgN/ha)
LC is chemical fertilizer applied in paddy field (kgN/ha)
LI is nitrogen in irrigation water (kgN/ha)
LD is nitrogen loss by drainage (kgN/ha)
LP is nitrogen loss by percolation (kgN/ha)
LR is nitrogen in precipitation (kgN/ha)
LInf is nitrogen loss by infiltration (kgN/ha)
LGr is nitrogen uptake by grain (kgN/ha)
LSt is nitrogen uptake by straw (kgN/ha)
Lem is nitrogen loss by emission (kgN/ha)
∆LS: deficient or storage N in soil
Figure 3.4. A simplified illustration of nitrogen budget calculation in a paddy field; open
and close arrows indicated N input and output, respectively.
For the two years experiment fields, the input of chemical and organic fertilizers in a paddy field was 73 kg N/ha. Nitrogen load via irrigation, percolation, drainage, infiltration, rainfall were calculated based on the observation in 2013 and 2014, as following the equation.
j j j
L
=
C
×
Q
(Eq 3.13) Emission (est) Denitrification Volatilization ET(cal) evapotranspiration Drainage (D) (obs) Fertilizer (obs) Irrigation (I) (cal) Percolation (P) (obs) Rainfall (R) (obs)Rice uptake (R_up) (obs)
Infiltration (Inf) (est)
31 where, L: N load in inflow or outflow (kgN/ha)
C: nitrogen concentration (mg/L) Q: water flow (m3)
j: irrigation, rainfall, drainage, percolation, infiltration
Nitrogen uptake by plant was calculated based on the rice yield and the percentage of nitrogen in rice and straw. The rice yield in E1 section was 595 kg in 2013 and 2014. The rice yield in W2 section in 2013 and 2014 was 630 kg and 700 kg, respectively. Nitrogen uptake by plant can be described as following equation:
( )
%(
/)
k k
L =N ×Yield kg ha (Eq 3.14)
where, L: uptake by plant tissue (kgN/ha) N: nitrogen content in plant tissue (%) k: grain or straw
In our study, nitrogen loss by denitrification was estimated from data of Eguchi (2012), who estimated N loss via denitrification in paddy field base on NO3-–N concentration,
shown in Fig 3.5.
33
CHAPTER 4
4. TEMPORAL VARIATION OF NITROGEN CONCENTRATION AND
35
4.1. Introduction
In this chapter, total nitrogen (TN) and dissolved total nitrogen (DTN), as well as characteristic of nitrogen compositions: ammonium (NH4+), nitrate (NO3-), nitrite (NO2-),
dissolved organic nitrogen (DON) and particular nitrogen (PN) in drainage and percolation waters were analysed and shows temporal variations and main form of nitrogen in paddy runoff waters during cultivation and fallow periods of the two year 2013 – 2014.
4.2. Nitrogen concentration in irriagation water
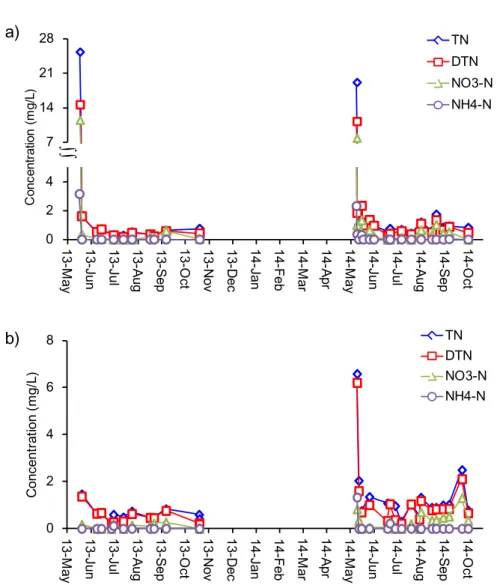
Figure 4.1 showed the nitrogen concentrations in irrigation water samples in a paddy field for the two years. The concentration of TN, DTN and NO3-–N concentration in irrigation
water ranged from 0.4 to 6.0 mg/L, from 0.4 to 5.8 mg/L and from below the detection limit to 3.4 mg/L, respectively. NH4+–N concentration ranged from below the detection limit to
0.4 mg/L and NO2-–N concentrations were below the detection limit. In general, N
concentrations in irrigation water samples were significantly high during a storm. During the irrigation period, the average of TN, NO3-–N and NH4+–N concentrations was 1.3 ± 0.5
mg/L, 0.6 ± 0.3 mg/L and 0.09 ± 0.1 mg/L, respectively. The results were similar to the results of Takada et al. (1997), who reported that TN concentration in irrigation water sources in Anba River, Japan that distributed to paddy filed watershed (74 ha) was 0.9 – 1.9 mg/L, but which was higher than 0.4 mg/L estimated by Sugimoto et al. (2008).
Figure 4.1. Concentrations of nitrogen in irrigation water during the field experiment 0 1 2 3 4 5 6 7 13 -M ay 13 -Jun 13-Au g 13 -O ct 13 -No v 14 -Jan 14-Mar 14-Ap r 14
-Jun 14-Jul 14-Se
p 14 -No v 14 -De c 15 -Fe b 15 -Ap r 15 -M ay 15 -Jul conc ent rat ion ( m g/ L) TN DTN NO3-N NH4-N
36
During the irrigation period, NO3-–N and DON were main form of nitrogen accounting for
45% and 37% of TN on average, respectively. During non-irrigation, NO3-–N accounted
for 59% of TN on average, whereas DON accounted for 26% of TN on average. The percentage of NH4+–N and PN were less than 10% of TN on average during the irrigation
and non-irrigation periods (Table 4.1).
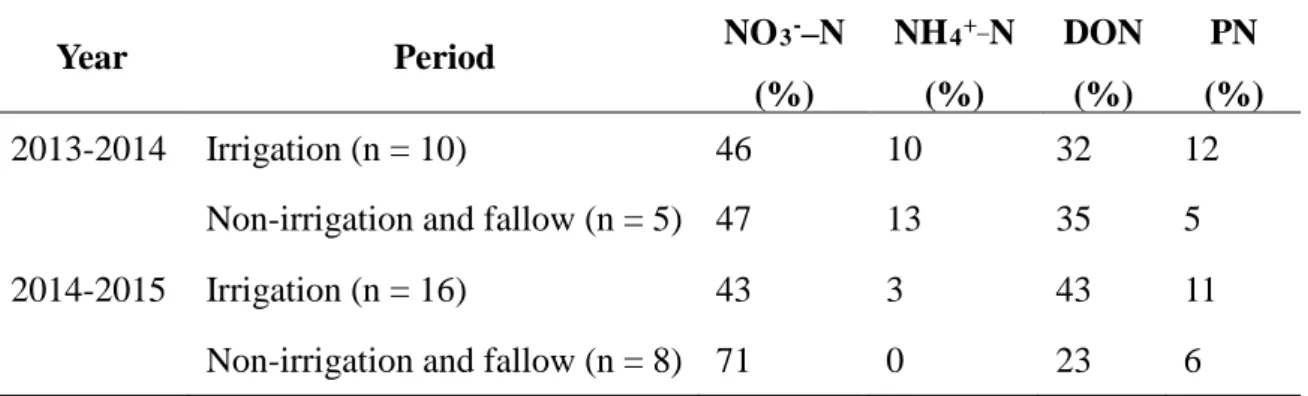
Table 4.1. Concentration percentage of N compositions in TN in irrigation water
Year Period NO3 -–N (%) NH4+_N (%) DON (%) PN (%) 2013-2014 Irrigation (n = 10) 46 10 32 12
Non-irrigation and fallow (n = 5) 47 13 35 5
2014-2015 Irrigation (n = 16) 43 3 43 11
Non-irrigation and fallow (n = 8) 71 0 23 6 n: number in parentheses indicated the number of samples.
4.3. Characteristic of nitrogen in drainage water
Drainage samples were taken from the E1 and W2 sections from May 2013 to May 2014. The temporal variation of nitrogen forms in drainage water of E1 and W2 sections during cultivation and fallow periods were shown in Fig 4.2 and the percentage of N forms were shown in Table 4.2. There was no drainage water in W2 section during the soil paddling day for two years. The concentration of TN, DTN and NO3−−N in drainage water ranged
from 0.3 to 25.4 mg/L, from 0.2 to 14.7 mg/L and from below the detection limit to 11.6 mg/L, respectively. The NH4+−N concentration ranged from below the detection limit to
3.2 mg/L and the concentrations of NO2-−N were below the detection limit. DON
concentration ranged from below the detection limit to 4.1 mg/L. High concentration of TN (25.4 mg/L), DTN (14.6 mg/L), NO3−−N (11.6 mg/L) and NH4+−N (3.2 mg/L) and was
observed in E1 drainage water in the soil paddling day. Three days after soil paddling, the concentration of TN, NO3−−N and NH4+−N decreased sharply to approximately 2.1 mg/L,
0.4 mg/L and the detection limit, respectively, and reached approximately 0.8 mg/L, 0.2 mg/L and negligible, respectively, at the rice elongation stage (Fig 4.2). In E1 section, DON concentration in drainage water ranged from 0 to 1.1 mg/L during the soil paddling and ranged from 0 to 1.3 mg/L during the cultivation period. In W2 section, DON concentration in drainage water ranged from 0 to 4.1 mg/L during the cultivation period.
37
Figure 4.2. Temporal variation of nitrogen forms in drainage water
a) E1 continuous flow), b) W2 stagnant
The concentrations of TN, DTN, NO3−−N and NH4+−N were the highest during the
paddling period because the solid chemical fertilizer readily dissolved in water when the soil was irrigated. NO3− and PN were main form of TN during this period, accounting for
44% and 42 % of TN on average meanwhile NH4+ accounted for 12% of TN on average
(Table 4.2). The PN in drainage water was highest level because soil was mixed with water during the paddling period. In this study, the TN concentration in drainage water during the paddling period was higher than the 5 mg/L TN value reported by Feng et al. (2004), presumably, because of the differences in the fertilizer amount and paddy water management. The TN concentrations were similar to other authors (Cho et al. 2003, Liang et al. 2007) that reported TN of 17−20 mg/L during the fertilizer application period.
0 2 4 13 -M ay 13
-Jun 13-Jul 13-Au
g 13 -Se p 13 -O ct 13 -No v 13 -De c 14 -Jan 14-Fe b 14 -M ar 14 -Ap r 14 -M ay 14
-Jun 14-Jul 14-Au
g 14 -Se p 14 -O ct 7 14 21 28 TN DTN NO3-N NH4-N ∫∫ 0 2 4 6 8 13 -M ay 13
-Jun 13-Jul 13-Au
g 13 -Se p 13 -O ct 13 -No v 13 -De c 14 -Jan 14-Fe b 14 -M ar 14 -Ap r 14 -M ay 14
-Jun 14-Jul 14-Au
g 14 -Se p 14 -O ct C onc ent rat ion ( m g/ L) TN DTN NO3-N NH4-N b) C onc ent rat ion (m g/ L) a)
38
Table 4.2. Concentration percentage of N compositions in TN in drainage water Year Paddy section Period NO3-–N (%) NH4+_N (%) DON (%) PN (%) 2013 E1 Year 23 1 63 13 Paddling a (n = 1) 44 12 2 42 Irrigation b (n = 15) 24 0 70 6 Non-irrigation c - - - - Fallow d (n = 1) 5 0 52 43 2014 E1 Year 32 3 45 20 Paddling a (n =4) 41 12 6 41 Irrigation b (n = 26) 33 2 47 18 Non-irrigation c - - - - Fallow d (n = 1) 0 0 57 43 2013 W2 Year 15 2 65 18 Paddling a - - - - Irrigation b (n = 17) 17 2 70 11 Non-irrigation c - - - - Fallow d (n = 3) 2 0 40 58 2014 W2 Year 24 2 54 20 Paddling a - - - - Irrigation b (n = 24) 22 2 55 21 Non-irrigation c (n = 6) 52 0 32 16 Fallow d (n = 1) 46 0 40 14
n: number in parentheses indicate the number of samples
a Paddling day (May 21, 2013 and May 20, 2014)
b Irrigation period (the day after paddling day to September 19) c Non-irrigation period (from September 20 to October 11) d Fallow period (from October 12 to the next year )
It found that one day after soil paddling, rainfall event (18 mm) occurred in 2014, the nitrogen concentration in the drainage water of the stagnant (W2) was observed significantly higher than that of the continuous flow (Fig 4.2). This result was consistent with high N concentration in drainage water when rainfall occurred immediately after fertilization that has been observed by other researches (Tian et al. 2007; Qiao et al. 2012).