Studies on dietary lipid source and
fatty acid metabolism in Siluriformes
ナマズ属魚類の飼料脂質源と脂肪酸代謝に関する研究
Roslianah ASDARI
Contents
Introduction ・・・・・・・・・・・・・・・・・・・・・・・・・・・・・・・ 143 Chapter 1: Effect of dietary vegetable oils to P. hypophthalmus and P. nasutus juveniles
1-1 Materials and methods ・・・・・・・・・・・・・・・・・・・・ 147 1-2 Results ・・・・・・・・・・・・・・・・・・・・・・・・・・・ 151 1-3 Discussion ・・・・・・・・・・・・・・・・・・・・・・・・・ 162 Chapter 2: Effect of dietary palm oil and MCT to Japanese catfish, Silurus asotus juveniles
2-1 Materials and methods ・・・・・・・・・・・・・・・・・・・・・ 165 2-2 Results ・・・・・・・・・・・・・・・・・・・・・・・・・・・ 168 2-3 Discussion ・・・・・・・・・・・・・・・・・・・・・・・・・ 174 Chapter 3: Influence of MCT on growth performance and fatty acid metabolism of
P. hypophthalmus and S. asotus
3-1 Materials and methods ・・・・・・・・・・・・・・・・・・・・ 178 3-2 Results ・・・・・・・・・・・・・・・・・・・・・・・・・・ 184 3-2-1 P. hypophthalmus juveniles ・・・・・・・・・・・・・・・・・ 184 3-2-2 S. asotus juveniles ・・・・・・・・・・・・・・・・・・・・ 190 3-3 Discussion ・・・・・・・・・・・・・・・・・・・・・・・・・ 196 Chapter 4: General conclusion and recommendations ・・・・・・・・・・・・・ 201 Acknowledgement・・・・・・・・・・・・・・・・・・・・・・・・・・・ 203 References ・・・・・・・・・・・・・・・・・・・・・・・・・・・・・・・ 204
Introduction
Human population has increased to the point where capture fisheries can only support two thirds of the current demand for fish (Tidwell and Allan 2001). FAO estimated that about one billion people worldwide rely on fish as their primary source of animal protein (FAO 2000). This caused rise in capture fisheries, which affect the wild fish stocks to increasingly diminish. Therefore, aquaculture production is very important to address the shortfalls in the capture fisheries.
Over the last decades, aquaculture gained great attention as a viable method to produce seafood. In 2011, aquaculture production contributed about 40% of world total fish production (FAO 2013). Freshwater fish production contributed about 42% of world total aquaculture production especially carps, tilapias and catfishes (FAO 2012). Freshwater fish can potentially support global protein demand. Production of pangasiid catfish reached more than 1.1 million MT since 2008 especially by Vietnam and exported worldwide including USA, EU especially Spain, Netherlands, Poland, Germany, Belgium, Greece and Latvia, Asia especially Malaysia and India, and Latin America especially Brazil (Ha 2013; POSMA 2009).
Striped catfish, Pangasianodon hypophthalmus is the main species cultured in Mekong river fishery (Poulsen et al. 2004). The main producer is Vietnam and to a lesser extent Thailand, Cambodia, Lao People's Democratic Republic, Myanmar, Bangladesh, China, Indonesia and Malaysia (Griffiths et al. 2010). Patin buah, Pangasius nasutus is an indigenous pangasiid species of peninsular Malaysia especially Pahang (DOF 2005). Malaysian Department of Fisheries has recognized its potential for aquaculture in Malaysia.
growth and short cycle of production and permits a large commercial fish size (Cacot and Hung, 2001). In Vietnam, P. hypophthalmus cultured in pond can reach 800 g within six months. But, some other like Clarias macrocephalus show a low growth rate and a small commercial size about 200 g (Cacot and Hung, 2001).
Pangasiid catfish is well accepted by consumers around the globe and approved in many restaurants and food making industries. The white fillet of pangasiid catfish precisely follows the criteria required by consumers like homogenous in size, color and odor of fish delivered, available around the year, less odor or fishy compared to other freshwater/marine species, traceability from source producers, therefore can ensure quality measures and most importantly inexpensive price which allow customer to have a wide range of fish product varieties (Hammond et al. 2002).
Silurus asotus is a carnivorous catfish and known as common Japanese catfish (Miyadi et al. 1976). It is also known by other names such as Amur catfish, far eastern catfish, Korean catfish or Chinese catfish (Kumakura et al. 2003). It is widely distributed in Japan especially Kinki area and western Honshu, Shikoku and Kyushu, and neighboring countries such as west Korean peninsula, east continental of China and Taiwan (Fu et al. 2006; Miwa et al. 2001). It is an important food resource in China (Katano et al. 2005) and they produced about 300,000 MT in 2006 (FAO 2008).
In Japan, however, the biomass in natural population has decreased markedly over the past several decades, probably due to water pollution and habitat reduction. Hence several prefectural fisheries experimental stations in Japan attempted to establish a culture method for this species (Kumakura et al. 2003). In China, concern over the production also addressed by several studies on the reproductive and endocrine physiology of the catfish which received attentions due to a decrease of natural stocks in recent years (Wei and Huang 1997; Wen et al. 2000). In Korea, the market demand for this species is gradually expanded in recent years (Nam et al. 2001). Since early times, S. asotus has been widely utilized as a nutritive food
and a folk medicine. The annual production of S. asotus by culture is about 8000 metric tones (Yu et al 2009). It is widely produced in Jeollabukdo Province (Park et al. 2002).
Aquaculture traditionally depended on fish meal and oil. Unfortunately, wild caught fisheries for trash fish, fish meal and oil has increase remarkably in the price due to significant increase in fuel prices on fishing vessel operations (FAO 2008). Clearly, if aquaculture is to continue to expand, alternatives to its current dependence on fish meal and oil must be developed in order to produce cost-effective fish products. Aquaculture industry also constantly striving to improve cost efficiency through increased efficiency of protein utilization, the most expensive macronutrient of fish feeds. Higher protein utilization can limit the amount of proteins used for energetic purposes, generally by manipulating other nutrients such as lipids and carbohydrates in fish feeds and spare the proteins primarily for body development and growth purposes (Gaylord and Gatlin 2000).
Dietary lipids in fish feeds is not only an important source of energy and able to spare protein in fish, but also a popular source of essential fatty acids (EFA) such as eicosapentaenoic acid (EPA) and docosahexaenoic acid (DHA). They also play role as carrier for the fat-soluble vitamins and contains attractants and enhances palatability of fish feeds (Richard et al. 2006). Alternatives for fish oil may need to fulfill some criteria, particularly ones that are of sustainable sources and at lower price than the fish oil. Plant lipids or commonly recognized as vegetables oils are the closest edible lipid alternatives to fish oil. Several vegetable oils such as palm, soybean, linseed and medium chain triglycerides (MCT) were selected in these studies based on their fatty acid profiles and potential effects.
Palm oil, being the largest vegetable oil produced in the world accounted 28.7% (53.7 million MT) of total oils and fats output in 2012, mainly produced by Indonesia and Malaysia (Mielke 2013). Palm oil undergo several processes that later defines it into several groups. In
2007). Whereas, PO is the refined, bleached, deodorized CPO, which commonly use in food preparation. Generally, both contain about 45% saturated fatty acids (SFA) and 40% monounsaturated fatty acid (MUFA) and 10-15% polyunsaturated fatty acid (PUFA) (Ng et al. 2003). Soybean oil is mainly composed of omega-6, C18:2n-6, an important n-6 precursor for higher chain PUFA in human and animal. It is the second largest vegetable oil produced in the world and widely used as an alternative to fish oil for many fish species because of its availability and low prices (Caballero et al. 2002). Linseed oil rich in omega-3 fatty acid namely C18:3n-3, containing about 55% and an important precursor of n-3 HUFA (Bell et al. 2003). MCT are mainly composed of C8:0 and C10:0 fatty acid and found in coconut oil, approximately 14% by weight but can also be found in butter ca. 9.2% and palm kernel oil ca. 7.2% (USDA 2004). MCT gain many attentions especially in human nutrition for their rapid absorption and oxidation without deposition in the body (Mustafa et al. 1991; Papamandjaris et al. 1998). MCT also demonstrated other various effects including enhancing nutrient absorption, decreasing amino acid oxidation and increasing protein utilization to animals including fish such as Atlantic salmon (Nordrum et al. 2000), rainbow trout (Nielsen et al. 2005), polka dot grouper (Smith et al. 2005), common carp (Fontagné et al. 2000), channel catfish (Stickney and Andrew 1972) and ayu (Nakagawa and Kimura 1993). However, very limited information available on MCT effect to catfish. This study, to our knowledge is the first study of MCT to pangasiid and Japanese catfish.
The main objective of these studies was to investigate the effect of dietary lipid sources as substitutes to fish oil on growth performance and fatty acid metabolism of Siluriformes.
Chapter 1 Effect of dietary vegetable oils to P. hypophthalmus and P. nasutus juveniles
Despite the success of pangasiid catfish production in South East Asia, there is surprisingly limited nutritional information on these species (Paripatananont 2002). This includes lack of data on suitable dietary lipid sources and essential fatty acids for these species (Glencross 2009). Cost-effective feeding and quality feeds are also very important in pangasiid catfish production.
Vegetable oils are recognized as cheaper solution to fish oil (FO) (Indexmundi 2013). Variety of vegetable oils are available but their effect may varied from species to species of fish which also depended on various other factors such as feeding habit, age, temperature, feeding practices and so on (Rosenlund et al. 2001; Richard et al. 2006). CPO, SBO and LO were used in this study and all fatty acid profiles were remarkably different to each other.
The main objective of this chapter is to determine the effect of CPO, SBO and LO in the diet on growth performance, nutrient utilization and liver and muscle fatty acid profiles of striped catfish, P. hypophthalmus and buah catfish, P. nasutus, juveniles.
1-1 Materials and methods Experimental design and diets
P. hypophthalmus juveniles were obtained from a local hatchery in Kedah, Malaysia, whereas juveniles of P. nasutus were obtained from the Department of Fisheries, Perlok, Pahang, Malaysia. Both were in average weight of 10 g and transported to experimental facilities in Aquaculture Research Complex of Universiti Sains Malaysia, Penang, Malaysia. Fish were acclimated to rearing conditions for 2 weeks in a 3000-L capacity canvas tank fitted to a flow through system and fed a commercially available tilapia diet (Cargill Sdn. Bhd., Butterworth, Penang, Malaysia) containing 250 g kg-1 crude protein. Then, 15 fish per
natural photoperiod of approximately 12/12 h light/dark cycle and fed experimental diets twice daily at 09:00 and 17:00 h till apparent satiation for 12 weeks. Throughout experiment, water temperature, pH and dissolved oxygen were 26–29°C, 5.2-7.0 and 4.65–6.80 mgL-1, respectively. All fish were weighed individually at the beginning and end of the experiment and group weighing was performed fortnightly to monitor growth performance and feed intake in each tank. After 12 weeks, fish were starved for 24 h and then sampled to determine carcass proximate composition, body indexes, and liver and muscle fatty acid analyses.
Four isonitrogenous (300 g kg-1) and isoenergetic (21 kJ g-1), semi-purified diets were
formulated to contain 120 g lipid kg-1 diet. Ingredients used for the dietary formulation differed only in the oil sources (Table 1.1). Casein, fishmeal and gelatine served as the protein sources in the diets, with casein as the principal source. The control diet contained fish oil (FO) as the sole lipid source. In the test diets, FO was completely substituted with either CPO, SBO or LO. Residual fish oil from fishmeal was ca. 1% of total lipid in all diets. Ingredients were thoroughly mixed in a feed mixer (Model TR202; L.J. Stuart & Company, Australia) and passed through a feed extruder (Model MH 237, Miao Hsien Ltd., Taiwan) to make 3 mm diameter pellets. The pellets were dried in an oven maintained at 60°C. Dried feed pellets were kept in separate, tightly capped bottles and stored in a freezer at –20°C until feeding trial. Feed ingredients used and proximate compositions of all the diets are presented in Table 1.1.
Growth parameters, chemical and statistical analysis The following growth parameters were applied to the data:
Daily feed intake (DFI %) = 100 × (total dry feed intake per fish) / [(initial fish weight × final fish weight)] / number of days fed
Specific growth rate (SGR) = [(ln Wf – ln Wi)/T] x 100
Hepatosomatic index (HSI %) = 100 x (liver weight/body weight)
Intraperitoneal fat (IPF %) = 100 x (intraperitoneal fat weight/body weight) Viscerosomatic index (VSI %) = 100 x (viscera weight/body weight)
Survival rate (%) = (Number of fish which survived/initial number of fish) x 100
Where Wf refers to the mean final weight, Wi is the mean initial weight of fish, T is the
feeding trial period in days.
1 FO: diet containing 100% fish oil; SBO: diet containing 100% soybean oil; CPO: diet containing 100% crude palm oil; LO: diet containing 100% linseed oil
2 Carboxy methyl cellulose (as binder)
3 Nitrogen-free extract, calculated as 100 – (protein + lipid + ash)g kg-1 4 Calculated gross energy content (Brafield 1985)
Feed ingredients, experimental diets and fish muscle were analysed for proximate
Table 1.1 Formula and proximate composition of the experimental diets (g kg-1 dry matter)
Diet1 FO SBO CPO LO Casein 247 247 247 247 Gelatine 62 62 62 62 Fish meal 109 109 109 109 Fish oil 108 Soybean oil 108
Crude palm oil 108
Linseed oil 108 Corn starch 334 334 334 334 CMC2 95 95 95 95 Vitamin mix 20 20 20 20 Mineral mix 20 20 20 20 Cr2O3 5 5 5 5 Proximate composition, g 100g-1 Crude protein 34.0 33.8 34.3 34.0 Crude lipid 12.6 12.9 13.1 12.9 Crude ash 5.50 6.06 5.86 5.82 NFE3 53.8 53.6 53.3 53.1 Energy (kJ g-1)4 22.3 22.3 22.5 22.3
extracted by chloroform methanol (2:1, v/v); crude ash at 550°C for 5 h; and crude fibre by loss on ignition of dried residue after successive digestion with 5% H2SO4. Nitrogen-free
extract (NFE) was calculated by subtracting the sum of crude protein, crude fat, crude ash, and crude fibre from the total dry matter content.
All lipid sources, test diets and pooled samples of fish liver and muscle were analysed for fatty acid profile. After total lipids of diets and fish organs were extracted according to slightly modified method of Indarti et al. (2005) and fatty acid methyl esters (FAME) were prepared prior to fatty acid analyses. Briefly, dry samples (100 mg) were weighed into clean, 10 mL screw-top glass bottles, to which 4 mL fresh solution of a mixture of methanol, concentrated sulphuric acid and chloroform (1.7:0.3:2.0, v/v/v) was added. The bottle was then vortexed for 30 seconds and bubbled by nitrogen gas, closed tightly with Teflon cap to avoid leakage and weighed. Transesterification was carried out by placing the bottle inside a heating block at 100°C for 30 min. On completion of the reaction, the bottles were cooled to ambient temperature in desiccators and weighed again to dismiss leaking samples. Then, 1 mL of distilled water was added into the mixture and thoroughly vortexed for 1 min and allowed to stand. After the formation of two phases, the lower phase containing FAME was transferred into 10 mL bottles and dried with anhydrous Na2SO4. Samples were stored in a
freezer at -20°C until GC analysis.
FAME was separated and quantified using a gas chromatograph (Automatic System XL, Perkin Elmer, USA) equipped with a flame ionization detector and a fused silica capillary Omegawax 250 column (30 m x 0.25 mm ID, 0.25 μm film thickness) (Supelco, Bellefonte, PA, USA). Chromatographic data were recorded and integrated in a personal computer (Optiplex GX 110, Dell) using Turbochrom NavigatorTM Software (Perkin Elmer, USA). The initial oven temperature was set at 50°C, held for 2 minutes, raised to 220°C at the rate of 4°C min-1, and held at 220°C for 35 min, while the injector and detector temperature were set at 250°C and 260°C, respectively. The sample size used was 1 μL. The pressure of the carrier
ionization detection were maintained at 275.6 kPa. Fatty acid was identified by comparing the retention times of FAME with the standard component FAME mixture No. 47885-U (Supelco, Sigma-Aldrich, USA) and menhaden oil. Individual fatty acid content was calculated as percentage of total fatty acids detected. Determination was performed in triplicate per sample.
Mean values for growth performance, feed utilization, body composition and indexes, muscle and liver fatty acids profile were analysed by one-way analysis of variance (ANOVA). P values <0.05 were considered significant when compared by Duncan’s multiple range test. All statistical analyses were carried out using SPSS software (v. 12.0.1 Chicago, USA).
1-2 Results Fatty acid profile of diets
Fatty acid profile of diets are shown in Table 1.2. Saturated fatty acid (SFA) is highest in CPO. Meanwhile, CPO and FO have higher monounsaturated fatty acid (MUFA) than SBO and LO. Polyunsaturated fatty acid (PUFA) was highest in LO. The FO was mainly composed of C16:0, C18:1n-9, C20:1n-9, C20:5n-3 (EPA) and C22:6n-3 (DHA). The SBO and CPO were mainly C16:0, C18:1n-9 and C18:2n-6. LO was high in C18:1n-9, C18:2n-6 and C18:3n-3. The C20:4n-6 was either undetectable or at trace levels in all diets. The LO and FO were higher in total n-3 fatty acids compared to those of SBO and CPO. Meanwhile, total n-6 fatty acid was higher in SBO followed by LO, whereas FO contained at lowest level. Both FO and LO have relatively higher n-3/n-6 ratios compared to SBO and CPO.
Growth performance, nutrient utilization and body indexes
In P. hypophthalmus, SBO diet group resulted significantly higher final body weight than FO and LO diet group (P<0.05), but not to CPO diet group. The same trend was observed in SGR. The FI was slightly higher in SBO and CPO group than FO and LO group. FE was highest in CPO group followed by SBO, LO and FO group. No significant difference obtained in PER among diet groups. HSI and IPF were similar among dietary groups, although FO group induced slightly higher HSI, while, CPO group led higher IPF. Highest VSI found in CPO group followed by SBO, FO and LO groups, and significant difference (P<0.05) was only detected between CPO and LO groups. Overall, high survival rates were observed throughout the feeding trial.
In P. nasutus, the final body weight and SGR of SBO and CPO groups were significantly higher than those of FO group. There was no significant difference in FE, PER, HSI and VSI among the dietary treatments. However, the IPF of SBO and CPO groups were significantly higher than FO group. Survival rates of all diet groups were 100%.
1Total saturated fatty acids 2Total monounsaturated fatty acids 3 Total polyunsaturated fatty acids (omega 3, n-3; omega 6, n-6) nd = non-detectable
Table 1.2 Fatty acid profiles (% area) of diets Diets FO SBO CPO LO 14:0 4.9 0.8 1.3 0.7 16:0 19.5 12.5 39.8 7.6 18:0 4.5 4.8 4.4 3.6 Total SFA1 29.0 18.0 45.5 11.9 16:1n-7 6.3 0.5 0.6 0.5 18:1n-9 21.8 24.2 39.0 18.8 18:1n-7 4.1 2.1 1.8 1.2 20:1n-9 10.1 1.0 0.8 0.8 22:1n-11 0.4 nd nd nd Total MUFA2 42.7 27.8 42.2 21.3 16:2n-4 0.3 0.1 0.1 0.0 16:3n-4 0.4 0.1 0.1 0.1 16:4n-3 0.3 0.1 0.1 nd 18:2n-6 6.1 48.2 10.0 15.7 18:3n-6 0.0 nd 0.0 nd 18:3n-3 1.5 4.8 0.4 48.9 18:4n-3 1.7 nd 0.2 0.6 20:3n-6 0.3 nd nd nd 20:4n-6 (ARA) 0.4 nd 0.1 nd 20:4n-3 1.1 nd 0.1 nd 20:5n-3 (EPA) 6.3 0.5 0.6 0.6 22:5n-3 1.5 nd nd nd 22:6n-3 (DHA) 8.7 0.5 0.9 1.0 Total PUFA3 28.6 54.3 12.6 66.9 Total n-3 21.1 5.9 2.3 51.1 Total n-6 6.8 48.2 10.1 15.7 n-3/n-6 3.1 0.1 0.2 3.3 DHA/EPA 1.38 1.00 1.50 1.67 EPA/ARA 15.75 - 6.00 -
1.3 G rowth pe rfo rmanc e, bod y index es and surviva l of P. hypop hthalmus a nd P. nasutus j uve nile f ed diets conta ining d iffe rent lipid s fo r 12 we eks P . hypo ph th al mus P . n a su tu s FO SB O CP O LO FO SBO CP O LO w ei ght (g ) 9.89 ± 0 .70 10. 15 ± 0 .70 9.8 7± 0.7 0 10. 08 ± 0 .60 10 .6 2 ± 0. 14 10 .7 1 ± 0.1 9 10 .6 9 ± 0.2 0 10 .6 3 ± 0.2 5 eig ht (g ) 21 .8 9 ± 6.7 0 a 27 .1 8 ± 9. 80 b 25 .2 2 ± 10 .90 ab 22 .8 2 ± 6. 40 a 30 .4 7 ± 2.5 9 a 38 .4 6 ± 5.35 b 38. 83 ± 3 .71 b 34 .3 6 ± 1. 50 ab 1 0.08 ± 0 .00 0. 09 ± 0.0 0 0. 09 ± 0.0 1 0. 09 ± 0. 01 0. 06 ± 0.0 0 0.06 ± 0 .00 0.05 ± 0 .00 0.07 ± 0 .01 0. 93 ± 0. 10 a 1.15 ± 0 .10 c 1. 12 ± 0 .10 bc 0.96 ± 0 .00 ab 1.22 ± 0 .10 a 1. 48 ± 0 .14 b 1. 51 ± 0. 10 b 1.36 ± 0 .06 ab ) 3 51 .9 5 ± 0.5 8 a 60 .7 8 ± 2. 47 b 67 .7 6 ± 3.7 4 c 57 .3 6 ± 2. 57 b 64 .0 9 ± 3. 82 61 .6 2 ± 6.1 1 62 .1 1 ± 3.9 3 58 .98 ± 1 0. 96 1.88 ± 0 .00 1. 91 ± 0.1 0 2. 13 ± 0.4 0 1. 79 ± 0. 20 2. 00 ± 0.1 2 1.94 ± 0 .19 1.93 ± 0 .12 1.84 ± 0 .34 ) 5 1.52 ± 0 .10 1. 44 ± 0.3 0 1. 29 ± 0.1 0 1. 24 ± 0. 30 1. 39 ± 0.0 8 1.49 ± 0 .24 1.65 ± 0 .22 1.37 ± 0 .16 6 4. 34 ± 0.7 0 ab 4.63 ± 0 .70 ab 5.33 ± 0 .60 b 3.71 ± 0 .30 a 4. 59 ± 0.5 0 4.50 ± 0 .26 4.34 ± 0 .43 4.20 ± 0 .27 ) 7 3.07 ± 1 .10 2. 59 ± 1.0 0 4. 54 ± 0.9 0 3. 19 ± 1. 10 5.56 ± 1 .19 a 8. 10 ± 0 .86 b 8. 07 ± 1. 03 b 7.07 ± 0 .64 ab al (% ) 8 95 .5 6 ± 7.7 0 10 0 ± 0.00 10 0 ± 0.0 0 10 0 ± 0.0 0 100.00 ± 0.00 10 0 ± 0. 00 10 0 ± 0.0 0 10 0 ± 0. 00 n sam
e row with dif
feren t su pe rscrip t letters are sign ifican tly d ifferen t ( P <0 .0 5) are m ean ± S D of trip licate d etermin atio ns (n = 3) ext 1 -1 M at eri al s an d m et hods f or ex pan de d ac ro ny m s
oxim ate com po siti on (g kg -1 dr y matter -ba si s) of P. hy po pht ha lm us an d P. n as ut us juve ni le fe d diet s co ntai ni ng differe nt l ipi d s ource s fo r 12 P. h yp op ht ha lm us P. n asu tu s Fin al Fi na l Ini tial FO SB O CPO LO Ini tial FO SB O CPO LO 763± 0.8 6 77 0± 0. 17 772± 0. 25 766 ±0 .3 4 77 0± 0. 52 810± 2. 70 82 0± 0. 98 80 7±1 .4 9 844 ±2 .1 8 83 5± 0. 52 829± 1.8 8 81 0± 0. 57 792± 3. 63 831 ±1 .3 5 82 8± 1. 53 761± 2. 58 80 7± 3. 51 766± 0. 92 793 ±1 .6 8 78 8± 0. 08 89 ±0 .1 0 92 ±0.67 101± 2. 15 90 ±0 .4 3 97 ±0.22 163± 0. 75 14 4± 2. 91 167± 2. 77 163 ±1 .4 9 14 4± 0. 80 80 ±0 .1 3 86 ±0 .7 9 b 78 ±0 .1 8 ab 72 ±0 .9 6 a 72 ±0 .3 5 a 65 .5 ±0 .5 9 59 .8 ±0 .1 1 61 .1 ±0 .4 4 59 .7 ±0.20 61. 2± 0. 37
e row with dif
feren t su pe rscrip t letters are sign ifican tly d ifferen t ( P <0 .0 5) D of triplicate deter m inations ( n= 3) wet w eig ht ( %)
Proximate composition of muscle
There were no significant differences in final muscle moisture, crude protein and crude lipid contents among dietary groups for both P. hypophthalmus and P. nasutus (Table 1.4). However, in P. hypophthalmus study, FO and SBO diet group showed higher crude ash contents than CPO and LO.
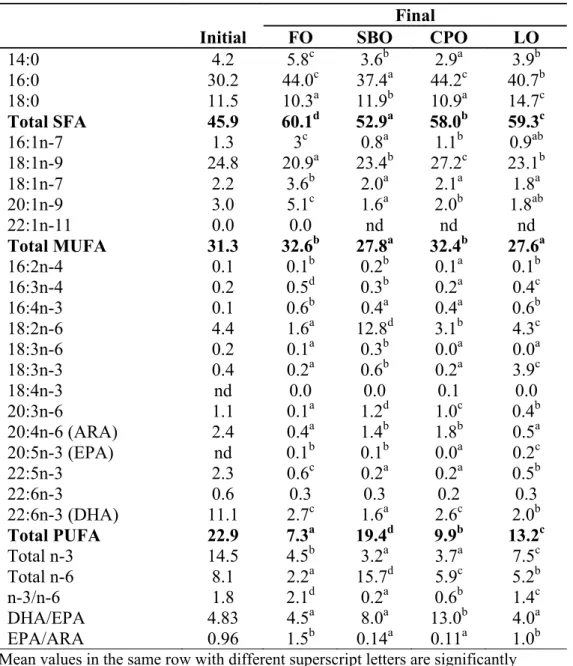
Fatty acid profile of liver and muscle of P. hypophthalmus
Table 1.5 and 1.6 are liver and muscle fatty acid profile of P. hypophthalmus juveniles fed test diets for 12 weeks. Significant difference among diets was recorded for SFA in liver, with FO recorded as highest and SBO the lowest. Liver MUFA level was higher in FO and CPO groups than SBO and LO groups. Liver PUFA level varied between dietary groups, with significantly higher level in SBO group.
At the end of rearing trial, ARA, EPA and DHA in liver particularly lower than the initial. C16:0, C18:0, C18:1n-9, C18:2n-6 and DHA showed significantly different levels among diet groups. The highest C18:2n-6 in liver was detected in juveniles fed SBO diet.ARA and EPA levels were relatively low among test groups, being significantly high in SBO and low in CPO group. DHA level of SBO group was significantly lower than other diet groups.
Highest muscle SFA found in the CPO group. CPO and FO groups showed higher MUFA than SBO and LO groups. Total PUFA level of SBO and LO groups were significantly higher than FO and CPO groups. C18:2n-6 and C18:3n-3 were higher in SBO and LO group than other diet groups. Significantly higher ARA level was shown in SBO and CPO group, and significantly higher EPA and DHA level obtained in FO group, as compared with other dietary groups.
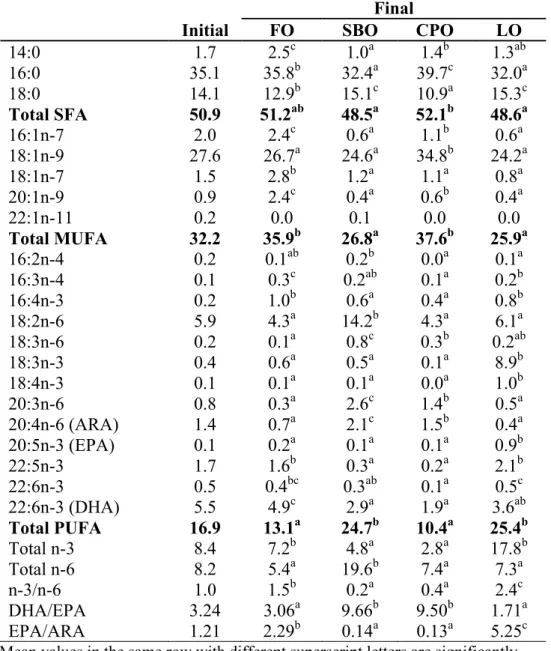
Fatty acid profile of liver and muscle of P. nasutus
Table 1.7 and 1.8 showed fatty acid profile of liver and muscle in P. nasutus fed test diets, respectively. Different dietary oil offered different fatty acid profiles of liver and muscle in P. nasutus but generally followed the fatty acid profiles of dietary oils.
Significant difference was recorded in SFA in liver, and highest and lowest levels were in CPO and SBO, respectively. MUFA level was higher in FO and CPO than SBO and LO group. PUFA level varied between dietary groups, with significant higher level found in SBO and LO group.
At the end of rearing trial, ARA, EPA and DHA in liver were similar to those in the beginning of trial. C16:0, C18:0, C18:1n-9, C18:2n-6 and DHA were significantly different among diet groups. Highest C18:2n-6 was detected in SBO group. While ARA and EPA levels were relatively low among diet groups, being significantly higher in SBO and lower in CPO group, respectively. DHA in liver of SBO and CPO group were significantly lower than other diet groups.
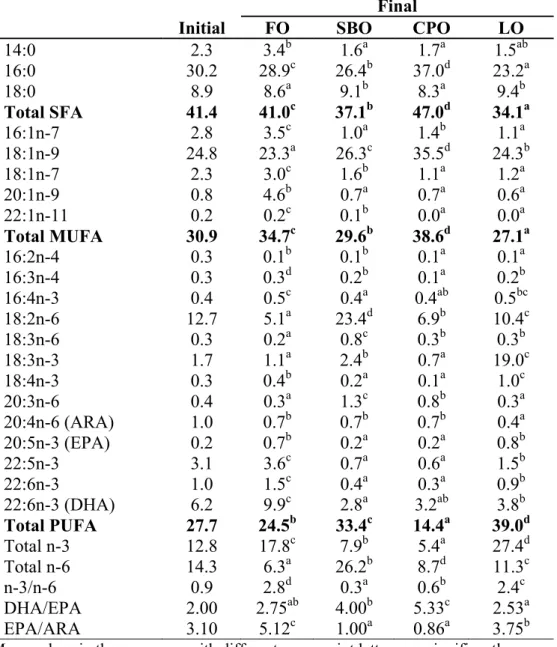
CPO group showed highest level of SFA and MUFA in muscle. PUFA level of SBO and LO group were significantly higher than FO and CPO group. C16:0 and C18:1n-9 were not significantly different among diet groups. C18:2n-6 and C18:3n-3 were higher in SBO and LO group, respectively, than other diet groups. Significantly low ARA level shown in LO group, and significantly higher EPA and DHA levels observed in FO group than other dietary groups.
Table 1.5 Liver fatty acid profile (% area) of P. hypophthalmus fed diets containing different lipid sources for 12 weeks
Final
Initial FO SBO CPO LO
14:0 4.2 5.8c 3.6b 2.9a 3.9b 16:0 30.2 44.0c 37.4a 44.2c 40.7b 18:0 11.5 10.3a 11.9b 10.9a 14.7c Total SFA 45.9 60.1d 52.9a 58.0b 59.3c 16:1n-7 1.3 3c 0.8a 1.1b 0.9ab 18:1n-9 24.8 20.9a 23.4b 27.2c 23.1b 18:1n-7 2.2 3.6b 2.0a 2.1a 1.8a 20:1n-9 3.0 5.1c 1.6a 2.0b 1.8ab 22:1n-11 0.0 0.0 nd nd nd Total MUFA 31.3 32.6b 27.8a 32.4b 27.6a 16:2n-4 0.1 0.1b 0.2b 0.1a 0.1b 16:3n-4 0.2 0.5d 0.3b 0.2a 0.4c 16:4n-3 0.1 0.6b 0.4a 0.4a 0.6b 18:2n-6 4.4 1.6a 12.8d 3.1b 4.3c 18:3n-6 0.2 0.1a 0.3b 0.0a 0.0a 18:3n-3 0.4 0.2a 0.6b 0.2a 3.9c 18:4n-3 nd 0.0 0.0 0.1 0.0 20:3n-6 1.1 0.1a 1.2d 1.0c 0.4b 20:4n-6 (ARA) 2.4 0.4a 1.4b 1.8b 0.5a 20:5n-3 (EPA) nd 0.1b 0.1b 0.0a 0.2c 22:5n-3 2.3 0.6c 0.2a 0.2a 0.5b 22:6n-3 0.6 0.3 0.3 0.2 0.3 22:6n-3 (DHA) 11.1 2.7c 1.6a 2.6c 2.0b Total PUFA 22.9 7.3a 19.4d 9.9b 13.2c Total n-3 14.5 4.5b 3.2a 3.7a 7.5c Total n-6 8.1 2.2a 15.7d 5.9c 5.2b n-3/n-6 1.8 2.1d 0.2a 0.6b 1.4c DHA/EPA 4.83 4.5a 8.0a 13.0b 4.0a EPA/ARA 0.96 1.5b 0.14a 0.11a 1.0b
Mean values in the same row with different superscript letters are significantly different (P<0.05)
Values are the mean ± SD of triplicate determinations nd = non-detectable
Mean values in the same row with different superscript letters are significantly different (P<0.05)
Values are the mean ± SD of triplicate determinations nd = non-detectable
Table 1.6 Muscle fatty acid profile (% area) of P. hypophthalmus fed diets containing different lipid sources for 12 weeks
Final
Initial FO SBO CPO LO
14:0 3.1 4.7c 3.1a 3.3ab 3.9bc 16:0 24.5 26.0a 23.2a 32.4b 22.7a 18:0 9.3 8.3 8.0 8.2 8.3 Total SFA 36.9 39.0b 34.3a 43.9c 34.9a 16:1n-7 2.2 3.0b 1.0a 1.1a 1.0a 18:1n-9 24.0 25.2a 26.5a 36.3b 27.4a 18:1n-7 3.7 3.6c 2.2b 1.6a 1.5a 20:1n-9 4.2 5.7a 1.5c 1.5b 1.1a 22:1n-11 0.0 0.0 nd nd nd Total MUFA 34.1 37.5b 31.2a 40.5b 31.0a 16:2n-4 0.1 0.1 0.1 0.1 0.1 16:3n-4 0.3 0.3 0.2 0.2 0.3 16:4n-3 0.4 0.6 0.4 0.6 0.4 18:2n-6 6.7 3.7a 23.4c 5.9a 8.6b 18:3n-6 0.3 0.1a 0.5b 0.2a 0.1a 18:3n-3 0.8 0.7a 2.1b 0.4a 17.9c 18:4n-3 nd 0.2 0.1 0.1 0.3 20:3n-6 1.0 0.5a 1.6c 1.2b 0.4a 20:4n-6 (ARA) 2.4 1.1b 1.7c 1.7c 0.4a 20:5n-3 (EPA) nd 0.8b 0.3a 0.1a 0.7b 22:5n-3 3.9 3.4b 0.5a 0.6a 1.2a 22:6n-3 0.3 1.6c 0.5a 0.5a 0.9b 22:6n-3 (DHA) 13.1 10.7b 3.1a 4.1a 3.0a Total PUFA 29.3 23.8b 34.6c 15.7a 34.3c Total n-3 18.5 18.0b 7.0a 6.4a 24.4c Total n-6 10.4 5.4a 27.2c 9.0b 9.6b n-3/n-6 1.8 3.3d 0.3a 0.7b 2.5c DHA/EPA 3.36 3.15a 6.20b 6.83b 2.50a EPA/ARA 1.63 3.10b 0.29a 0.35a 3.00b
Table 1.7 Liver fatty acid profile (% area) of P. nasutus fed diets containing different lipid sources for 12 weeks
Final
Initial FO SBO CPO LO
14:0 1.7 2.5c 1.0a 1.4b 1.3ab 16:0 35.1 35.8b 32.4a 39.7c 32.0a 18:0 14.1 12.9b 15.1c 10.9a 15.3c Total SFA 50.9 51.2ab 48.5a 52.1b 48.6a 16:1n-7 2.0 2.4c 0.6a 1.1b 0.6a 18:1n-9 27.6 26.7a 24.6a 34.8b 24.2a 18:1n-7 1.5 2.8b 1.2a 1.1a 0.8a 20:1n-9 0.9 2.4c 0.4a 0.6b 0.4a 22:1n-11 0.2 0.0 0.1 0.0 0.0 Total MUFA 32.2 35.9b 26.8a 37.6b 25.9a 16:2n-4 0.2 0.1ab 0.2b 0.0a 0.1a 16:3n-4 0.1 0.3c 0.2ab 0.1a 0.2b 16:4n-3 0.2 1.0b 0.6a 0.4a 0.8b 18:2n-6 5.9 4.3a 14.2b 4.3a 6.1a 18:3n-6 0.2 0.1a 0.8c 0.3b 0.2ab 18:3n-3 0.4 0.6a 0.5a 0.1a 8.9b 18:4n-3 0.1 0.1a 0.1a 0.0a 1.0b 20:3n-6 0.8 0.3a 2.6c 1.4b 0.5a 20:4n-6 (ARA) 1.4 0.7a 2.1c 1.5b 0.4a 20:5n-3 (EPA) 0.1 0.2a 0.1a 0.1a 0.9b 22:5n-3 1.7 1.6b 0.3a 0.2a 2.1b 22:6n-3 0.5 0.4bc 0.3ab 0.1a 0.5c 22:6n-3 (DHA) 5.5 4.9c 2.9a 1.9a 3.6ab Total PUFA 16.9 13.1a 24.7b 10.4a 25.4b Total n-3 8.4 7.2b 4.8a 2.8a 17.8b Total n-6 8.2 5.4a 19.6b 7.4a 7.3a n-3/n-6 1.0 1.5b 0.2a 0.4a 2.4c DHA/EPA 3.24 3.06a 9.66b 9.50b 1.71a EPA/ARA 1.21 2.29b 0.14a 0.13a 5.25c
Mean values in the same row with different superscript letters are significantly different (P<0.05)
Values are the mean ± SD of triplicate determinations nd = non-detectable
Table 1.8 Muscle fatty acid profile (% area) of P. nasutus fed diets containing different lipid sources for 12 weeks
Final
Initial FO SBO CPO LO
14:0 2.3 3.4b 1.6a 1.7a 1.5ab 16:0 30.2 28.9c 26.4b 37.0d 23.2a 18:0 8.9 8.6a 9.1b 8.3a 9.4b Total SFA 41.4 41.0c 37.1b 47.0d 34.1a 16:1n-7 2.8 3.5c 1.0a 1.4b 1.1a 18:1n-9 24.8 23.3a 26.3c 35.5d 24.3b 18:1n-7 2.3 3.0c 1.6b 1.1a 1.2a 20:1n-9 0.8 4.6b 0.7a 0.7a 0.6a 22:1n-11 0.2 0.2c 0.1b 0.0a 0.0a Total MUFA 30.9 34.7c 29.6b 38.6d 27.1a 16:2n-4 0.3 0.1b 0.1b 0.1a 0.1a 16:3n-4 0.3 0.3d 0.2b 0.1a 0.2b 16:4n-3 0.4 0.5c 0.4a 0.4ab 0.5bc 18:2n-6 12.7 5.1a 23.4d 6.9b 10.4c 18:3n-6 0.3 0.2a 0.8c 0.3b 0.3b 18:3n-3 1.7 1.1a 2.4b 0.7a 19.0c 18:4n-3 0.3 0.4b 0.2a 0.1a 1.0c 20:3n-6 0.4 0.3a 1.3c 0.8b 0.3a 20:4n-6 (ARA) 1.0 0.7b 0.7b 0.7b 0.4a 20:5n-3 (EPA) 0.2 0.7b 0.2a 0.2a 0.8b 22:5n-3 3.1 3.6c 0.7a 0.6a 1.5b 22:6n-3 1.0 1.5c 0.4a 0.3a 0.9b 22:6n-3 (DHA) 6.2 9.9c 2.8a 3.2ab 3.8b Total PUFA 27.7 24.5b 33.4c 14.4a 39.0d Total n-3 12.8 17.8c 7.9b 5.4a 27.4d Total n-6 14.3 6.3a 26.2b 8.7d 11.3c n-3/n-6 0.9 2.8d 0.3a 0.6b 2.4c DHA/EPA 2.00 2.75ab 4.00b 5.33c 2.53a EPA/ARA 3.10 5.12c 1.00a 0.86a 3.75b
Mean values in the same row with different superscript letters are significantly different (P<0.05)
Values are the mean ± SD of triplicate determinations nd = non-detectable
1-3 Discussion
Chapter 1 revealed that both P. hypophthalmus and P. nasutus grow better on vegetable oils especially SBO and CPO than FO without negative effects. Fatty acid profile in CPO diet dominated by 40% of C16:0 and 40% of C18:1n-9, and another 10% by C18:2n-6. While SBO diet also comprised of similar fatty acids, which constituted about 50% of C18:2n-6 and 35% of both C16:0 and C18:1n-9. These three major fatty acids in CPO and SBO diets likely the reason to better growth in both pangasiid catfish. Additionally, their preferences to these fatty acids is supported by the fact that these fatty acids are also playing role as major constituents in phospholipids and neutral lipids in many fish species (Opstvedt 1985; Sargent et al. 2002). C16:0 is also a major fatty acid in fish phospholipid bilayer, especially plasma membrane and endoplasmic reticulum (Sargent et al. 2002). Sargent (1989) also specified C16:0 and C18:1n-9 as major sources of metabolic energy in fish and are oxidised by conventional mitochondrial β-oxidation pathways. Hence, providing the pangasiids with fatty acids according to their body lipid preferences and needs may uncomplicate fatty acids metabolism and therefore conserve greater amount of energy for other body functions and developments. Therefore, this study showed dietary CPO and SBO as the ideal lipid source for both pangasiid catfish.
Both SBO and CPO diet have low n-3/n-6 ratio, therefore indicate the importance of dietary n-6. The n-6 were mainly of C18:2n-6, therefore both pangasiid catfish indicate their preference on C18:2n-6 to promote good growth. Other studies also showed preferences on n-6 HUFA for better growth such as tilapias (Tilapia zilli and Oreochromis niloticus) and snakehead (Channa micropeltes) (Kanazawa 1985), whereas some other freshwater fish require both n-3 and n-6 series PUFA such as carps (Ctenopharyngodon idella), eel (Anguilla sp.), milkfish (Chanos chanos), chum (Oncorhynchus keta), Atlantic salmon (Salmo salar) and rainbow trout (Onchorynchus mykiss) (Kanazawa 1985; Glencross 2009; Tocher 2010). Additionally, pangasiid catfish fed on SBO diet grew much better than FO diet although it
has lower SFA and MUFA than FO diet shows that omega-6 may exclusively important for pangasiid catfish juveniles.
It is also noteworthy to mention that good growth in SBO and CPO groups is also corresponding to high level of ARA in liver and muscle which then follow another indication of possible requirement of ARA. ARA may possibly synthesized from C18:2n-6, given that there was only trace amount of ARA available from the diets. ARA or its metabolic products, has a number of important physiological roles including improved growth and survival rates, especially in early life stages, stress resistance, egg and larval quality and immune function (Bell and Sargent, 2003). The importance of ARA also demonstrated by Castell et al. (1994) and Bell et al. (1995) in turbot juveniles with a requirement of 0.3% of dry diet.
In CPO diet, both C16:0 and C18:1n-9 were high, however in muscle and liver of both pangasiid catfish, C18:1n-9 was apparently low and C16:0 remain high. This suggests the preferences of C18:1n-9 for catabolism for β-oxidation in fish and that C16:0 dominantly for phospholipid (Bell and Dick 1991). This observation agreed with Henderson and Sargent (1985) and Henderson (1996), where they reported MUFA especially C16:1, C18:1n-9 and C22:1n-9 were preferred as substrate for energy production by β-oxidation pathway in salmonids, as well as C16:0 and C18:2n-6. On the other hand, SBO and LO diets contained lower SFA and MUFA compared to FO and CPO diets. Both pangasiid catfish might have utilized the major fatty acids in SBO and LO, C18:2n-6 and C18:3n-3, respectively for energy production. Menoyo et al. (2007) also observed that Atlantic salmon utilized fatty acid that easily metabolized and most abundant in the diet for energy production via β-oxidation.
Pangasiid catfish also showed low DHA in liver and muscle, which suggests additional metabolization of DHA in the liver to generate required amount of energy. This is similar to some other studies on salmon and rainbow trout which found C18:3n-3, EPA and DHA being
et al. (2011) suggests that SFA, MUFA and PUFA were found to have a significant effect on the final n-3 HUFA content of cultured fish especially SFA and MUFA when in abundant availability can spare n-3 HUFA.
Chapter 2 Effect of dietary palm oil and MCT to Japanese catfish,
Silurus asotus juveniles
The substitution of dietary FO by vegetable oil may serves as an effective approach to reduce production cost in aquaculture due to their abundance and relatively stable prices (Caballero et al. 2002; Turchini et al. 2003). Vegetable oil as an alternative is being used in greater amounts and has gained a lot of interest in aquaculture for the past decades. Palm oil (PO), most produced edible vegetable oil in the world, has relatively low price compare to FO. The PO has two dominant fatty acids, C16:0 and C18:1n-9, which known as preferred substrates for β-oxidation (Kiessling and Kiessling 1993; Henderson 1996) and became highly recommended lipid source in fish feed. Dietary CPO had positive effects on growth performance in many fish species including salmonids (Bell et al. 2002; Ng et al. 2007), rainbow trout (Oo et al. 2007), tilapia (Bahurmiz and Ng 2007), African catfish (Ng et al. 2003) and snakehead (Aliyu-Paiko and Hashim 2011).
As referred to some studies, it appears that supplementation of MCT may have potential in allowing higher utilization of total lipids and therefore have the possibility to increase protein retention in fish (Davis et al. 1999; Nielsen et al. 2005).
The previous Chapter 1 showed dietary FO can be replaced by vegetable oils especially CPO and SBO for P. hypophthalmus and P. nasutus juveniles. In this Chapter 2, the substitution of dietary FO with refined PO and the supplementation of medium chain triglyceride (MCT) were investigated on growth performance of Japanese catfish, S. asotus.
2-1 Materials and methods Experimental design and diets
fish diet (Nosan Ind. Corp., Japan) with 45% crude protein during the acclimation period. Each 20 fish with an average weight of 7.3 g were randomly distributed into triplicate circular 100 l black PVC tank. Fish were kept under 12/12 h light/dark cycle and fed experimental diets twice daily at 09:00 and 16:00 h till apparent satiation for 8 weeks. Tanks were supplied with de-chlorinated tap water and aerated continuously in a closed system. About 80% of rearing water was changed daily in the morning before feeding, and faecal matter were syphoned out in the afternoon. During the experiment, water temperature and dissolved oxygen were between 24–28°C and 6–12 mg l-1, respectively. Uneaten feeds were
collected by syphoning them out shortly after each meal. Feed intake was recorded daily by substracting uneaten feed from total feed fed. Fish were weighed in bulk forthnightly to monitor growth performance. At the end of feeding trial, fish body weight and length were measured individually from each tank and kept in a deep freezer at -80°C until analysis.
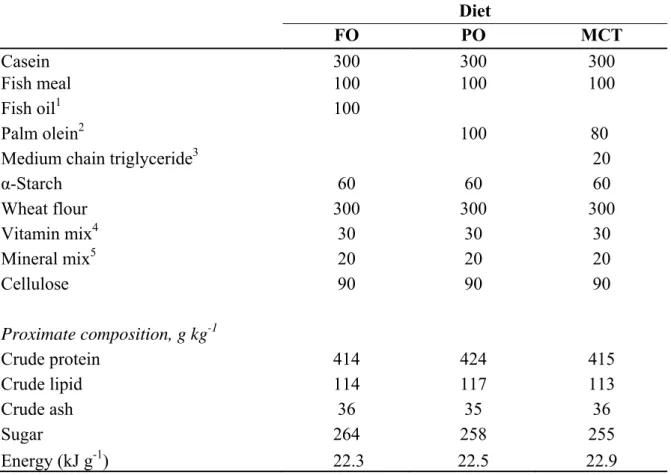
Three isonitrogenous (418 g kg-1), isolipidic (110 g kg-1) and isoenergetic (22.5 kJg-1), semi-purified diets were prepared with similar ingredients except for oil sources (Table 2.1). The oil for the control diet is FO (Ueda Oil Ltd. Co., Osaka, Japan). PO and MCT diets were the complete substitution of FO with PO (Fuji Oil Co. Ltd., Osaka, Japan), and a blend of 80% PO and 20% MCT (Fuji Oil Co. Ltd., Osaka, Japan) at 10% dietary level. The MCT was composed of ca. 98% C10:0. Residual oil in Anchovy fish meal was less than 1% of total lipid in all diets. Ingredients were mixed thoroughly and passed through a pellet machine (VR-750, Royal Brand, Tokyo, Japan) to make pellets with 2.5 mm in diameter. The pellets were then dried by a freeze dryer (Yamato Scientific Co., Ltd., Tokyo, Japan), kept in separate tightly sealed plastic bags and stored in a freezer at –20°C.
Table 2.1 Formula and proximate composition of the experimental diets (g kg-1 dry matter) Diet FO PO MCT Casein 300 300 300 Fish meal 100 100 100 Fish oil1 100 Palm olein2 100 80
Medium chain triglyceride3 20
α-Starch 60 60 60 Wheat flour 300 300 300 Vitamin mix4 30 30 30 Mineral mix5 20 20 20 Cellulose 90 90 90 Proximate composition, g kg-1 Crude protein 414 424 415 Crude lipid 114 117 113 Crude ash 36 35 36 Sugar 264 258 255 Energy (kJ g-1) 22.3 22.5 22.9
1 Feed oil from Ueda Oil Co. Ltd., Osaka, Japan 2 Palm olein from Fuji Oil Co. Ltd., Osaka, Japan 3 MCT oil from Fuji Oil Co. Ltd., Osaka, Japan
4 Vitamin mixture (mg/100g): Thiamine HCl 6, Riboflavin 20, Pyridoxine HCl 4, Niacin 80, Calcium pantothenate 28, Inositol 400, Biotin 0.6, Folic acid 1.5, p-Aminobenzoic acid 40, Choline chloride 800, Ascorbic acid 200, a-Tocopherol 40, Menadione 4, Activated 7-dehydrocholesterol 0.0045, Cyanobalamin 0.06 and Retinol 0.68
5 Halver (1957)
Growth parameters, chemical and statistical analysis
Growth parameters and chemical analysis used in this study were the same as cited in Chapter 1. Below is calculation for APR and ALR;
Apparent protein retention (APR %)=100 x [protein gain in fish (g) / protein intake in food (g)].
Sciences Inc., Japan) equipped with a Capillary Column Inert Cap Pure WAX(0.25 mm x 30 m I.D; GL Sciences Inc., Japan) and a flame ionization detector. Tricosanoic acid methyl ester (Sigma-Aldrich, USA) was used as an internal standard. The column oven temperature was increased from 180 to 240°C at a rate of 4°C/min and then the temperature was maintained at 240°C for 20 min. The carrier gas was nitrogen, and source and column head pressure were 5 and 1 kgf/cm2, respectively. The final temperature for the injector and detector were 260 and 290°C, respectively. Peak quantification was performed with EZ Chrom Elite 1 Inst. Version 3.1.7J Software (GL Sciences Inc., Japan).
All statistical analyses were performed using SPSS program for Window (v.12.0, USA).
2-2 Results Fatty acid profile of diets
Fatty acid profiles of test diets are shown in Table 2.2.
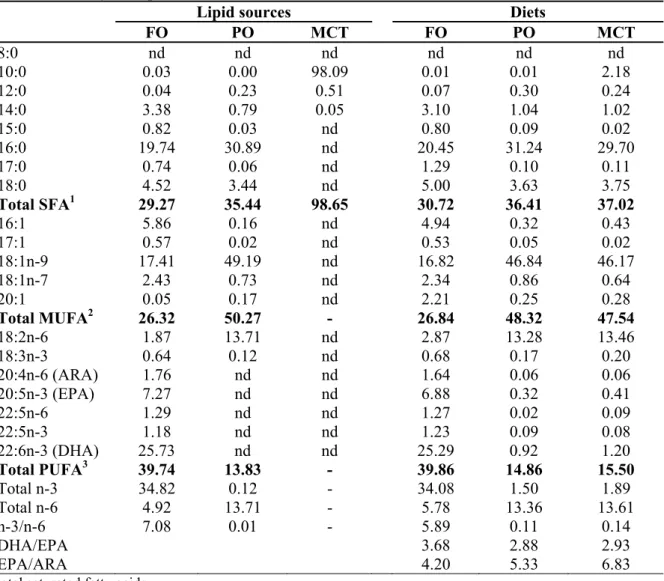
The main fatty acid of FO is 39% PUFA, mainly DHA, and summed up by other PUFA such as C18:2n-6, C18:3n-3, ARA, EPA and C22:5n-3. Others were 30% of SFA and 26% of MUFA. Whereas, PO is mainly formed by 50% MUFA especially C18:1n-9, and 36% SFA especially C16:0. The C18:2n-6 also contributed 13.8% of PUFA. About 98% of MCT were from C10:0. Fatty acid profiles of test diets were generally imitated from respective lipid source, including traces amount of PUFA in both PO and MCT diets, which contributed mainly from fish meal.
Table 2.2 Fatty acid profiles (% area) of oils and test diets
Lipid sources Diets
FO PO MCT FO PO MCT 8:0 nd nd nd nd nd nd 10:0 0.03 0.00 98.09 0.01 0.01 2.18 12:0 0.04 0.23 0.51 0.07 0.30 0.24 14:0 3.38 0.79 0.05 3.10 1.04 1.02 15:0 0.82 0.03 nd 0.80 0.09 0.02 16:0 19.74 30.89 nd 20.45 31.24 29.70 17:0 0.74 0.06 nd 1.29 0.10 0.11 18:0 4.52 3.44 nd 5.00 3.63 3.75 Total SFA1 29.27 35.44 98.65 30.72 36.41 37.02 16:1 5.86 0.16 nd 4.94 0.32 0.43 17:1 0.57 0.02 nd 0.53 0.05 0.02 18:1n-9 17.41 49.19 nd 16.82 46.84 46.17 18:1n-7 2.43 0.73 nd 2.34 0.86 0.64 20:1 0.05 0.17 nd 2.21 0.25 0.28 Total MUFA2 26.32 50.27 - 26.84 48.32 47.54 18:2n-6 1.87 13.71 nd 2.87 13.28 13.46 18:3n-3 0.64 0.12 nd 0.68 0.17 0.20 20:4n-6 (ARA) 1.76 nd nd 1.64 0.06 0.06 20:5n-3 (EPA) 7.27 nd nd 6.88 0.32 0.41 22:5n-6 1.29 nd nd 1.27 0.02 0.09 22:5n-3 1.18 nd nd 1.23 0.09 0.08 22:6n-3 (DHA) 25.73 nd nd 25.29 0.92 1.20 Total PUFA3 39.74 13.83 - 39.86 14.86 15.50 Total n-3 34.82 0.12 - 34.08 1.50 1.89 Total n-6 4.92 13.71 - 5.78 13.36 13.61 n-3/n-6 7.08 0.01 - 5.89 0.11 0.14 DHA/EPA 3.68 2.88 2.93 EPA/ARA 4.20 5.33 6.83
1Total saturated fatty acids 2Total monounsaturated fatty acids
3Total polyunsaturated fatty acids (omega 3, n-3; omega 6, n-6) nd = non-detectable
Growth performance, nutrient utilization and body indexes
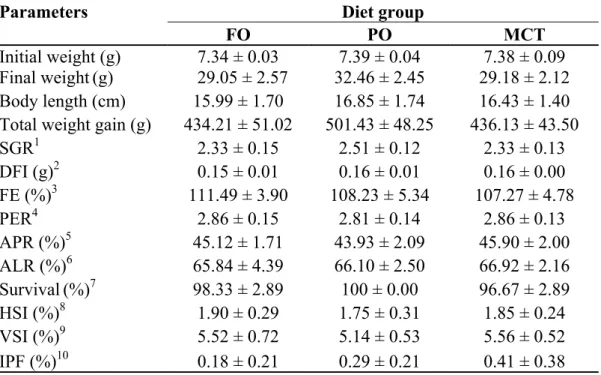
The final body weight, SGR, FCR, PER and body indexes such as HSI, VSI and IPF of S. asotus juveniles fed test diets for 8 weeks are shown in Table 2.3.
There was no significant difference in final body weight, however, PO diet group have numerically higher weight gain and SGR compared to FO and MCT diet groups. The FI, PER,
Proximate composition of whole body
There was no significant difference in the initial and the final whole body proximate composition, such as moisture, crude protein, crude lipid and crude ash contents, among dietary treatments (Table 2.4).
Fatty acid profile of liver and muscle
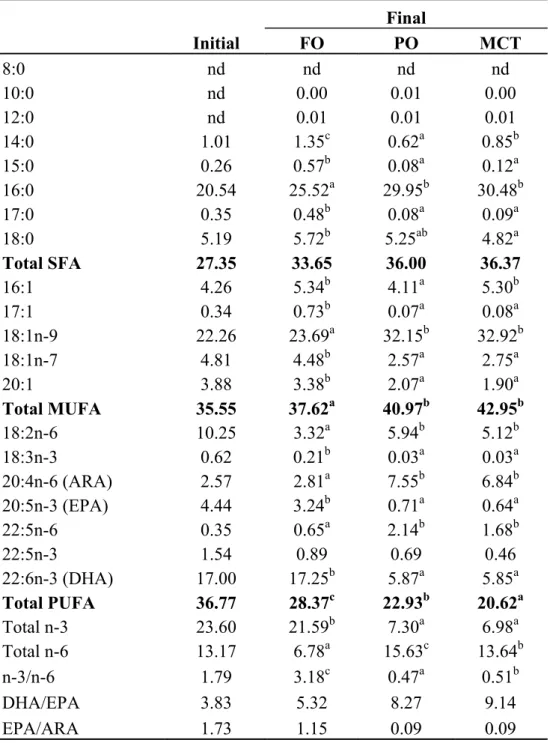
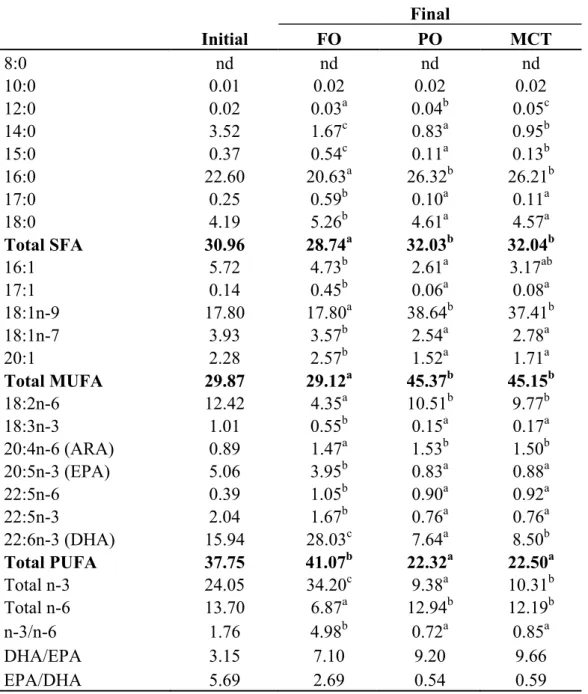
The liver and muscle fatty acid profiles of S. asotus juveniles fed test diets are shown in Tables 2.5 and 2.6, respectively. Both fatty acid profiles were generally reflected from those of respective diets.
In the liver, no significant difference (P>0.05) was recorded for SFA level among the dietary treatments. The C10:0 was undetectable in liver of MCT group. The MUFA level were significantly higher in PO and MCT groups than FO group, but PUFA level was significantly higher in FO group, followed by PO and MCT groups.
The main liver fatty acids, such as C16:0, C18:0, C18:1n-9 and C18:2n-6, showed significant differences among the test diet groups, whereas their differences did not show meaningful trend. While ARA level of PO and MCT groups were higher than FO groups, EPA and DHA levels of FO group were higher than other diet groups.
In the muscle fatty acid profile, PO and MCT groups showed little bit higher SFA level compared to FO group. Meanwhile, significantly higher MUFA level was obtained in PO and MCT groups, but PUFA level was high in FO group. Muscle fatty acid levels of C16:0, C18:0 and ARA indicated significant differences among the test diet groups, whereas the magnitude of differences was lower than those of the liver. On the other hand, C18:1n-9 and C18:2n-6 levels of PO and MCT groups were higher than FO group. Muscle levels of EPA and DHA were higher in FO group than PO and MCT groups.
The DHA/EPA ratio in liver and muscle were higher in PO and MCT groups compared to FO groups. In contrast, the EPA/ARA ratios in liver and muscle were lower in PO and MCT
*
1-4, 7-10 See text 1-1 Materials and methods of Chapter 1 for detailed information
5Apparent protein retention (APR %)=100x[protein gain in fish (g) / protein intake in food (g)] 6Apparent lipid retention (ALR %) = 100 x [lipid gain in fish (g) / lipid intake in food (g)]
Table 2.4 Whole body proximate composition (wet tissue-basis, %) of S. asotus juvenile fed diets containing different dietary lipid sources for 8 weeks
Final Initial FO PO MCT Moisture 79.88 ± 0.43 75.03 ± 1.10 75.59 ± 0.59 75.17 ± 0.55 Crude protein 14.20 ± 0.12 15.46 ± 0.31 15.34 ± 0.42 15.58 ± 0.18 Crude lipid 2.91 ± 0.14 5.40 ± 0.88 5.81 ± 0.44 5.58 ± 0.81 Crude ash 2.27 ± 0.26 2.46 ± 0.16 2.49 ± 0.39 3.17 ± 0.95
Table 2.3 Growth performance, nutrient utilization, body indexes and survival of S. asotus juveniles fed diets containing different lipid sources for 8 weeks
Parameters Diet group
FO PO MCT
Initial weight (g) 7.34 ± 0.03 7.39 ± 0.04 7.38 ± 0.09 Final weight(g) 29.05 ± 2.57 32.46 ± 2.45 29.18 ± 2.12 Body length (cm) 15.99 ± 1.70 16.85 ± 1.74 16.43 ± 1.40 Total weight gain (g) 434.21 ± 51.02 501.43 ± 48.25 436.13 ± 43.50
SGR1 2.33 ± 0.15 2.51 ± 0.12 2.33 ± 0.13 DFI (g)2 0.15 ± 0.01 0.16 ± 0.01 0.16 ± 0.00 FE (%)3 111.49 ± 3.90 108.23 ± 5.34 107.27 ± 4.78 PER4 2.86 ± 0.15 2.81 ± 0.14 2.86 ± 0.13 APR (%)5 45.12 ± 1.71 43.93 ± 2.09 45.90 ± 2.00 ALR (%)6 65.84 ± 4.39 66.10 ± 2.50 66.92 ± 2.16 Survival(%)7 98.33 ± 2.89 100 ± 0.00 96.67 ± 2.89 HSI (%)8 1.90 ± 0.29 1.75 ± 0.31 1.85 ± 0.24 VSI (%)9 5.52 ± 0.72 5.14 ± 0.53 5.56 ± 0.52 IPF (%)10 0.18 ± 0.21 0.29 ± 0.21 0.41 ± 0.38
Table 2.5 Liver fatty acid profiles (% area) of S. asotus juvenile fed diets containing different dietary lipid sources for 8 weeks
Final Initial FO PO MCT 8:0 nd nd nd nd 10:0 nd 0.00 0.01 0.00 12:0 nd 0.01 0.01 0.01 14:0 1.01 1.35c 0.62a 0.85b 15:0 0.26 0.57b 0.08a 0.12a 16:0 20.54 25.52a 29.95b 30.48b 17:0 0.35 0.48b 0.08a 0.09a 18:0 5.19 5.72b 5.25ab 4.82a Total SFA 27.35 33.65 36.00 36.37 16:1 4.26 5.34b 4.11a 5.30b 17:1 0.34 0.73b 0.07a 0.08a 18:1n-9 22.26 23.69a 32.15b 32.92b 18:1n-7 4.81 4.48b 2.57a 2.75a 20:1 3.88 3.38b 2.07a 1.90a Total MUFA 35.55 37.62a 40.97b 42.95b 18:2n-6 10.25 3.32a 5.94b 5.12b 18:3n-3 0.62 0.21b 0.03a 0.03a 20:4n-6 (ARA) 2.57 2.81a 7.55b 6.84b 20:5n-3 (EPA) 4.44 3.24b 0.71a 0.64a 22:5n-6 0.35 0.65a 2.14b 1.68b 22:5n-3 1.54 0.89 0.69 0.46 22:6n-3 (DHA) 17.00 17.25b 5.87a 5.85a Total PUFA 36.77 28.37c 22.93b 20.62a Total n-3 23.60 21.59b 7.30a 6.98a Total n-6 13.17 6.78a 15.63c 13.64b n-3/n-6 1.79 3.18c 0.47a 0.51b DHA/EPA 3.83 5.32 8.27 9.14 EPA/ARA 1.73 1.15 0.09 0.09
All mean values in the same row with different superscript letters are significantly different (P<0.05)
Table 2.6 Muscle fatty acid profiles (% area) of S. asotus juvenile fed diets containing different dietary lipid sources for 8 weeks
Final Initial FO PO MCT 8:0 nd nd nd nd 10:0 0.01 0.02 0.02 0.02 12:0 0.02 0.03a 0.04b 0.05c 14:0 3.52 1.67c 0.83a 0.95b 15:0 0.37 0.54c 0.11a 0.13b 16:0 22.60 20.63a 26.32b 26.21b 17:0 0.25 0.59b 0.10a 0.11a 18:0 4.19 5.26b 4.61a 4.57a Total SFA 30.96 28.74a 32.03b 32.04b 16:1 5.72 4.73b 2.61a 3.17ab 17:1 0.14 0.45b 0.06a 0.08a 18:1n-9 17.80 17.80a 38.64b 37.41b 18:1n-7 3.93 3.57b 2.54a 2.78a 20:1 2.28 2.57b 1.52a 1.71a Total MUFA 29.87 29.12a 45.37b 45.15b 18:2n-6 12.42 4.35a 10.51b 9.77b 18:3n-3 1.01 0.55b 0.15a 0.17a 20:4n-6 (ARA) 0.89 1.47a 1.53b 1.50b 20:5n-3 (EPA) 5.06 3.95b 0.83a 0.88a 22:5n-6 0.39 1.05b 0.90a 0.92a 22:5n-3 2.04 1.67b 0.76a 0.76a 22:6n-3 (DHA) 15.94 28.03c 7.64a 8.50b Total PUFA 37.75 41.07b 22.32a 22.50a Total n-3 24.05 34.20c 9.38a 10.31b Total n-6 13.70 6.87a 12.94b 12.19b n-3/n-6 1.76 4.98b 0.72a 0.85a DHA/EPA 3.15 7.10 9.20 9.66 EPA/DHA 5.69 2.69 0.54 0.59
All mean values in the same row with different superscript letters are significantly different (P<0.05)
2-3 Discussion
In this Chapter 2, S. asotus juveniles well utilized PO as an alternative of FO without compromising growth, which is similar to P. hypophthalmus and P. nasutus juveniles in Chapter 1. There was also no significant difference in daily feed intakes among dietary treatments, which indicates good palatability of PO diet for S. asotus. Moreover, no significant difference detected in final body weight and feed efficiency among the dietary treatments. Aliyu-Paiko and Hashim (2011) also found higher feed intake for PO than FO diet in snakehead Channa striatus. Results in Chapter 1 and 2 showed that P. hypophthalmus, P. nasutus and S. asotus juveniles were able to use CPO or PO effectively as the main dietary oil source, in spite of the differences in species specificity.
CPO diet in Chapter 1 and the PO diet in Chapter 2 have similar fatty acid profile, where both mostly composed of C16:0, C18:1n-9 and C18:2n-6, and also have very low n-3PUFA. All Siluriformes catfish that fed on CPO or PO diet in Chapter 1 and 2 also contained high level of ARA in liver, and this may a factor to better growth performances in Siluriformes. These could also signify the requirement of ARA to maintain good growth. In addition, S. asotus juveniles fed PO and MCT diets have similar growth performance with control FO group. These comparable growth performances possibly associated to high ARA in liver of PO and MCT group. The increase of ARA in liver mainly contributed by elongation activity of C18:2n-6 since ARA were only found in trace amount in PO and MCT diets. ARA synthesis also relate to the fact that EPA and DHA were very low in both diet groups, therefore, ARA sustained as a response to low EPA and DHA in the diet for S. asotus. Meanwhile, as EPA and DHA were high in FO diet, ARA was not synthesized as much as in PO and MCT groups because EPA and DHA might have fulfilled the HUFA requirement by S. asotus. These results indicate S. asotus may require HUFA either ARA or EPA and DHA to achieve optimum growth performance.
smooth muscle contraction (Henderson et al. 1985; Reilly et al. 1998). It may be a minor component but increasingly depicts necessity in diet for both marine fish and freshwater fish culture. Nonetheless, it deserves as much consideration as DHA and EPA as essential fatty acid for fish and any other vertebrate species (Sargent et al. 1999). Freshwater fish are known to be able to convert the carbon 18 fatty acids such as C18:2n-6 to ARA and C18:3n-3 to EPA and DHA (Sargent et al. 2002).
In this Chapter 3, EPA and DHA retained in liver and muscle of S. asotus for all diet groups, which suggest the importance of these HUFA for S. asotus. Shirai et al. (2002)
reported that cultivated or wild S. asotus have high content of DHA in dorsal muscle during
summer, which indicate S. asotus familiar to n-3HUFA.Satoh et al. (1989) found n−3HUFA
appear to be responsible for the enhanced growth of channel catfish. However, other catfish
like African catfish is not adapted to n-3HUFA, where growth decline was found when they
fed with cod liver oil which contained high n-3HUFA (Ng et al. 2003).
In any case, PO is preferred oil by P. hypophthalmus, P. nasutus and S. asotus and this is important considering the declining production of especially Peruvian and Chilean fish oil (Globefish 2013a). Moreover, the price of FO as in the last quarter of 2012 was USD 2183 per metric ton and this was not only 43% higher than the average price in the last quarter of 2011 (Globefish 2013b), but also was far more expensive than PO which was only USD 795 per metric ton (Indexmundi, 2013).
This chapter also found no further advantage when MCT added to PO diet, neither to growth performance nor nutrients efficiencies of S. asotus juveniles, which similar to Nile Tilapia Oreochromis niloticus (Takeuchi et al. 1983) and channel catfish Ictalurus punctatus (Stickney and Andrews 1972). However, Nakagawa and Kimura (1993) found dietary MCT improved growth gain and feed utilization in ayu, Plecoglossus altevelis. Common carp,
diet. The C10:0 may selectively be -oxidized, especially in mitochondrial of liver for energy production. Smith et al. (2005) recognized that MCT in diet provided polka dot grouper, Chromileptes altevelis as a more utilizable energy than long chain fatty acid. Other studies also reported low deposition of medium chain fatty acids in fish may due to its preference to be -oxidized for energy production (Fontagné et al. 2000; Nielsen et al. 2005).
Although MCT can be used as energy, there was no significant effect of protein sparing by MCT supplemented at 2% level of PO in this study. However, some other study showed positive results on protein sparing by MCT. Nielsen et al. (2005) reported that the addition of MCT to the diet increased in carcass protein content of rainbow trout. Whereas, Nordrum et al. (2000) also reported that MCT increased digestibility of protein and starch, and increased nitrogen retention from 52% to 66% of Atlantic salmon.
Chapter 3 Influence of MCT on growth performance and fatty acid metabolism of P.
hypophthalmus and S. asotus
In Chapter 1, P. hypophthalmus and P. nasutus juveniles were successfully fed with vegetable oil diets, especially CPO and SBO without adverse effects. In Chapter 2, S. asotus juveniles fed on PO diet and MCT supplemented diet showed comparable growth performance to control FO diet. In general, both chapters showed that P. hypophthalmus, P. nasutus and S. asotus juveniles can be fed with vegetable oil -based diets, particularly palm oil.
In this Chapter 3, MCT was used to gradually replace PO in the diets for P. hypophthalmus and S. asotus juveniles. MCT are fatty acids with carbon chain length of 6-10 and are more readily absorbed and utilized by the body and cells. They also do not require carnitine as do long chain fatty acids (Bach and Babayan 1982). Because of this metabolism acceleration, medium chain fatty acids not stored and efficiently converted into energy for immediate use by organs and muscles. This efficiency attributed by the fact that medium chain fatty acids cross the double mitochondrial membrane very rapidly. As a result, there are excess of acetyl-coA, which then follows various metabolic pathways, both in the mitochondria (Krebs Cycle) and the cytosol, resulting in the production of ketones which attributed to increase energy production (Calabrese et al. 1999).
MCT demonstrated an increase in feed utilization of ayu up to 50% MCT of total lipid (Mustafa et al. 1991). It is also reported that MCT enhance nutrient absorption, decrease amino acid oxidation, reduce body fat deposition and thereby allowing increased protein deposition or known as protein-sparing effects (Nordrum et al. 2000; Davis et al. 1999).
3-1 Materials and methods Experimental design and diets
P. hypophthalmus juveniles, mean body weight of 1.8 g, were used in the feeding trial conducted in Fish Hatchery of Borneo Marine Research Institute, Universiti Malaysia Sabah, Kota Kinabalu, Sabah, Malaysia. They were acclimated and fed artificial diet commercially available for one week prior to feeding trial. Later, they distributed into twelve units of 100 L fiberglass tanks supplied with de-chlorinated water and aerated water, with twenty juveniles per tank and all tanks distributed in random arrangement of triplicate tanks per diet group. About 50% of total water was replaced daily at mid afternoon by new clean de-chlorinated water. During the experiment, water temperature and DO were between 29.4 – 31.1ºC and 6.15 – 7.98 mgL-1, respectively.
S. asotus juveniles, mean body weight of 5.63 g, were used in another feeding trial, which was conducted in Uragami Branch, Fisheries Laboratories, Kinki University. They were acclimated and fed artificial diet commercially available for two weeks prior to feeding trial. Later, they distributed into twelve units of 100 L PVC indoor tanks supplied with de-chlorinated water and aeration, with ten fish per tank. There were triplicate tanks per diet group, which all tanks distributed in random arrangement. About 60% of total water was replaced daily at mid afternoon by new clean de-chlorinated water. During the experiment, water temperature and DO were between 26.4 – 29.4ºC and 5.11 – 6.60 mgL-1, respectively.
At the end of feeding trial, all juveniles were sampled for analyzing the body indices, whole body proximate composition and fatty acid profiles. Experimental diets were also homogenized for proximate composition and fatty acid profile analysis.
P. hypophthalmus juveniles were fed twice daily to apparent satiation at 9:00 and 16:00 for 8 weeks. Experimental diets were formulated to contain about 35% crude protein and 15% crude lipid. Energy content was about 23.9 kJ g-1 in all diets. Lipid source in control PO diet is PO. For two test diets 2PO:MCT and PO:2MCT, the lipid sources are blends of PO and
The major ingredients are wheat flour, casein, fishmeal, α-starch and vitamin and mineral mixtures (Table 3.1).
S. asotus juveniles were fed twice a day as cited in the previous paragraph. Four experimental diets were formulated to contain 47% crude protein and 16% crude lipid. Energy content was about 23.2 kJ g-1 in all diets. The lipid source of control diet is PO. Other test diets 2PO:MCT, PO:2MCT and MCT were composed of the mixtures of PO and MCT at 2:1, 1:2 ratios, and a sole MCT, respectively. The major ingredients are casein, wheat flour, fishmeal, α-starch and vitamin and mineral mixtures (Table 3.1). The PO and MCT diets used for measuring apparent digestibility of fatty acids have similar dietary formulation as above, except the incorporation of 0.5 % chromic oxide as dietary inert marker.
Growth parameters, chemical and statistical analysis
Growth parameters and statistical analysis used in this study were similar as in Chapters 1 and 2. Fatty acid profiles of experimental diets used for P. hypophthalmus and S. asotus juveniles are shown in Tables 3.2 and 3.3, respectively. C8:0, C10:0 and C16:0 are main SFA in diets. As dietary MCT gradually increased in the diets, C8:0 and C10:0 levels also increased but C16:0 decreased gradually. C18:1n-9 of MUFA and C18:2n-6 of PUFA decreased with increasing MCT in the diets. All diets have similar n-3HUFA likely coming from FO in fishmeal. The n-3/n-6 ratio increased with increasing dietary MCT. DHA/EPA and EPA/ARA ratio are generally similar among the diets.
Proximate composition of diets and whole body were conducted by the same methods in previous chapter.
Apparent digestibility coefficient (ADC) of fatty acid was assayed by the method of Furukawa and Tsukahara (1966) using Cr2O3 as an inert marker.
of each fatty acid was multiplied by the weight of each fatty acid standard and expressed as mg/g.
mula and p ro xi ma te co m po sition o f the e xp er ime nta l diets f or striped ca tfish, P. h yp ophth a lmus a nd J ap an es e ca tf is h, S. ) P. h ypo ph th a lmus S. a sotus Diet Diet PO 2P O: M C T PO :2 M C T MCT PO 2P O: M C T PO :2 M C T MCT 20 9 209 20 9 209 370 370 370 370 12 8 128 12 8 128 150 150 150 150 13 0 86 44 0 130 86.5 43.5 0 0 44 86 130 0 43.5 86.5 130 30 0 300 30 0 300 180 180 180 180 80 80 80 80 50 50 50 50 50 50 50 50 50 50 50 50 50 50 50 50 50 50 50 50 53 53 53 53 20 20 20 20 n, g k g -1 34 2 344 35 7 356 469 472 456 471 15 6 154 16 1 157 162 155 160 163 53 54 54 53 56 62 58 58 35 6 366 35 2 366 308 292 329 320 ) 24 .28 24.1 3 23 .72 23.65 23.51 23 .26 23 23.08 Fu ji
Oil Co. Ltd., Osak
a, Jap an Ltd., Osa ka, Ja pan (m g/ 10 0g ): T hi am in e HC l 6, R ib ofl avi n 20 , Py ri do xi ne HC l 4, N iaci n 80 , C al ci um pant ot he nat e 28, I no si to l 40 0, Bio tin 0.6, Fo lic acid 1.5, aci d 40 , C hol in e chl ori de 80 0, Asc or bi c aci d 20 0, a-T ocophe rol 40, M enadi one 4, Activated 7-de hydroc holesterol 0. 00 45 , Cyan ob alam in 0 .06
Table 3.2 Fatty acid profiles (mg/g dry diet) of diets for striped catfish, P. hypophthalmus juveniles Diet PO 2PO:MCT PO:2MCT MCT 8:0 0.18 24.8 52.74 80.89 10:0 0.06 17.28 37.22 54.62 12:0 0.75 0.51 0.35 0.15 14:0 2.24 1.84 1.65 1.06 16:0 49.88 35.78 22.53 5.79 17:0 0.1 0.07 0.06 0.04 18:0 5.56 4.23 2.67 1.22 20:0 0.44 0.31 0.18 0.03 22:0 0.14 0.09 0.09 0.03 Total SFA1 59.35 84.9 117.47 143.83 16:1 0.87 0.84 0.78 0.77 18:1n-9 70.05 48.61 27.57 2.98 20:1 0.93 0.48 0.41 0.44 22:1 0.17 0.24 0.4 0.41 Total MUFA2 72.02 50.16 29.16 4.6 18:2n-6 21.49 16.21 11.13 5.08 18:3n-3 0.42 0.33 0.33 0.32 18:4n-3 0.18 0.17 0.19 0.23 20:4n-6 (ARA)3 0.05 0.04 0.06 0.06 20:5n-3 (EPA)4 1.57 1.41 1.63 1.94 22:5n-3 0.24 0.24 0.25 0.41 22:6n-3 (DHA)5 1.09 0.83 0.97 1.23 Total PUFA6 25.03 19.24 14.57 9.27 Total n-3 3.49 2.98 3.38 4.13 Total n-6 21.54 16.26 11.19 5.14 n-3/n-6 0.16 0.18 0.3 0.8 DHA/EPA 0.69 0.59 0.6 0.63 EPA/ARA 31.4 35.3 27.2 32.3 Total FA 156.4 154.3 161.2 157.7
Table 3.3 Fatty acid profiles (mg/g dry diet) of diets for Japanese catfish, S. asotus juveniles Diet PO 2PO:MCT PO:2MCT MCT 8:0 1.49 26.24 56.25 84.07 10:0 0.98 17.5 39.62 56.57 12:0 0.48 0.38 0.32 0.21 14:0 2.2 1.79 1.49 0.99 16:0 48.75 33.79 18.61 4.45 17:0 0.11 0.07 0.05 0.08 18:0 5.36 3.8 2.26 0.98 20:0 0.41 0.33 0.19 0 22:0 0.11 0 0 0 Total SFA1 59.9 83.91 118.8 147.34 16:1 1.02 0.91 0.85 0.77 18:1n-9 70.31 47.17 22.82 2.25 20:1 0.53 0.36 0.38 0.32 22:1 0.51 1.32 1.28 2.01 Total MUFA2 72.37 49.76 25.33 5.35 18:2n-6 21.27 14.91 8.25 2.69 18:3n-3 0.4 0.33 0.26 0.20 18:4n-3 0.2 0.2 0.2 0.18 20:4n-6 (ARA) 0.05 0.04 0.04 0.06 20:5n-3 (EPA) 2.13 2.12 1.92 1.91 22:5n-3 0.34 0.37 0.42 0.45 22:6n-3 (DHA) 1.15 1.16 1.08 1.02 Total PUFA3 25.53 19.12 12.18 6.5 Total n-3 4.22 4.17 3.88 3.75 Total n-6 21.31 14.95 8.29 2.75 n-3/n-6 0.2 0.28 0.47 1.36 DHA/EPA 0.54 0.55 0.56 0.53 EPA/ARA 42.6 53.0 48.0 31.8