JAIST Repository
https://dspace.jaist.ac.jp/
Title
Desorption of Hydrogen from the Steps on the Miscut Si(111) Surface Studied by SFG
Spectroscopy
Author(s) Mizutani, Goro; Yong, Zhipeng; Khuat, Thi Thu Hien; Rutt, Harvey N.
Citation e-Journal of Surface Science and Nanotechnology, 18: 180-184
Issue Date 2020-05-07
Type Journal Article
Text version publisher
URL http://hdl.handle.net/10119/16246
Rights
Goro Mizutani, Zhipeng Yong, Khuat Thi Thu Hien, Harvey N. Rutt, e-Journal of Surface Science and Nanotechnology, 18, 2020, pp.180-184.
DOI:10.1380/ejssnt.2020.180. All articles published on e-J. Surf. Sci. Nanotechnol. are licensed under the Creative Commons Attribution 4.0 International (CC BY 4.0). You are free to copy and redistribute articles in any medium or format and also free to remix, transform, and build upon articles for any purpose (including a commercial use) as long as you give appropriate credit to the original source and provide a link to the Creative Commons (CC) license. If you modify the material, you must indicate changes in a proper way.
e-Journal of Surface Science and Nanotechnology 18, 180−184 (2020)
Desorption of Hydrogen from the Steps on the Miscut
Si(111) Surface Studied by SFG Spectroscopy
Goro Mizutani,
a, †Zhipeng Yong,
aKhuat Thi Thu Hien,
aHarvey N. Rutt
ba School of Materials Science, Japan Advanced Institute of Science and Technology, 1-1 Asahidai, Nomi, Ishikawa 923-1292, Japan b School of Electronics and Computer Science, University of Southampton, Southampton SO17 1BJ, U.K.
† Corresponding author: [email protected]
Received: 13 December, 2019, Accepted: 26 April, 2020, Published: 7 May, 2020
We used sum frequency generation (SFG) spectroscopy to study the desorption of hydrogen on the stepped Si(111) surface with a miscut angle of 9.5° toward the [1_1_2] direction in ultra-high vacuum. The terrace peak was observed at 2085 cm−1 and the vertical step mode of
dihydride was observed at 2098 cm−1 for the ssp-polarization (s-polarized SFG, s-polarized
visible, and p-polarized infrared light) combination. The intensity reduction of these two peaks was monitored directly as a function of time at sample temperatures of 593 K. The rate of reduction was faster for the step dihydride peak than for the terrace monohydride peak.
Keywords Optical sum frequency generation (SFG); Hydrogenated and stepped Si(111) sur-face; Dihydride; Desorption activation energy
I. INTRODUCTION
Silicon is excellent as a semiconductor material and has been widely used. The hydrogen terminated silicon (H-Si) single crystal is an important model system of adsorbed semiconductor surfaces. In device and sensor fabrication processes, a H-Si surface is first created before depositing ultra-thin functional films on it. Therefore, adsorption and desorption of hydrogen is very important in order to ensure the quality of ultra-thin films on Si [1].
There have been a number of studies of hydrogen desorption from Si(111) surfaces. It is generally known that the Si surface shows β1 and β2 peaks of H2 desorption in
TPD (temperature programmed desorption) spectra at around 783 and 673 K, respectively [2]. The order of de-sorption of this system was determined by isothermal desorption at various temperatures around and below these peak temperatures. Second order desorption of hydrogen was reported by Schulze et al. [3] on the H-Si(111)2 × 1 surface by TPD, and by Koeler et al. [4] and Wise et al. [5] on the H-Si(111) 7 × 7 surface by LITD (laser induced thermal desorption). They reported desorption energies from 2.5 to 2.73 eV. Desorptions with lower orders were reported by other researchers. Reider et al. [6] and Mao et al. [7] used SHG (optical second harmonic generation) and SFG (optical sum frequency generation), got the desorption order
of m = 1.5 at coverages lower than 0.05 ML and obtained a desorption energy of around 2.4 eV. Morita et al. observed H-Si(111)1 × 1 by STM (scanning tunneling microscopy) and found that the desorption order changes from 2 to 1 as the coverage decreases [8]. They reported a desorption energy of 2.89 eV for the √3 × √3 R30° structure of the Si(111) surface. Sattar et al. used combined SFG and SHG methods and found that the desorption order switches from second to first at a coverage around 0.18 ML [9−11].
These reports are mostly giving a consistent picture, but some are partly inconsistent with each other, especially about the assignment of the TPD desorption peaks. The β1
and β2 peaks in TPD spectra are commonly assigned to H2
desorption from monohydrides and higher hydrides, respec-tively [12]. However, Tsetseris et al. reported a DFT study that the desorption energy of 3H complex from the Si(111) surface with excess hydrogen is 1.8 eV [12], and it explains the behavior of the β2 peak. According to his model the β2
peak should show first order desorption as a function of the excess hydrogen coverage above 1 ML. He predicts surface vibrational S-H peaks at 2110 and 2154 cm−1. In contrast,
Kim et al. adsorbed deuterium (D) on the Si(113) surface and observed desorption of D2 by the TPD method [13]. The
β2 peak around 673 K shows second order kinetics as it is
judged from the analysis of the TPD curves, and the de-sorption energy is 2.16 eV. They suggested that this β2 peak
originates from dideuteride adatoms. During the D2 TPD
experiment these dideuteride adatoms are converted to monodeuteride adatoms below 723−773K and emit D2
molecules. Here, there is no consensus in the literature on the origins of β2 peak in the TPD spectra and more research
is necessary for better understanding of this H-Si(111) system.
In this context, we tried to make progress in realizing a direct observation of monohydride and dihydride hydrogen on a Si surface by the SFG method while desorption of hydrogen is taking place. Optical SFG used in this study is one of the second-order nonlinear optical processes. It is a conversion process of visible light of frequency ω1 and
infrared light of frequency ω2 into photons of sum frequency
ω1 + ω2. One feature of SFG spectroscopy is its symmetry
selection rule. It selects only non-centrosymmetric parts of the sample within the dipole approximation with respect to the interaction of light with matter. Its sensitivity to surfaces and interfaces is much better than one monolayer [14], although this depends on the material system. Another feature is that it provides excellent vibrational spectroscopic data, as one can get resonant vibrational spectra of adsorbed atoms or molecules on surfaces when the infrared frequency is scanned. Since SFG gives a direct signal from step dihydride, we should be able to clarify the variation of its number density as a surface phenomenon progresses.
In this study, we aim to put a first step leading to a direct and sensitive method to dynamically monitor the hydrogen on the terraces and steps on the Si(111) stepped surface. In our past papers by SFG we studied hydrogen desorption kinetics of a hydrogenated Si(111) surface [9, 11] and a polarization dependence of the SFG spectra of a hydrogen-ated and stepped Si(111) surface. In this paper we have used Si(111) surface with a miscut angle of 9.5° toward the [1_1_2] direction. Here, we note that the step dihydride as illustrated in Figure 1(b) can contribute to the β2 desorption peak. We
monitored the signals from the terraces and steps on the Si(111) stepped surface directly and separately by measuring the SFG spectrum of the surface after adsorbing hydrogen on the surface.
II. EXPERIMENT
A stepped n-type phosphorus-doped Si(111) wafer with resistivity of ~10 Ω cm was purchased from CrysTec GmbH with 9.5° miscut angle toward the [1_1_2] direction as sche-matically illustrated in Figure 1(b). The 20 mm × 5 mm × 0.1 mm samples for the measurement were cut from this wafer by a dicing saw (ACCRETECH A-WD-10B). Accord-ing to literature [15], this miscut on the Si(111) surface is expected to induce more than 70% of the surface area to have triple steps. In Figure 1(b) a part of a triple step is seen at the right end of the figure.
In order to control the atomic structure of the Si surface, the sample temperature was controlled by direct current heating. The largest current was up to 6 A when the sample was heated to 1273 K. First, the silicon plates with native
oxide layers were heated at 873 K for 6 h to remove impurities. Next, the Si sample was flash heated at 1273 K for 60 s to form a reconstructed structure of Si(111)7 × 7. Thereafter, the temperature of the Si sample was lowered to 873 K, and pure molecular hydrogen gas was introduced into the chamber with the pressure of 3.5 Torr [7]. Hydrogen was supplied through a stainless steel tube dipped in a liquid nitrogen cooled trap. By cooling the H2 gas at liquid
nitrogen temperature 77 K, the impurity (mainly water mol-ecules) in the gas was solidified so that high purity hydrogen was supplied into the chamber. There is a report that hydrogen adsorbs not only on the Si(111) face of the terrace but also on the step [13, 16−18]. After this adsorption treatment of about 15 min the sample was cooled down to room temperature. The SFG spectra were taken after the H-Si(111) surface was heated at 593 K repeatedly for each 10 s. The atomic structure of the Si surface was checked by LEED (OCI Vacuum Microengineering).
The optical setup of our SFG measurement was the same as that reported in our previous publication [9]. We used a Nd3+:YAG laser (EKSPLA PL2143B) combined with a
harmonic unit and OPG / OPA / DFG system (PG401/ DFG2-18P) as a light source with output light pulses of 30 ps width and 10 Hz repetition rate. The pulse energies of the IR and visible light were 100 and 10 μJ, respectively. The sample was irradiated with visible light of 532 nm and infrared light of 4700 to 4900 nm at the same timing and at the same position. SFG light was collected and focused on the entrance slit of a monochromator (JASCO CT-25CD) equipped with a photomultiplier (Hamamatsu R-585) and collection optics. The strong background of the two incident light beams was removed by using a dichroic mirror and a band pass filter in the collection optics. The electric signals
Figure 1: (a) Macroscopic and (b) microscopic structures of the hydrogenated stepped Si sample surface. I represents the heating current direction for sample cleaning and k|| represents the k-vector
from the photomultiplier recovered by a BOXCAR integra-tor and were sintegra-tored in a computer. Signals from 300 pulses were accumulated at each wavenumber.
III. RESULTS AND DISCUSSION
Figure 2 shows the LEED patterns of the Si(111) miscut surface before and after the molecular hydrogen exposure. In Figure 2(a), we see diffraction spots of 7 × 7 recon-structed structure of Si(111) terraces created by flash heating at 1273 K. The clear 7 × 7 structure indicates that the surface was clean before being exposed to molecular hydrogen. We also see streaks in the horizontal direction because of the periodic terrace and step structures. The center of the hexagonal 1 × 1 pattern is shifted from the center of the LEED screen. This is because of the miscut angle of the Si(111) substrate of 9.5°. In Figure 2(b), we see diffraction patterns of the 1 × 1 structure associated with streaks, but the 7 × 7 spots have disappeared due to the transition to 1 × 1 hydrogenated structure on the terraces. The intensity distribution in the streaks are consistent with the suggested triple step structure of our surfaces [19].
SFG intensity spectra for ssp-polarization (s-polarized SFG, s-polarized visible, and p-polarized infrared light) combination were obtained as a function of the IR wavenumber from 2060 to 2120 cm−1 in Figure 3. Two
peaks are seen at 2085 cm−1 (A) and 2098 cm−1 (C1) in the
spectra [16−18]. These peaks are assigned to monohydride (SiH) and vertical step dihydride (SiH2) modes, respectively,
as they are illustrated in Figure 1(b).
In order to measure the speed of desorption of terrace and step hydrogen, the ssp-SFG spectra were taken repeatedly after each 10 s heating at 593 K until the total heating time reached 600 s. Some of the SFG spectra obtained are shown in Figure 3. The black dots are experimental data and curves are the result of fitting. In Figure 3, we see that the SFG intensities of the two peaks gradually reduce over time. These two peaks were separated by fitting the function [20],
|𝜒𝜒SFG|2= �𝜒𝜒NR+ 𝐴𝐴1𝑒𝑒𝑖𝑖𝜃𝜃1 𝑥𝑥 − 𝜔𝜔1+ 𝑖𝑖𝛾𝛾1+ 𝐴𝐴2𝑒𝑒𝑖𝑖𝜃𝜃2 𝑥𝑥 − 𝜔𝜔2+ 𝑖𝑖𝛾𝛾2� 2 ,
to the observed SFG intensity under the constraint of |𝜃𝜃1− 𝜃𝜃2| < 0.2 and the separated peak intensities of the
two modes are plotted in Figure 4. Here we note that the asymmetry of the A peak at t = 0 s is reproduced well by the calculation and so it is because of the overlapping Lorentzian responses of the two oscillators. From both Figures 3 and 4, the step mode intensity is seen to approach zero faster than the terrace mode intensity. A similar result with a faster desorption rate was obtained for the sample temperature of 673 K (not shown).
Miyauchi et al. once reported a red-shift of the A peak of Si-H vibration on a H-Si(111) surface without miscut by 2 cm−1 during the hydrogen desorption [21]. Unfortunately, in
Figure 3, we could not reduce the statistical errors to recognize this shift. Miyauchi et al. also reported an increase of the widths of the A peaks at lower coverage [21]. Unfor-tunately, we could not recognize a systematic change of the widths of the A or C1 peaks as a function of the desorption
time.
Figure 2:LEED patterns of hydrogenated and stepped Si(111) surfaces with a miscut angle of 9.5° toward the [1_1_2] direction showing (7 × 7) (left) and (1 × 1) (right) surfaces before and after hydrogen adsorption.
Figure 3: SFG spectra of the hydrogenated and stepped Si(111) surface with a miscut angle of 9.5° toward the [1_1_2] direction in the ssp-polarization at various elapsed times for the heating tem-perature of 593 K (A and C1 peaks).
The results in this study should be compared with the work by Kim et al. mentioned in Section I [13]. In the study by Kim et al. crystalline Si(111) is miscut by 29.5° in the [ 1_1_2] direction, while our sample is Si(111) with 9.5° miscut in the same direction. So, the step edge lines run in the same crystallographic directions in the two samples. The A peak at 2085 cm−1 in Figure 3 is the vibration of H on the terrace Si
adatom, and this hydrogen contributes to the β1,ad TPD peak.
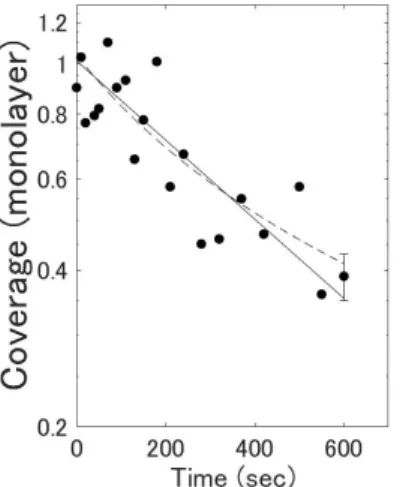
Therefore, the peak A is expected to show second-order desorption. Figure 5 shows the coverage of hydrogen on a logarithmic scale obtained from the A peak intensities in Figure 4 as a function of the heating time. Here, we used the result by Miyauchi et al. for the H-Si(111) case without steps and converted the peak intensities to coverage under the effect of the dipole-dipole interaction [21−23]. Both the solid exponential curve corresponding to the first order desorption and the dashed curve of a function 1 (𝑎𝑎𝑎𝑎 + 𝑏𝑏)⁄ corresponding to the second order desorption can explain the coverage change, and we cannot deduce the desorption
order from our experiment. Based on the previous papers [3−5, 13], we guess that the A peak should follow the second order kinetics.
The C1 peak at 2098 cm−1 is the vibration of H on the step
Si. In the past literature researchers do not give any view as to whether this step hydrogen should contribute to β1 or β2
TPD peak. In Figure 4, the intensity of the C1 peak at 2098
cm−1 approaches zero faster than that of peak A at 2085 cm−1.
In Figure 6, we plotted the SFG intensity of the C1 peak on a
logarithmic scale as a function of heating time. We also drew fitted curves of first order desorption corresponding to an exponential decay (a solid line) and second order desorp-tion corresponding to a decay as the funcdesorp-tion 1 (𝑎𝑎𝑎𝑎 + 𝑏𝑏)⁄ 2
(a dashed line). Here the dipole-dipole interaction between step hydrogen atoms or between step and terrace hydrogen atoms is not considered for the following reason. The dipole-dipole interaction between the terrace Si-H and step Si-H2 bonds may not be negligible for higher coverage of
hydrogen. The dipole-dipole interaction between step Si-H2
bonds is probably weaker because their number density is smaller. On the other hand, in Figure 6, the two theoretical curves give a big difference for the time greater than 300 s. For this time regime the dipole-dipole interaction is proba-bly negligible because the number densities of both the terrace and step hydrogen are small. Hence, we did not consider the dipole-dipole interaction in analyzing Figure 6. Still, since there is a big error in the SFG intensity at very large times, the time variation of the C1 peak intensity at
2098 cm−1 cannot be judged to be either first or second
order.
The reason for the faster speed of approach to zero of the C1 SFG peak intensity might be two-fold. If the desorption
of the C1 mode is of first order, this desorption order itself is
the reason. The C1 SFG intensity should reduce as an
exponential function, while the A peak intensity should reduce as the function 1 (𝑎𝑎𝑎𝑎 + 𝑏𝑏)⁄ 2. Then, the intensity of
the C1 peak should approach zero faster after a sufficiently
long time.
Figure 4:SFG intensity of monohydride (A) and dihydride (C1) as
a function of time.
Figure 5: Coverage of terrace hydrogen calculated from the A mode intensity on a logarithmic scale vs. total heating time. The solid line indicates a best fit theoretical line for first order desorp-tion and the dashed curve indicates a best-fit theoretical curve for second order desorption.
Figure 6:Step C1 mode SFG intensity on a logarithmic scale vs.
total heating time. The solid line indicates a best fit theoretical line for first order desorption and the dashed curve indicates a best-fit theoretical curve for second order desorption.
If the desorption of the C1 mode is in second order, the
desorption energy from the step dihydride should be smaller than that of the terrace monohydride. Our desorption experi-ment at 673 K (not shown) gave a desorption rate constant around 45 times larger than that observed in Figure 6. This rate constant difference corresponds to a desorption activa-tion energy of around 1.6 eV. So, we can roughly say that the desorption activation energy of the step hydrogen is smaller than that for the terrace hydrogen, since the latter is said to be around 2.5 eV.
According to Kim et al the β2 TPD peak is due to excess
hydrogen, but this is not necessarily consistent with the assignments by other researchers [2]. Some other papers argue that it is due to CH2 on defect sites on the Si surface
[5]. SFG should have an advantage over TPD as a method for monitoring separately the desorption of hydrogen of different species. The assignment of the β2 TPD peak can be
determined more clearly if the desorption is measured in more detail by SFG than in the current work. Additionally, one can plan to carry out experiments at various tempera-tures and obtain the activation energies of the desorption more systematically. The study in this paper is intended as the first step for that future development.
IV. CONCLUSIONS
In this study, we used sum frequency generation (SFG) spectroscopy to monitor the desorption of hydrogen from the stepped Si(111) surface with a miscut angle of 9.5° toward [1_1_2] direction. The hydrogen was adsorbed by molecular dosing at a surface temperature of 873 K. One terrace peak at 2085 cm−1 and another at 2098 cm−1 are
assigned to the vertical step mode of dihydride, observed in the ssp-polarization. The SFG spectrum of the Si-H surface as a function of heating time at 593 K was obtained. The step peak intensity approached zero faster than the terrace peak intensity.
Acknowledgments
This work was supported by JSPS KAKENHI Grant Number JP15K05126.
Note
This paper was presented at the 12th International Symposium on Atomic Level Characterizations for New Materials and Devices ’19 (ALC ’19), in conjunction with the 22nd International Conference on Secondary Ion Mass Spectrometry (SIMS-22), Miyako Messe, Kyoto, Japan, 20−25 October, 2019.
References
[1] A. Vilan, O. Yaffe, A. Biller, A. Salomon, A. Kahn, and D. Cahen, Adv. Mater. 22, 140 (2010).
[2] P. Gupta, V. L. Colvin, and S. M. George, Phys. Rev. B 37,
8234 (1988).
[3] G. Schulze and M. Henzler, Surf. Sci. 124, 336 (1983). [4] B. G. Koehler, C. H. Mak, D. A. Arthur, P. A. Coon, and S. M. George, J. Chem. Phys. 89, 1709 (1988).
[5] M. L. Wise, B. G. Koehler, P. Gupta, P. A. Coon, and S. M. George, Surf. Sci. 258, 166 (1991).
[6] G. A. Reider, U. Höfer, and T. F. Heinz, J. Chem. Phys. 94,
4080 (1991).
[7] M. Y. Mao, P. B. Miranda, D. S. Kim, and Y. R. Shen, Phys. Rev. B 64, 035415 (2001).
[8] Y. Morita, K. Miki, and H. Tokumoto, Surf. Sci. 325, 21 (1995). [9] Md. A. Sattar, K. T. T. Hien, Y. Miyauchi, G. Mizutani, and H. N. Rutt, Surf. Interface Anal. 48, 1235 (2016).
[10] K. T. T. Hien, M. A. Sattar, Y. Miyauchi, G. Mizutani, and H. N. Rutt, Surf. Sci. 663, 11 (2017).
[11] K. T. T. Hien, Y. Miyauchi, M. Kikuchi, and G. Mizutani, Surf. Interface Anal. 44, 662 (2012).
[12] L. Tsetseris and S. T. Pantelides, Phys. Rev. B 74, 113301
(2006).
[13] H. Kim, T. Spila, and J. E. Greene, Surf. Sci. 490, L602
(2001).
[14] P. Guyot-Sionnest, J. H. Hunt, and Y. R. Shen, Phys. Rev. Lett.
59, 1597 (1987).
[15] J. Wei, X.-S Wang, J. L. Goldberg, N. C. Bartelt, and E. D. Williams, Phys. Rev. Lett. 68, 3885 (1992).
[16] P. Jakob and Y. J. Chabal, J. Chem. Phys. 95, 2897 (1991). [17] M. Morin, P. Jakob, N. J. Levinos, Y. J. Chabal, and A. L. Harris, J. Chem. Phys. 96, 6203 (1992).
[18] M. A. Hines, Y. J. Chabal, T. D. Harris, and A. L. Harris, Phys. Rev. Lett. 71, 2280 (1993).
[19] K. T. T. Hien, Z. Yong, G. Mizutani, and H. N. Rutt, to be published.
[20] Y. R. Shen and V. Ostroverkhov, Chem. Rev. 106, 1140
(2006).
[21] Y. Miyauchi, H. Chuat, and G. Mizutani, Surf. Sci. 614, 24
(2013).
[22] E. H. G. Backus and M. Bonn, Chem. Phys. Lett. 412, 152
(2005).
[23] M. Cho, C. Hess, and M. Bonn, Phys. Rev. B 65, 205423
(2002).
All articles published on e-J. Surf. Sci. Nanotechnol. are licensed under the Creative Commons Attribution 4.0 International (CC BY 4.0). You are free to copy and redistribute articles in any medium or format and also free to remix, transform, and build upon articles for any purpose (including a commercial use) as long as you give appropriate credit to the original source and provide a link to the Creative Commons (CC) license. If you modify the material, you must indicate changes in a proper way.

![Figure 2: LEED patterns of hydrogenated and stepped Si(111) surfaces with a miscut angle of 9.5° toward the [1 _ 1 _ 2] direction showing (7 × 7) (left) and (1 × 1) (right) surfaces before and after hydrogen adsorption](https://thumb-ap.123doks.com/thumbv2/123deta/6082574.1074381/4.892.472.833.766.1059/figure-patterns-hydrogenated-surfaces-direction-surfaces-hydrogen-adsorption.webp)