Efficiency Measurements in the Turkish Brewing Industry by Using Data Envelopment Analysis
著者 イルハン エザン アイクット
著者別表示 Ilhan Ezan Aykut journal or
publication title
博士論文本文Full 学位授与番号 13301甲第4473号
学位名 博士(経済学)
学位授与年月日 2016‑09‑26
URL http://hdl.handle.net/2297/46495
Creative Commons : 表示 ‑ 非営利 ‑ 改変禁止 http://creativecommons.org/licenses/by‑nc‑nd/3.0/deed.ja
Efficiency Measurements in the Turkish Brewing Industry by Using Data
Envelopment Analysis
Ezan Aykut Ilhan 1321072001
Graduate School of Human and Socio-Environmental Studies Department of Economics
Kanazawa University
This dissertation is submitted for the degree of Doctor of Philosophy
i
ABSTRACT
トルコの醸造業は未だに研究者による研究が完全には行われていない領域である。生産効率評 価にデータ包絡分析 (簡略化するとDEA) を用いることが、この産業に対する新たなアプロー チとなる可能性がある。この研究の動機づけとなったのは、トルコの醸造企業における生産効 率評価に各使用者に特化したモデルによるDEAを用いることによる、新たな手法の構築の模索 である。
トルコの醸造業は政府による独占から、民間企業の複占へと変遷してきた。近年では新規の事 業者はなく、マーケットシェアにおける大きな変動もない。このマーケットは新たな顧客の需 要に対しては飽和していると結論付けることができる。その上、政府による度重なる禁止措置 や規制により、新規参入者にとっては不利な事業環境となっている。そのため、この産業集中 の状態にあっては、生産効率の問題が重要となる。トルコの醸造業は複占企業による立場の違 いが明確である。アナドル・エフェスが最大手であり、トルコ・ツボルグがそれに続き、それ ぞれマーケットシェアのおおよそ80%と20%を占める。本研究では、マーケットシェア、企業 規模ならびにDEA効率得点の相関の考察を行う。我々はDEAを使用することにより、回帰分 析等の他の従来の手法では十分に解明することができない潜在的な事実や結果を得た。
今回の手法として用いた各使用者に特化したモデルは、様々な研究者が以前に行った研究から 適合させたか、または、DEA条件に相応な研究者の設計によるものである。これらのモデルに は様々な目的や制約が反映されている。入力及び出力の選定基準はこれらの目的に大きく依存 する。主なデータソースとして、利用可能な企業レベルの財務諸表及び比率を使用している。
財務諸表データは信頼性が高く、すべての利害関係者や研究者が追跡できる点から有用である と考えられる。
本研究の結果、トルコの醸造企業は、売上高ならびに収益の創出、株式市場における取引また は生産要素の割当を目的として自らの資産および負債を活用している点で、高い生産効率を示 している。トルコ・ツボルグは6から7のビール製造工場で必要な最小効率規模 (MES) に達 していないにもかかわらず、生産可能性辺境線上で操業している。集権的組織構造ならびに高 級製品ラインへの特化がツボルグの効率得点が満点である理由であるとの結論に至った。対し てアナドル・エフェスは、その規模の大きさをより効率の良い営業へと生かすことができてい ないように見える。アナドル・エフェスはトルコ以外の他国に工場を所有し、コカコーラの独 占販売頒布権も保有している。大規模でありながら、非集権的な組織構造であることが高い生 産性を維持しての操業を困難なものとしている。
本実証研究の2つ目の部分では、ヨーロッパ市場におけるトルコの醸造企業のDEA効率評価を 行っている。トルコ・ツボルグは効率得点が満点である一方で、アナドル・エフェスは平均的 な得点で順位も中程度となっている。ヨーロッパの醸造企業のDEA得点では、ビール製造最大 手のアンハイザー・ブッシュ・インベブが効率得点が満点であり、生産可能性辺境線上で操業 している。アンハイザー・ブッシュ・インベブが大規模であり効率得点が高いことと、トル コ・ツボルグが小規模であり効率の良い操業を行っていることとは相反する。このため、市場 規模とDEA効率得点の相関を明らかにすることが未解明の今後の課題として残ることになる。
本研究の結論として、DEAは生産効率を評価するさいの他とは異なる有効な手法であることが 明らかとなった。しかし、明らかになったのは相対的に効率の良い意思決定組織までであり、
絶対的に効率の良い組織までには至らない。トルコ・ツボルグはトルコとヨーロッパのいずれ の醸造業界においても完全な効率を示し、その結果はほぼ精確であると言える。企業の内部デ
ii
ータを使用すればより精度の高いDEA結果を得られたものと考えられる。しかしながら、これ らの情報は企業内の機密となっている。DEA条件下で各使用者に特化したモデルを用いた今回 の研究手法が生産効率結果を明らかにする新たな手法であることを我々は強調したい。また、
本研究の手法はデータソースが利用できるあらゆる業界の分析にも活用することが可能である
。
Turkish brewing industry is a field that has not been studied yet thoroughly by researchers.
Especially using Data Envelopment Analysis (abbreviated as DEA for the easiness) may be a new approach to this industry for productive efficiency measurements. My motivation in this research is to create a new process by applying DEA with user-specific models for the productive efficiency measurements in the Turkish brewing industry.
Turkish brewing industry has evolved from a government made monopoly to duopoly by private entities. Recently there are no new entries and significant fluctuations in the industry. We conclude that the market is saturated to new customer demands. Furthermore, frequent bans and regulations by the government created a hostile business environment to the new entrants.
Therefore, productive efficiency issues take an important place for the industry concentration.
Turkish brewing industry has well-decided roles of the duopoly companies. Anadolu Efes is the leader, and Turk Tuborg is the follower with around 80 and 20 percent market shares respectively.
In this research, we study the relationship between market shares, company sizes and DEA efficiency scores. We use DEA to find out some hidden facts and results that other well-known methods like regression analysis are insufficient to reveal.
In our approach, we execute user-specific models either adapted from earlier studies of various scholars or designed by the researcher suitable to DEA assumption. These models reflect different purposes and constraints. The selection criteria of inputs and outputs highly depend on these purposes. As main data source, we prefer accessible financial statements and ratios at the corporate level. We favor financial statement data would be reliable, and trackable by any stakeholders or researchers.
Our results show that the Turkish brewing industry has highly productive efficient companies in the way they use their assets and liabilities to generate sales and revenues, trade in the stock market or allocate factors of production. Turk Tuborg is operating on the production frontier eventhough it does not reach the required minimum efficient scale (MES) of six to seven plants for beer production. We conclude centralized organization structure and concentration on the premium product line, are the reasons for Tuborg’s full efficient scores. On the contrary, Anadolu Efes does not seem to turn its bigger scale into more efficient operations. Anadolu Efes has factories in other countries besides Turkey, and exclusive rights of selling and distribution of
iii
Coca-Cola. Its bigger scale, and decentralized organization structure makes it harder to maintain high productive efficiencies in operations.
At the second part of our empirical studies, we conduct DEA efficiency measures of Turkish brewers within the European market. Turk Tuborg has still full efficiency scores while Anadolu Efes occupies a moderate position with average scores. According to DEA scores for the European brewing industry, the largest beer company ABInbev has full efficiency scores, and it operates on the frontier. ABInbev’s big scale and full efficient scores contradicts to Turk Tuborg’s smaller scale and full efficient operations. Therefore, finding the relationship between the market sizes and DEA efficiency scores remains an uncompleted task for further studies.
We conclude that DEA is a unique and competent method in conducting productive efficiencies. However, we can at most find out relatively efficient decision-making units rather than absolutely efficient ones. Turk Tuborg is fully efficient both in Turkish and European brewing industries, which is closer to precision. We assume, by using internal corporate data, DEA results would be have been more accurate. However, this kind of information is kept discrete inside the companies. We claim the methodology of this research applying user-specific models under DEA assumption, is a new approach to discover productive efficiency results.
Moreover, the method of this research can be applied by an analyst to any industry with accessible data sources.
iv
ACKNOWLEDGEMENTS
I would like to express deepest appreciation to Professor Maeda Takashi, who has the attitude and substance of a supportive and intellectual supervisor. He consistently conveyed a sipirit of gratitude in regard to research and scholarship and an excitement in teaching. Without his guidance and persistent help this dissertation would not have been possible.
I would like to thank my committee members Takeshima Sadaharu and Hoshino Nobuaki,whose work demonstrated to me that concern for global affairs supported by an engagement in social sciences provides a guest for me.
I would like to express gratitudeto to all my teachers who put their faith on me and urged me to do better.
v
LIST OF CONTENTS
INTRODUCTION 1
CHAPTER
1 BACKGROUND OF THE TURKISH BREWING INDUSTRY 5
1.1 INDUSTRY BACKGROUND 5
1.1.1 PHASE 1 - GROWTH AND COMPETITION 6
1.1.2 PHASE 2 - MARKET MATURITY 10
1.1.3 PHASE 3 - EFES' PLANS AND NEW REGULATION 10 1.1.4 PHASE 4 - IMPORT BRANDS AND M&A'S 13
2 CURRENT SITUATION OF THE TURKISH BREWING INDUSTRY 15
2.1 INDUSTRY STRUCTURE 15
2.2 TURKISH BREWING INDUSTRY UNDER SWOT ANALYSIS 21
3 DATA ENVLOPMENT ANALYSIS 26
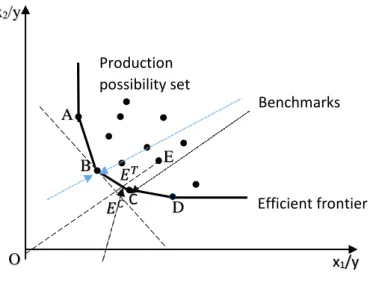
3.1 THE DEFINITION 26
3.2 THE TERMINOLOGY IN DATA ENVELOPMENT ANALYSIS 27 3.3 GRAPHICAL ILLUSTRATION OF DEA CONCEPT 28
3.4 MATHEMATICAL FOUNDATION OF DEA 33
3.5 EXTENSIONS OF DATA ENVELOPMENT ANALYSIS 37
3.5.1 SLACK-BASED MODEL 37
3.5.2 MEASURE SPECIFIC MODEL 40
3.5.3 RETURNS TO SCALE 42
3.5.4 ADDITIVE MODEL 44
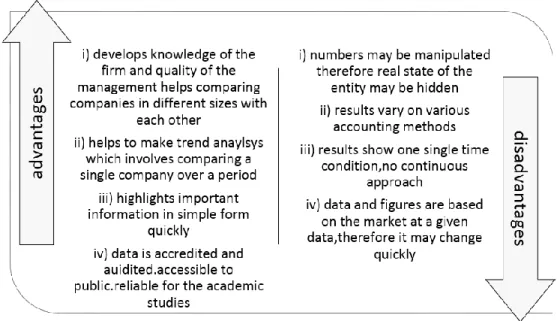
3.6 ADVANTAGES AND DISADVANTAGES OF DEA 47
3.7 DEA STUDIES IN BREWING INDUSTRIES-LITERATURE REVIEW 49
3.8 LIMITATIONS OF THE RESEARCH 52
4 MODELS USED IN DEA EFFICIENCY MEASUREMENTS 53
4.1 TWO STAGED PROFITABILITY - MARKETABILITY MODEL 53
4.2 PRODUCTIVITY MODEL 54
4.3 SUGGESTED MODELS FOR FURTHER STUDIES 55
5 DATA AND ISSUES 63
5.1 PREPARING THE DATA 63
5.2 SOURCES OF THE DATA 65
5.3 COLLECTION AND ORGANIZATION PROCESS OF FINANCIAL VARIABLES 70
vi
6 DEA WINDOW ANALYSIS APPROACH IN TURKISH BREWING INDUSTRY 74
6.1 MATHEMATICAL FOUNDATION 74
6.2 DEA WINDOW ANALYSIS IN TURKISH BREWING INDUSTRY 76 7 A COMPARATIVE APPROACH TO EUROPEAN BREWING INDUSTRY 100 7.1 THE STRUCTURE OF THE EUROPEAN BREWING INDUSTRY 100 7.2 DEA EFFICIENCY MEASUREMENTS OF THE EUROPEAN BREWING 104 INDUSTRY
CONCLUSIONS 116
BIBLIOGRAPHY 121
APPENDIX 125
1
Introduction
This research is application of a specific methodology called Data Envelopment Analysis (DEA) on the Turkish brewing industry. My motive in this research concentrates on two issues:
Turkish brewing industry and DEA.
The brewing industry is a suitable field for researches in many disciplines. Jim Mc Grevy, the president and CEO of Beer Institute stated: “Beer is more than our nation’s favourite adult drink it is a powerhouse in job creator, commercial activity, and tax revenue”. We identify the reasons of our motive for studying the brewing industry as follows: 1.Beer is a recession proof and a normal product, 2.Relationships among players are well defined and clear, 3.The brewing industry is not complicated, further than that relatively easy industry to study, 4.The brewing industry is highly regulated .80-90 percent of the data is trackable down.
Turkish brewing industry satisfies certain criteria to be the main field of our research. The industry started as a monopoly, turned into an oligopoly and finally became a duopoly.
Government intervention is high and frequent through bans, regulations and licencing. The market is saturated because Islamic abolition limits total customer demand for the alcoholic beverages.
Turkish beer industry occupied as monopolistic market situation, from 1934 to 1968.
During these 34 years, government’s monopoly company, Tekel did not gain big access within the country. After a new regulation in 1969 allowed new firms for the market entry, Turkish Efes, and Denmark’s Tuborg became the new competitors of Tekel. These two companies quickly captured big market shares in the industry. The market moved from a monopolistic structure to duopoly. The evidence supports that Efes became an industry leader with its marketing success and wider access. Efes’ follower, Tuborg mainly focused on the residual demand of Efes'.
A new regulation in 1973 made a significant impact on the market. According to this regulation, under 4.2 percent of alcohol content of beer could be sold as a social beverage rather than an alcoholic drink. It was the main factor for the rapid growth of Efes. However, a new regulation in 1983 made negative impact over the companies. All broadcast and media advertising was banned and licencing became stricter. From 1983’ regulation to today, the industry had been moving in a flagrant pace. Anadolu Efes and Turk Tuborg, dominate the industry with over 95 percent combined market share.
2
Regarding Fisher’s statement Efes and Tuborg both suffered from bans and regulations more than external economic conditions[19]. The capture theory associated with Stigler (1971)[42] and Peltzman (1976)[35] states that industry performance is positively affected when regulations emerge as a reply to the industry demand. This demand for regulation is crucial in imperfectly competitive industries like beer. The government help sustains market coordination.
Recently, Efes and Tuborg produce more than 40 brands including import beers with exclusive rights. Three brands: Efes, EfesXtra, and, Tuborg capture 88 percent market share.
There seems no compelling way to argue that with the rise of Islamic view and conservative wing on the government side it has been harder for brewers to succeed. Both companies reduced the risks of dependency on the Turkish market by exporting overseas.
In Turkish brewing industry competition, roles of duopoly companies are clear and well defined. Anadolu Efes is the market leader, and Turk Tuborg is the follower in a Stackelberg competition. Because of the bans on broadcast media and other tools, there are no significant opportunities for expansion locally. Moreover, we do not examine predatory advertising for companies to capture from each other’s customer base. All these factors led Turkish brewing companies focus on efficiency issues rather than competitive strategies.
Data Envelopment Analysis is a non-parametric linear programming method applied to observational data that provides a new way of obtaining empirical estimates on the performance of various entries. Comparing to other well-known methods like regression analysis and stochastic frontier, DEA deals with best practices rather than the averages. In addition to this fact, there is no requirement for a priori assumption in the functional form. For these reasons we assume DEA would be a suitable method for our research. DEA reveals hidden facts that other methods are not able to and helps us finding inefficient units. Therefore, we predict with the sufficient management support and transfer of expertise these inefficient units can be improved.
Recently, Data Envelopment Analysis approach is becoming more preferable, because no company can handle the expense of having inefficient units. In this research, the DEA scores are conducted for productive, technical, pure, managerial, scale, allocative, cost and overall efficiencies. These efficiency terms help us to evaluate Turkish brewing industry by using Data Envelopment Analysis. According to the scores we conduct, we are able to comprehend clearly if the companies are efficient or not. After we identify inefficient units, we show insights to the companies for improvement with the sufficient management support and expertise. We also have motivation in finding relationships with the efficiency scores and different parameters like market size.
3
Previous studies on the Turkish brewing industry mainly focused on strategic and marketing approaches. A.Hamdi Demirel and Fred Miller et al. (1983)[21] examined Turkish beer market regarding the firms’ competitive strategies. Their work separated Turkish brewing industry into regimes shaped by the government regulations and bans. They studied the success of Efes as the market leader at the main interest. Several lessons were taken from this study for marketing consumer goods like beer in developing countries. Another study was made by Cemhan Ozguven as a thesis of his graduate course et al.(2004)[9]. This thesis examined demand and pricing policies in Turkish beer market and whether these policies were efficient or not. This research uses a new approach to the Turkish brewing industry: we prefer a DEA efficiency- oriented approach, rather than strategic or marketing approaches mentioned above.
This research is organized as follows: Chapter 1 is the background of the Turkish brewing Industry, which transformed from a government made monopoly into a duopoly. The first chapter describes the factors behind this transition and the success of the two companies. In this chapter, we also analyze how the government interventions affected the entire industry through bans and regulations and how the companies responded. Chapter 2 is the analysis of Turkish beer industry in recent market circumstances. First, we introduce the external conditions surrounding both players, then we use an insider look to understand both companies’
characteristics. Chapter 3, introduces Data Envelopment Analysis (DEA) concept. Data Envelopment Analysis abbreviated as DEA (for the easiness) had been widely used since 1978 to evaluate efficiency measures of organizations called “Decision Making Units” After an introduction and graphical explanation of DEA, we describe mathematical foundations and the models used in this research. At the end of Chapter 3, we classify the advantages and disadvantages of DEA and introduce the kind of questions an analyst can answer with DEA method. Finally, we discuss the limitations we encounter during the research. In Chapter 4, we introduce the models employed in DEA measurements. The beginning of Chapter 4 introduces a two-staged model of Profitability and Marketability. This approach is inspired by works of various scholars (mainly in banking). We introduce additional models to conduct DEA efficiency results for the industry regarding factors of production, marketing, scope and, scale and technical capacity usage. Chapter 5, addresses the sources and the preparation process of data. This chapter also gives a brief introduction to the financial statements and financial ratios. In Chapter 6, we conduct DEA efficiency results for the Turkish brewing industry using a sub-approach called Window Analysis. A time series analysis is required to evaluate DMUs over multiple time periods, thus DEA Window Analysis is used. This model was developed by G.Klopp et al. (1985)[22]
who was using these techniques in his job for the U.S. Army. We use two staged profitability-
4
marketability model and productivity model in DEA efficiency evaluations. We also identify, relationship between the market size and efficiency scores. At the end of Chapter 6, we summarize the results and give further suggestions for the improvements and projections. Finally, Chapter 7 answers the question how efficient Turkish brewing companies operate comparing to peer units within the European market. Ten(10) European brewing companies from different countries (mainly beer producers including wine and spirit products’ specializers) are used in the measurements. The decision-making units are a set of firms including worldwide leaders called the “big four”: ABInbew, Carlsberg, SAB Miller and Heineken and mid to small size brewers.
We assume fair results may be conducted by this kind of random sampling.
5
Chapter 1
Background of the Turkish Brewing Industry
In this chapter, we explain the development of Turkish brewing industry from government monopoly to duopoly. This approach is used to clarify the impact of government interventions (bans, regulations and strict licensing) on the market.
We analyse facts behind Efes’ market leadership and Tuborg’s follower position, furthermore find out reasons for the mature and saturated industry circumstances.
1.1 Industry Background
Turkish brewing industry possessed a monopolistic character from 1934 to 1969 with a government entity named Tekel. During these 35 years Tekel, suffered from low product acceptance, limited distribution channels, and productive inefficiency issues despite its monopolistic market power under government support. We do not have sufficient data to make a quantitative judgement for this stage of the industry. Furthermore, this period as government monopoly (1934-1969) does not carry any significant indicators for our research.
We introduce Turkish brewing industry in four phases according to its decisive stages.
Each phase represents different industry features affected by government bans and regulations.
The phases are categorized as follows: Phase 1: Growth and Competition (1969-1977), Phase 2:
Market Maturity (1978-1983), Phase 3: Efes’ Plans and New Regulation (1984-1990) and,Phase 4: Import Brands and M&As (1990-Todays).
6
1.1.1 Phase 1: Growth and Competition (1969 - 1977)
Turkish brewing industry structure changed drastically after acceptance of new entries by a government regulation in 1969. Two companies, Denmark’s Tuborg1 and Turkey’s Efes Pilsen entered the market. From Figure 1.1 below we can see changes in brand sales of the industry. The industry transformed from 34 years of government monopoly (1934-1969 by Tekel) to an oligopoly (by Anadolu Efes, Turk Tuborg, Tekel) including private entities. A rapid increase of four times in brand sales occurred within following eight years’ period (1969-1977). At the beginning of the figure, we examine a fierce competition in onder to capture bigger market shares.
Figure 1.1: Turkish Brewing Industry and Brand Sales 1969-86
The growth and competition period took place from 1969 to 1977. Despite overall expansion of the market, growth was not evenly divided among competitors.
As seen in Figures 1.2 and 1.3 following, Tekel's market share decreased from 79.6%
to 29.3% between 1969 and 1977. In this period, Efes and Tuborg achieved significant increases in market shares from 6.1% to 48.7% and from 14.3% to 22% respectively.
1 In this research,we use different names as : “Tuborg” or “Turk Tuborg” for Tuborg and
“Efes”, “Anadolu Efes” or “Efes Pilsen” for Efes .
Phase Phase
Growth and Competition
Market Maturity Advertising Bans
7
Figure 1.2: Market Shares in 1969
Figure 1.3: Market Shares in 1977
Efes pioneered the growth stage accompanied by Tuborg. Efes owed its market leader position to maintaining two core objectives: building product acceptance and building brand positioning.
At this section, we analyze the strategic moves which carried Efes to the market leader position. For this purpose, we use a well-known marketing model called “ 4Ps marketing mix”.
The initials “P” stand for “product, place, promotion and price” components of the marketing mix.
The concept of “the marketing mix” was reconstructed by Neil Borden[8]. In 1948, he described role of marketing manager as a “mixer of the ingredients” where the idea came from.
Another concept of 4Ps was introduced by E.Jerome Mccarthy in 1960 [31]. Table 1.1 below is the description of 4Ps concept as:
Anadolu Efes Tekel Turk Tuborg 14.3% 6.1%
Anadolu Efes Tekel Turk Tuborg
48.7%
29.3%
22%
79.6%
8
Table 1.1: Concept of 4Ps Marketing Mix
Category Definition
Product The product is an item that meets customer demands . It can be either in the form of a tangible good or an intangible service. Product decision is the initial decision before making any marketing plan.A firm has to answer questions for the right production mix as follows :
What product is going to be sold?
In what quality is it going to be produced?
What features will make the product different from others?
What are the secondary products or services sold together with the product?
Place The place component refers to distribution channels. From its availability of access, products vary from consumer goods to premium products. Strategies for intensive distribution, selective distribution, exclusive distribution, and franchising can be used for the marketing.
Promotion Promotion includes advertising, public relations, and sales promotions . Promotions also decide segmentation targeting and positioning of the product.
Price Pricing is subject to a combination of many different variables. It also has to be updated. Some of the major elements in pricing are the cost of the product, advertising, marketing and distribution expenses and changes due to market fluctuations.
Source: Needham, Dave (1996). Business for higher awards. Oxford, England: Heinemann [34].
With 4Ps concept, we explain factors behind marketing success of Anadolu Efes as follows:
9
Product: Efes started its action plan with a market research that identified customers’
complaints about Tekel’s flagship brand under the same. Eventhough its customers liked the taste of Tekel Beer; they wanted more consistency, higher alcohol content, and thicker foam.
As a response, Efes produced a slightly higher alcohol level beer (4.2 percent against Tekel’s 3.8 percent) and positioned it as a social beverage, rather than an alcoholic beverage. With this new status of beer. Efes made a rapid expansion throughout the country. On the contrary, positioning the brand as an alcoholic beverage would have run counter to Islamic prohibition[21].
Place: With the new status as a “social beverage” Efes made its rapid market penetration by selling beer in coffee houses. These places were the most popular gathering spots for Turkish men. Beer Pubs were secondary selling outlets that reflected European impression among Turkish citizens.
Promotion: Promotional programs at the trade were pioneering effects for Efes’ success.
However at this stage of growth and competition, only a little attention was paid to potential women customers. Because the market penetration was instituted mainly by male customers. We recognize 65/35 split as the main course for maintaining the quality control in distribution channels. Efes, shrank territories and added new distributors to achieve an increase in customer demand.
Price: At this stage, Efes positioned its beer as a social beverage at an affordable price level in between Tekel (an inexpensive beer) and Tuborg (a premium beer with price). However, it encountered a new type of competition against social beverages like soft drinks, coffee, and fruit drinks. Another obstacle for Efes was the high price elasticity due to low per capita income level in Turkey. Considering these facts, “first quality second price” policy was taken into account.
This policy led Efes occupy same quality and taste level with Tuborg, yet a cheaper price level below Tuborg. Efes captured both price and quality conscious customers as a result of right timing and positioning.
We summarize Efes’ successful strategic moves at the growth stage by using 4Ps of marketing mix as in Figure 1.4 below:
10
Figure 1.4: 4Ps Marketing Mix Strategy by Efes at the Growth Stage
1.1.2 Phase 2: Market Maturity (1978-1983)
Rapid growth turned into a slower trend starting from 1977. In saturated markets product acceptance and positioning are expected to be stabilized, that was what also happened in the Turkish brewing industry. However, industry sales did not follow expected patterns. Efes’ sales more than doubled (see Figure 1.1) and market share increased to a level above 34 percent. Efes penetrated rural areas and gained new type of customers as a result of distributors’ efforts. At this stage new beer concepts were added to the product line, like 50 cl bottle for home consumption.
However, Efes’ increase in market share came at the expense of Tekel, the first Turkish brewer.
1.1.3 Phase 3: Efes' Plans and the New Regulation (1984-1990)
At this stage, industry sales were stabilized. Efes had a high market share that left only a few converts to win. The offensive strategy was kept into plan targeting to assault Tuborg’s brand position at the premium, with import beer brands in the market. Tuborg moved to compete against Efes with a new brand with a lower price. Efes responded this move by entering the premium
Product
•acceptance as a social beverage
•more foam,alcoholic level and consistency than current
monopoly brand
Price
• between Tekel and Tuborg
•first quality,second price
Place
•coffee houses
•beer pubs
Promotion
•promotional programming at the trade
•65/35 split
11
beer market with a German brand called Löwenbrau. Efes targeted to capture Tuborg’s 20 percent market share.
Expanding to overseas markets and developing a non-alcoholic beer for Islamic countries were other strategic moves of Anadolu Efes. However on June 22, 1984, government’s announcement of beer as an alcoholic beverage again, drastically made negative impact on Turkish brewing industry. Advertising ban on broadcast media and strict licensing criterias made it harder for brewers to reach new customers. Promotional opportunities became very limited without broadcast media. Moreover, distribution to coffee houses became off-limit. Thus, a sharp decline of 38 percent in beer sales was seen in two years’ time. Efes still kept its market leader position with same market share.
According to Figure 1.5 as follows, Efes’ market share increased from 48.7% to 67% in between 1977 and 1983, before the government regulations. Tuborg’s market share slightly fell 1 percent, from 22% to 21% level. Tekel had the biggest drop in market shares from 29.3% to 12% as a result of Efes’ and Tuborg’s aggressive strategies (see Figure 1.5).
Figure 1.5: Market Shares in 1983
Instead of broadcast media, promotions through print and point-of-purchase media became new ways of advertising. Another promotional effort was done by Efes Pilsen basketball team that has been competing very successfully in Turkey and Europe. This move helped Efes enhance name recognition and even indirectly preserve broadcast media exposure [21].
In Figure 1.6 as follows we identify how industry sales increased more than six times from 1969, to 1984 when a new regulation was made by Turkish government. A rapid decrease
Anadolu Efes Tekel Turk Tuborg
67%
12%
21%
12
followed after broadcast media ban and strict licensing. From Figure 1.6, we conclude that the Turkish brewing industry is significantly shaped by government interventions.
Figure 1.6: Turkish Beer Industry and Industry Sales 1969-1986
Turkish brewing industry had been focusing on product proliferation and diversification (around 40 brands including discount, popular-priced, premium and import brands) rather than a price competition. Efes has market leadership from rapid growth days of the industry.
Tuborg,with follower position targets the residual demands and serves mainly to a premium customer base. From the early 70’s to today's, Turkish brewing industry had completed its stabilization with two dominant companies. Despite entries of other beer companies, including ”microbrewers” Anadolu Efes and Turk Tuborg capture more than 95 percent market share of the entire industry. State-owned brewer, Tekel could not use its first mover’s advantage.
Therefore, most of its customers switched to other brewers, mainy to Efes. At the same time, Tuborg kept its particular customer portfolio with a sense of brand loyalty, under a motto “Real men drink real beer”.
A significant regulation in 1984 canalized companies expanding to new regions like overseas markets. Efes pioneered this period by opening facilities in Kazakhstan, Russia, and Romania, and grew the company into one of the main mass brewers in Europe.
Phase Phase
13
1.1.4 Phase 4: Import Brands and M&A's (1990-Todays)
90’s was an era for import products’ entries into the Turkish brewing industry. Corona from Mexico, Heineken from Holland, Beck’s from Germany, Budweiser and Miller from America and Fosters from Australia were some examples of these entrants. However, the obstacles for import brands are categorized as: complicated bureaucracy in Turkey, the limited profit margin for beer and requirement for wide distribution channeling.
2000-2001 was a period of significant change in Turkish brewing industry. Efes started holding exclusive rights for production and sales of Miller, the flagship brand of Miller, which is the 4th biggest brewer in the world. Same year Danish Carlsberg acquired Tuborg and became the biggest shareholder with a 50.01 percent of overall share.
In 2004, Tekel was acquired by another Turkish brewery called Mey Icki. Tekel had been occupying eight percent market share until the year 2006 when Mey Icki stopped its production.
Turkish brewing industry transformed from oligopoly to duopoly at this stage (see Figure 1.7).In 2008, Anadolu Efes acquired Tekel Birasi Beer from Mey Icki. Today this brand has around 1 percent market share.
Figure 1.7: Market Evolution (1934-Todays)
Within the last 13 years, the conservative government and rise of Islamic wing brought some hardships to the brewing industry in Turkey. Very high excise taxes were imposed on beer recent years[17]. However, Anadolu Efes managed to keep its sales volume and market share at the same level until 2012, because of strategic investments and decisive initiatives. Despite a market growth of 5 % in 2012, steeper taxes and strict regulations in 2013 exerted significant pressure on the sales volumes and market shares. The effects of regulatory changes showed their
1934-1969 Tekel Monopoly
1969-2006 Anadolu Efes
Turk Tuborg Tekel Oligopoly
2006-Today's Anadolu Efes Turk Tuborg Duopoly
14
impact in 2013 and 2014 as a decline trend.Taxes and regulations played crucial roles in price settings. For example, the excise tax charged on beer was increased by 15.6 % in January 2014 and by another 4.1% in July 2014. Therefore, these increases had to be reflected on prices [17].
The mature market conditions and government policies led both companies focusing on productive efficiency issues. For example as a result of these efforts from 2008 to today, 19 and 24 percent of less water is being used in beer and malt productions respectively (see Anadolu Efes annual report 2015) [1].
In Chapter 2 ,we analyze current situation of Turkish brewers and the brewing industry.
15
Chapter 2
Current Situation of the Turkish Brewing Industry
In this chapter, we analyze the current situation of the Turkish brewing industry. This analysis is made up of two parts. In section (2.1), we define the industry structure and categories of Turkish brewers by scales. In section (2.2), we use a well-known marketing approach called the SWOT analysis. We define strengths, weaknesses, opportunities and treats of the industry under this perspective.
2.1 Industry Structure
Beer is defined under the category of Fast Moving Consumer Goods (FMCG) as well as food, tobacco, personal care goods, and housekeeping products. On the other hand, beverages are categorized as soft drinks and alcoholic beverages. Soft drinks include carbonated soft drinks, bottled water, fruit juices and sparkling water. Alcoholic beverages include spirits like raki (traditional Turkish alcoholic beverage), vodka, wine, and beer. Finally, beer can be categorized from top to bottom as consumer goods/fast moving/food/beverage/alcoholic beverage/beer[9].
We classify breweries into five categories according to their production volumes as follows:
1) Macrobrewery: They are large and renovated breweries with a production capacity of more than 1,800,000 liters annually. This group consists of Anadolu Efes and Turk Tuborg, which compete on a nation wide level and export overseas.
2) Microbrewery: Microbreweries are the designation of breweries that produce fewer than 1,800,000 liters annually. Their marketing strategies differ from those of the large, offering products that compete by quality and diversity instead of low prices and
16
advertising. Most of the breweries in the Turkish brewing industry besides Anadolu Efes and Turk Tuborg fall under this category. They operate in regional levels.
3) Nanobrewery: They are scaled down breweries, often ran by a single entrepreneur that produces in very small batches.
4) Craft Brewery: This term is not only used for relatively small, independently owned breweries but also refers to traditional brewing methods and emphasize flavor and quality.
5) Brewpub: It is the combination of a brewery and pub. A brewpub can be pub or restaurant that brews beer on premises.
Until 1969 Turkey held a monopolistic market structure operated by a government entity named Tekel. Despite its monopolistic market power stimulated by the government support, its flaship brand under the same name suffered from low product acceptance, limited distribution channels, and inefficiency issues (see Chapter 1).
In 1969 a government regulation changed industry structure into an oligopoly by allowing private brewers enter the market. Since then industry concentration has increased. Today the industry holds duopoly market structure with combined market share of 95 percent. Because of high entry barriers and market saturation, there is not much space for new entrants to succeed.
As we see in Table 2.1 below, Anadolu Efes is the market leader, and Turk Tuborg is the follower with around 80 and 15 percent market shares respectively. Recently, the industry has duopoly structure , and we examine a Stackelberg competition where the roles of Anadolu Efes and Turk Tuborg are well defined. Both of the firms sell homogenous products subject to same demand and cost functions. Anadolu Efes is the price and quantity setter because they are better known, and they decide first which quantity to sell. Efes owes its privileged position to the wide distribution channels established in the growth stage (see Chapter 1). Turk Tuborg focuses on residual demands of Anadolu Efes. Tuborg has a premium product portfolio including its high- quality main brand under same name as “Tuborg”.
The main product line of Anadolu Efes is Efes Pilsen (5.0% ABV) named after the ancient Turkish city of Ephesus near its Izmir brewery. Other products of Anadolu Efes are Efes Dark, Efes Light, Efes Extra, Bomonti, and Marmara. Efes also exports to markets in Europe, the Middle East, Africa and South-East Asia.
Turk Tuborg is Anadolu Efes’ main competitor. The company is a former subsidiary of the Danish Carlsberg/Tuborg group. Currently, Tuborg is owned by Israeli Central Bottling
17
Company (CBC). Danish Carlsberg is also popular in Turkey among other brands found internationally.
Table 2.1: Company Share Analysis (%), 2010-2011
Company 2010 2011
Anadolu Efes Biracilik ve Malt San AS 79.0% 80.2%
CBC Group(Turk Tuborg) 15.4% 14.8%
Others 5.6% 5.0%
Source: Datamonitor 2012 [15]
Anadolu Efes and Turk Tuborg operate six breweries out of eleven in total. Besides these breweries, there are five microbreweries active in the Turkish market (see Table A.1 and Table A.2,Appendix). These companies also carry out beer related operations besides the production and sale of beer such as : agricultural operations related to beer production, transportation of beer, wholesale of beer trading, the bottling and packaging of beer and production and sales of malt.
In Turkey beer is produced and consumed domestically. One percent market share of import brands takes insignificant part in the industry. They are sold through upscale hotels and cafes. Export markets of Turkish beer companies have been growing. Anadolu Efes and Turk Tuborg together sell more than 40 countries overseas. In Turkey beer production has reached to a stabilized level with compound annual growth rate (CAGR) of 14%. From the Table A.3, which includes Flavoured Alcoholic Beverages (soft drinks, pre-mixed spirits, and wine coolers) and ciders, we can identify a steady increase in production volume for beer (see Appendix).
Around 40 different brands of beer are produced in Turkish brewing industry, mostly by Anadolu Efes and Turk Tuborg. Three brands have a total market share of 88 percent as seen in Table 2.2 below. In Turkish market, the brewing companies have products in three categories:
1.Premium, 2.Mainstream and 3.Discount. Efes Pilsener and Efes Xtra of Anadolu Efes, Tuborg
18
of Turk Tuborg fall under the “mainstream” category. The main competition takes place in this category. The average price of Turkish beer is lower than European brands and import brands sold in Turkey[1]. Under these circumstances, it is expected that firms improve their financial positions and increase disposal income. Furthermore, as a result, there should be an increase in the consumption of beer. However, bans, regulations and frequent increases in taxes and excise duties by government eliminate these opportunities.(see Appendix).
Table 2.2: Brand Share Analysis (%) 2010-2011
Company Brand 2010 2011
Anadolu Efes Biracilik ve Malt San AS Efes Pilsener 62.5% 62.8%
CBC Group Tuborg 12.8% 12.7%
Anadolu Efes Biracilik ve Malt San AS EFES Xtra 12.1% 12.6%
Anadolu Efes Biracilik ve Mallt San AS Others 3.8% 4.3%
Source: Datamonitor 2012 [15]
Since 1969, the trends in Turkish brewing industry has existed around the popular-priced (mainstream) beer category. Despite M&As (mergers and acquisitions) and increasing disposal income per capita, we see no significant shifts to premium,super-premium, and imported brands.
Today import brands have only a market share around 1 percent.
The use of agricultural products is high in beer production because beer is a natural drink.
Beer is made from a malted cereal source which is mostly barley, hops, yeast and water. Barley is the most important ingredient in beer production. Eventhough Turkey is one of the major barley producers in the world, the need for high-quality barley faces some difficulties. Despite the fact that ,70 percent of barley is for industrial use in Turkey, approximately 100,000 tons of barley on a yearly basis need to be imported. In addition to agricultural products glass bottles, crown corks,
19
labels, PET preforms, filtering products and enzymes are also used during the production process[32].
The following figures explain the breakdown of costs for beer production in the U.S.
market and an average brewing plant in Europe with an annual capacity of 0.4 million hectolitres.
In Turkey labor costs are almost one-fourth of the European average[18]. Turkish brewing industry has an organization of vertical integration by a three-tier distribution system. The system works as: mass brewers sell their products to wholesalers, and wholesalers sell to the retailers.
The mass brewer sets the wholesale price at the brewery, but the price varies for the region in response to demand and competition factors. The following price-cost breakdown was made for the U.S. brewing industry in 1996. From Figure 2.1 below, we examine that ingredients, labor and production costs account less than 16 percent of the consumer price for a six pack beer. Tax and shipping expenses account for about 18 percent of the price for beer (see Figure 2.1).
Figure 2.1: Price-Cost Breakdown of Mass Produced Beer(U.S.Industry) [49]
Ingredients; 4,0% Brewer profit;
6,0%
Advertising and management
8,2%
Labor and production
11,7%
Packaging 16,5%
Taxes and shipping
17,2%
Retail and distributor markup
36,4%
Price-Cost Breakdown
Ingredients Brewer profit
Advertising and management Labor and production
Packaging Taxes and shipping
Retail and distributor markup
20
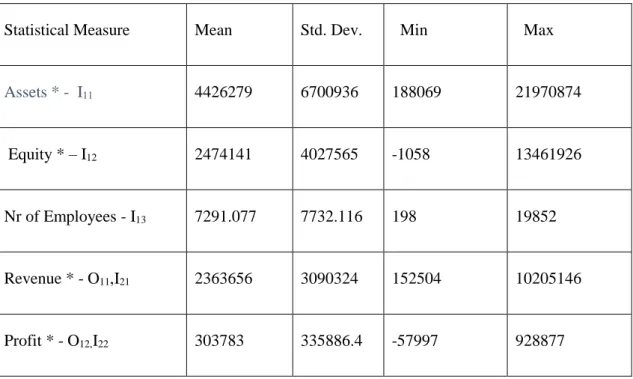
Item Ratio /hl beer produced Cost USD/hl beer produced
malt 18 kg 5
hops (cones) 0.15 kg 0.5
yeast(thick) 0.61 0
fuel 150 MJ 0.7
electricity 12kWh 1.2
water 0.7m3 0.3
waste water treatment 0.55m3 1.1
space part lumpsum 1.2
Assumptions: capacity 0.4 ml,6.2 the h per year operation
Figure 2.2: European Standard Plant Operation Costs
Beer is the most expensive alcoholic drink to produce according to the study made by Brewers of Europe in 2009 [43]. When converted to pure alcohol, the cost of producing one liter of pure alcohol in beer is €45.20, wine is €17.90, and spirits is €18.60. After adding excise taxes, beer is still the most expensive form of alcohol to produce at retail prices. The average retail price including taxes of one liter beer is €84 compared to €77 for wine and €65 for spirits. On the contrary, when compared to other types of alcoholic beverages, beer holds the smallest net margin per liters of finished product. To add up large total margins, companies have to sell their products in big volumes.
From Figure B.7 we identify that beer has the lowest consumption per capita rate in Turkey,comparing to other European countries(see Appendix). The reasons are: a prohibition of alcohol consumption by Islam religion and customer’s preference for a national alcoholic spirit called Raki.
In Turkey, brewing industry has shown growing trends from the entry of private entities in 1969 to mids of the 90s and,stagnant periods in the last decade. One of the main reasons behind changing trends in sales is government intervention by law. Alcoholic beverages are prohibited from selling closer than 200 meters to schools, mosques and hospitals. In addition to bans and regulations, granting licenses to retailers with high criteria limit distribution opportunities. Beer supply varies according to the seasonality affects. Even at the very high seasons only 35 percent of beer is distributed by retailers. Despite decreasing consumption per capita, high excise duties, taxes, and inflation rates are reflected in the prices. The expenditures made on beer per capita shows an increasing pattern of nine percent average annual rate. Eventhough the consumption
21
per capita in Turkey stays flat, the market value increases at around 10 percent compound annual growth rate (see Appendix).
2.2 Turkish Brewing Industry under SWOT Analysis
In section 2.2, we analyze the Turkish brewing industry by using a well-known marketing approach called SWOT analysis. The term “SWOT” refers to the initials of the words “strength, weaknesses, opportunities and threats”. This analysis identifies the strengths and weaknesses of a business and examines the opportunities and threats that may affect that business. This approach was first introduced by Albert S.Humprey that came from research conducted by Stanford Research Institute in 1960-1970[2]. The research was funded by Fortune 500 companies to find out reasons behind corporate failures. Table 2.3 below is the classification for the components of SWOT.
Table 2.3: Explanation of the SWOT Analysis
Strengths and Weaknesses
the internal environment- the situation inside the company or institution
i.e.: factors relating to products, pricing, cost,profitability, performance,quality, people skills,adaptability, brands, services,processes,infrastructure
These are the factors tend to be in the “present”
Opportunities and Treats
the external environment – the situation outside of the company or institution
i.e.: factors relating to markets, sectors, audience,trends,
seasonality,competition,
economics,politics,society,culture,techn ology,environment
These are the factors tend to be in the “future”
22
In this analysis, Strengths and Weaknesses are mapped or graphed against Opportunities and Treats. Strengths and Weaknesses are regarded distinctly as internal factors; Opportunities and Treats as external factors. During his research, Albert Humphrey advocated six categories as follows: 1.Product (what are we selling?), 2.Process (how are we selling it?), 3.Customer (to whom are we selling it?), 4.Distribution (how does it reach them?), 5.Finance (what are the prices, costs, and investments?)and, 6.Administration ( how do we manage all this?)
By using the categories above, he provided a SWOT framework by which internal and external issues can be overcome with actions and new management skills. We analyze the Turkish brewing industry by using SWOT framework as follows:
STRENGTHS
Brand Awareness: Anadolu Efes’ Efes Pilsener and Efes Xtra and Tuborg’s Tuborg have the brand awareness among Turkish beer customers. From 1969 to today, both companies have established their corporate and brand images in the industry. Efes is well-known for its accessibility, better foam, consistency, and freshness. Tuborg focuses on its particular customer portfolio with the motto of “Real men drinks real beer”. Recently regarding to the competition, capturing from each other’s customer portfolio is not seen for the companies.
Company Structure: Anadolu Efes has the economy of scale and scope with a decentralized organization structure. This company has fourteen beer (five in Turkey and nine abroad) and six malt factories, Moreover it has reached MES (minimum efficient scale) amount (six to seven plants) required for the brewing industry. However, its decentralized structure may bring inefficiencies due to the large size of the organization.
On the contrary, Turk Tuborg has a centralized organization structure having Turkey’s biggest brewing factory in Izmir with a production capacity of 36,000 malts and 300 million liters of beer. Under Denmark’s Carlsberg Breweries Turk Tuborg has know–how and expertise in brewing. Its centralized structure makes it easier to take control in more efficient organizational structure.
Industry Structure: Turkish brewing industry is transparent, consolidated and highly regulated. Two companies dominate the industry with combined market share of 95 percent. High entry barriers make it harder for the new brewers enter the market ,however incumbent firms are protected to strength their positions. High technology and expertise is required to start up in the
23
industry. From the year 1984, TV and radio advertisements are fully restricted. These factors make it harder for the new entrants to succeed and establish brand awareness.
Beer as a Product: Beer is a product hard to copy and imitate. The production process is technology and knowledge intense. Companies need to operate six to seven plants to reach MES in the production. Beer is most expensive to produce comparing to other alcoholic beverages.
Therefore, illegal production like raki and wine is unlikely to be seen.
WEAKNESSES
Obstacles for Raw Materials: Beer is a natural drink and use of agricultural products is high. Finding suitable barley, the main ingredient, for beer production is not an easy task for brewers. Turkey is one of the major barley producers worldwide, and 70 percent of barley is for the industrial use. However, requirement for high-quality barley is an important obstacle in beer production.Turkey needs to import 100,000 tons high-quality barley annually[17].
In 2009 and 2010,because of unexpected harvests in Europe hops production decreased.
Brewing companies may confront high prices in agricultural products due to similar circumstances.
Low Consumption in Turkey: Comparing to all members of European Union, beer consumption per capita in Turkey is very low. EU had averages of final product per person consumed and pure alcohol beer consumption 75.3 liters and 3.5 liters respectively in 2009.
Turkey had averages in same categories as 12.7 and 0.7 respectively [43].
Reasons for low consumption may be Islamic prohibition for alcoholic drinks, tax burden, decreasing popularity of beer, economic crisis, and limited opportunities for advertising and promotions of beer in Turkey.
Hostile Business Environment: With the rise of Islamic wing in the Turkish government, the business environment has become more hostile than before for the beer companies. Excise duty levied on beer is 18 percent VAT(Value Added Tax). In addition to this tax companies have to pay,income-related taxes, social security contributions, corporate tax, property tax, environmental tax, announcement and advertising tax, stamp tax, monitoring tax, packaging tax, and fuel tax on production and sales of beer. The amount of these taxes is seven times greater than countries with similar GDP PPS per capita and three times greater than the average EU members. In addition to high excise duties and taxes, bans and regulations by the pro-Islamic government oppose to alcohol consumption and creates a hostile business environment for the brewers in Turkey [21].