熊本大学学術リポジトリ
Application of Derived Characteristics of Magnetic Cores to 3‑Staged MPC Simulation
journal or
publication title
Digest of Technical Papers‑IEEE International Pulsed Power Conference
volume 2007
page range 1201‑1204
year 2007‑06
URL http://hdl.handle.net/2298/10320
doi: 10.1109/PPPS.2007.4346039
Application of Derived Characteristics of Magnetic Cores to 3-Staged MPC Simulation
J. Choi, T. Nagano, T. Namihira, T. Sakugawa, S. Katsuki and H. Akiyama
Kumamoto University, Kurokami 2-39-1 Kumamoto, 860-8555, Japan
Abstract
A low inductance circuit has been fabricated in order to obtain shorter time to saturation during core unsaturation and current pulses with shorter widths during core saturation. B-H curves have been derived from the measured voltage and current waveforms. Characteristics of the magnetic core for pulsed-power generators have been investigated and the Electromagnetic Transient Program (EMTP) simulation has been carried out in order to determine the effects of leakage current on the energy efficiency of a 3-staged magnetic pulse compressor (MPC). As results, the unsaturated and saturated permeability were obtained from the derived B-H curves.
And, it is found that µ
unincreases with time to saturation and that µ
satis strongly influenced by the stray inductances of the core. By applying custom characteristics to each stage in EMTP simulation, more practical energy transfer in MPC is obtained.
I. INTRODUCTION
The dc and ac characteristics of magnetic materials have been well known and easy to obtain from manufacturers. As the use of magnetic cores has become popular in pulsed-power applications, there have been several studies of the pulse magnetic characteristics that are critical for a multi-stage MPC [1-5]. However, there are still some necessities for the users of the magnetic cores to measure the pulse characteristics for more efficient MPC design. As the number of stages in an MPC increases, the efficiency of the energy transfer that is one of the dominant measures for overall performance becomes poor.
In this paper, a low inductance circuit fabricated to obtain shorter time to saturation during core unsaturation and current pulses with shorter pulse widths during core saturation is described. Also, the characteristics of the magnetic core for pulsed-power applications are described using the B-H curves derived from the measured voltage and current waveforms. Finally the Electromagnetic Transient Program (EMTP) simulation is carried out in order to determine the effects of leakage current on the energy efficiency of a typical 3-staged MPC.
II. EXPERIMENTAL SETUP AND PROCEDURES
Figure 1 describes the schematic diagram of the low inductance circuit for measuring dynamic properties of the magnetic core. The discharge circuit has a coaxial geometry to reduce the stray inductance of the circuit. The total inductance around the main current loop during saturation of the core has been calculated to be as low as about 85 nH. A reset circuit is used to obtain a maximum flux swing. The magnetic core used in this study is a FINEMET core (FT-1H, Hitachi Metal Corp., Japan), which has a 60 mm inner diameter, 130 mm outer diameter and is 25.4mm in height. The derivation method for the B-H curves from the measured voltage and current waveforms is described in [6]. And, the experimental parameters are shown in Table 1.
Figure 1. Schematic of the low-inductance circuit for measuring dynamic properties of the magnetic core.
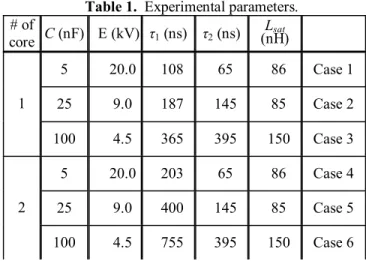
Table 1. Experimental parameters.
# of
core C (nF) E (kV) τ 1 (ns) τ 2 (ns) L sat
(nH)
5 20.0 108 65 86 Case 1
25 9.0 187 145 85 Case 2
1
100 4.5 365 395 150 Case 3
5 20.0 203 65 86 Case 4
25 9.0 400 145 85 Case 5
2
100 4.5 755 395 150 Case 6
III. RESULTS AND DISCUSSION
A. Derivation of Relative Permeability
Dependence of effective unsaturated relative permeability (µ ru ) on time to saturation ( τ 1 ) is shown in Figure 2. It can be seen that µ ru increases with τ 1 for a fixed product of voltage and time. This is because µ ru
increases with decreasing dB/dt, that is, decreasing voltage [1]. From these results, it is considered that the last stage in MPC will show worse switching performance because it has a shorter τ 1 and a larger leakage current.
Also, it is observed that the permeability of two cores is higher than that of one core due to the fact that dB/dt has been halved by keeping the voltage constant while doubling the number of cores. It is thought that the switching performance of the magnetic core in MPC can be improved as the number of cores increases for the same voltage at the cost of other factors.
Dependence of effective saturated relative permeability (µ rs ) on frequency is described in Figure 3. It can be seen that µ rs is almost independent of frequency for a fixed charge energy because the magnetic core behaves as an air core during the saturated state. Also, it is observed that the permeability of two cores is lower than that of one single core. This is because L sat is constant in the saturated state while the core cross section area has doubled. In fact, µ rs does not indicate the relative permeability of the magnetic core but rather the stray inductance of the core holder divided by the cross section area. Also, it is observed that µ rs does not decrease to 1 due to the stray inductance of the core holder. The stray inductance calculated from the geometry of the core holder can be determined from [7]:
a b h
L holder N ln
2
2
0 π
µ ⋅
= (1)
and is about 20 nH where h, a, and b are the height, the outer radius, and the inner radius of the core holder, respectively. The saturated inductance calculated from µ rs
in Figure 3 using the relation [2]:
0 2500 5000 7500 10000 12500
0 200 400 600 800 1000
1core _ 1J 2cores_ 1J
Time to saturation, τ
1(ns)
Figure 2. Dependence of effective unsaturated relative permeability (µ ru ) on time to saturation.
0 2 4 6 8 10 12
0 2 4 6 8
1core _ 1J 2cores_ 1J
Frequency (MHz)
Figure 3. Dependence of effective saturated relative permeability (µ rs ) on frequency.
e rs e
sat l
A
L = µ 0 µ N 2 ⋅ (2)
is also about 20 nH. These same results indicate that the stray inductance of the core holder directly influences the slope of the B-H curve in the saturated state and that the inherent µ rs of the magnetic core is nearly unity. From these results, it is evident that the maximum current and effective energy transfer in the saturated state of a real MPC circuit strongly depend on the stray inductances of the circuit.
Figure 4. Schematic diagram of the simulation circuit for a typical 3-stage MPC.
-0.5 0 0.5 1 1.5 2 2.5 3
-1000 0 1000 2000 3000 4000 5000 6000 7000 SI
0_MPC1 SI
1_MPC1 SI
2_MPC1 SI
3_MPC1 SIs_MPC2
H (A/m)
Figure 5. B-H curves for the magnetic cores of MPC1 and MPC2.
1202
-0.01 0 0.01 0.02 0.03 0.04 0.05 0.06 0.07
0 200 400 600 800 1000
SI
0_MPC1 SI
1_MPC1 SI
2_MPC1 SI
3_MPC1 SI
0_MPC2 SI
1_MPC2 SI
2_MPC2 SI
3_MPC2
I(A)
Figure 6. Φ-I curves for the magnetic cores of MPC1 and MPC2.
B. EMTP Simulation with Custom and Identical B-H Curves for Each MPC Stage
In this study, EMTP [8, 9] has been used to carry out the comparison studies between an MPC (MPC 1 hereafter) with custom B-H curves and the other MPC (MPC 2 hereafter) with identical B-H curves for each MPC stage. The B-H curves of the different permeability characteristics derived in the last section and a B-H curve reported by the manufacturer in [10] have been utilized for the magnetic cores of MPC 1 and MPC 2, respectively.
Figure 4 shows the schematic diagram of the EMTP simulation circuit for a typical 3-staged MPC. The simulation circuit has a foremost stage for pulse generation and three subsequent stages for pulse compression, and consists of capacitors (C 0 , C 1 , C 2 and C 3 ), saturable inductors (SI 0 , SI 1 , SI 2 and SI 3 ), stray inductances (SL 0 , SL 1 , SL 2 and SL 3 ), a switch (SW), a pulse transformer (PT) and a matched load. The capacitances of C 0 , C 1 , C 2 and C 3 are 2.3 µF, 16 nF, 16 nF, and 16 nF, respectively. The charge voltage on C 0 is 2.6 kV. Stray inductances used for each stage are shown in Table 2. These values are based on a real MPC [11]. PT has a function of an ideal step-up transformer with the voltage gain of 12. A 2.3 Ω resistor is used as the matched load.
Figure 5 shows the custom B-H curves for SI 0 , SI 1 , SI 2
and SI 3 of MPC 1, and the identical B-H curve for SI 0 , SI 1 , SI 2 and SI 3 of MPC 2, respectively. The custom B-H curves for SI 0 , SI 1 , SI 2 and SI 3 of MPC 1 were derived from Case 3, Case 6, Case 2 and Case 1 in Table 1, respectively. All the curves show different slopes (that is, µ ru ) during the unsaturated state due to the leakage current characteristics of the magnetic core, and same slopes (that is, µ rs ) during the saturated state due to the transition of the core from the magnetic material to the air.
Figure 6 shows the flux and current relationships for SI 0 s, SI 1 s, SI 2 s and SI 3 s of MPC 1 and MPC 2, respectively. The curves were derived from the B–H curves shown in Figure 5 using the following relationships:
Table 2. Stray inductances used in the EMTP simulation circuit.
SL 0 SL 1 SL 2 SL 3
0.847 µH 0.6 µH 0.276 µH 0.06 µH Table 3. Calculated Inductances of the magnetic cores
of MPC 1.
SI 0 SI 1 SI 2 SI 3
Lu 0.125 mH 15.0 mH 0.143 mH 0.015 mH Ls 0.024 µH 1.34 µH 0.065 µH 0.011 µH
Lu/Ls 5200 11200 2200 1360
Table 4. Calculated Inductances of the magnetic cores of MPC 2
SI 0 SI 1 SI 2 SI 3
Lu 0.105 mH 5.98 mH 0.292 mH 0.047 mH Ls 0.024 µH 1.34 µH 0.065 µH 0.011 µH
Lu/Ls 4370 4460 4490 4270
A e
B N ⋅ ⋅
=
Φ (3)
and
N l H
I = ⋅ e / (4) where Φ is flux [Wb·Turns], I is current [A]. The numbers of winding turns for SI 0 , SI 1 , SI 2 and SI 3 of MPC 1 and MPC 2 are 3, 16, 4 and 2 respectively, and the numbers of cores for SI 0 , SI 1 , SI 2 and SI 3 are 1, 2, 1 and 1, respectively.
From the derived flux-current curves, it is possible to calculate the unsaturated and the saturated inductances of the magnetic switches. The results are shown in Table 3 and 4. The ratios of the unsaturated to the saturated inductance (Lu/Ls) for SI 0 , SI 1 , SI 2 and SI 3 of MPC 1 are 5300, 11200, 2200 and 1360, respectively, whereas the ratios of the unsaturated to the saturated inductance for SI 0 , SI 1 , SI 2 and SI 3 of MPC 2 are consistently about 4400.
It can be expected that the overall performance of MPC 1 decreases as the number of stages increases, whereas that of MPC 2 remains unchanged. Also, it should be noted that this big difference in the ratios plays an important role as a switch in the MPC circuit.
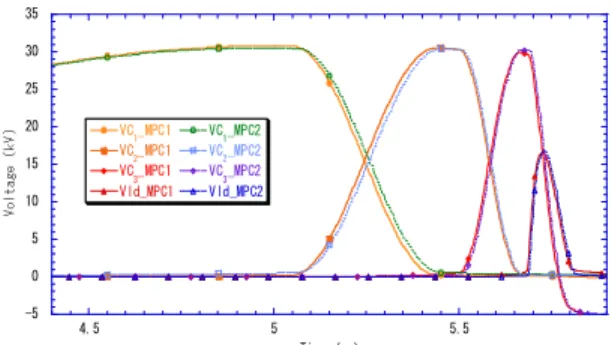
Figure 7 shows the voltage waveforms on each stage of MPC 1 and MPC 2. The charge voltage on C 1 of MPC 2 is lower than that of MPC 1 because SI 1 of MPC 2 has a higher leakage current from Figure 7 than that of MPC 1.
Also it is seen that the charge voltage on C 1 of MPC 2 is
-5 0 5 10 15 20 25 30 35
4.5 5 5.5
VC1_MPC1 VC2_MPC1 VC3_MPC1 Vld_MPC1
VC1_MPC2 VC2_MPC2 VC3_MPC2 Vld_MPC2
Time (us)