Computer simulations on the initiation and morphological difference of Japan winter and summer sprites
著者 Asano Tomokazu, Hayakawa Masashi, Cho Mengu, Suzuki Tomoyuki
journal or
publication title
Journal of Geophysical Research: Space Physics
volume 113
number A2
year 2008‑02‑19
URL http://hdl.handle.net/10228/00006965
doi: https://doi.org/10.1029/2007JA012528
Computer simulations on the initiation and morphological difference of Japan winter and summer sprites
Tomokazu Asano,
1Masashi Hayakawa,
1Mengu Cho,
2and Tomoyuki Suzuki
3Received 6 May 2007; revised 11 October 2007; accepted 6 November 2007; published 19 February 2008.
[
1] Two-dimensional (axisymmetric) computer simulations (electromagnetic code) have been performed to study the initiation and morphological difference (summer, carrots, and winter, columns) of sprites for simulating Japan summer and winter sprites. By changing the physical parameters of a parent lightning, we have found the following findings by looking at the spatial-temporal distribution of reduced electric field, etc.
(1) There are three important factors (the height where the charge is removed (ds), charge transfer (Q), and lightning current risetime (t)) in the initiation of sprites and their morphological differences. (2) For the initiation of sprites, the charge transfer (Q) should exceed a certain value for possible charge heights (giving us a threshold of charge moment change (Qds) of the order of 120 –200 Ckm), with a combination of small risetime of lightning current waveform. (3) Further, the height for positive charge is much higher than that for negative charge in a typical lightning configuration, which is the essential factor in determining the morphological difference of sprites in summer and winter.
Positive charges for summer are located at a much higher altitude than those in winter in Japan, which might result in carrot-type in summer and columnar-type in winter even for the same positive polarity. (4) A combinational effect of (Ids) and (Qds) is important for having sprites. Finally, the present computer results on the initiation of sprites for Japanese lightning have been compared extensively to the well-documented properties of summer continental sprites and future subjects to study have been suggested.
Citation: Asano, T., M. Hayakawa, M. Cho, and T. Suzuki (2008), Computer simulations on the initiation and morphological difference of Japan winter and summer sprites,J. Geophys. Res.,113, A02308, doi:10.1029/2007JA012528.
1. Introduction
[
2] Transient luminous events (TLEs) are large-scale optical events occurring at stratospheric and mesospheric/
lower ionospheric altitudes (in the altitude range from 40 to 90 km), which are directly related to the electrical activity in underlying thunderstorms and occur with delay at least 10 ms from the parent lightning [e.g., Sentman and Wescott, 1995; Lyons, 1996, 2006]. Since the discovery of the first optical recording, several different types of TLEs above thunderstorms have been documented and classified. There are two fundamental ones: (1) sprites that develop at the base of the ionosphere [Sentman and Wescott, 1995] and (2) elves which are lightning-induced flashes that can spread over 300 km laterally [Fukunishi et al., 1996]. It is generally agreed that elves are caused by heating and ionization by the electromagnetic pulse from ground flashes [Nickolaenko and Hayakawa, 1995; Inan et al., 1996], while it is generally suggested as the most favored mech- anism that sprites occur due to the quasi-electrostatic (QE)
electric field extended by the negative charge left in the thundercloud after the parent positive cloud-to-ground (CG) strokes [Pasko et al., 1995, 1997a]. This QE theory has been successful in explaining the general phenomenology of sprites, but there are still important but unsolved problems including long-delay sprites, relative location of a sprite with its parent lightning, fine structure of sprites, sprite morphology, etc. [Pasko, 2006].
[
3] Numerous observations have yielded that there are fundamentally two basic forms of sprites: (1) ‘‘carrot’’
[Sentman and Wescott, 1995] and (2) columniform types [e.g., Wescott et al., 1998], though there are a wide range of other shapes including quasi-amorphous glows, halo, etc.
The carrot sprite consists of hair at the top, a head, and lower tendrils, and its horizontal extent is from 5 to 10 km, while the columniform sprite has a very fine spatial struc- ture and is a fast, a few milliseconds, phenomenon com- pared to the carrot sprite. However, there have been very lacking observational studies on the sprite morphology even for continental summer sprites and morphological differ- ences with respect to the parent lightning characteristics.
[
4] In addition to so many sprites for continental summer lightning, sprites were also observed on the coast of Sea of Japan in winter for the first time by Fukunishi et al. [1999]
even though an average cell size is relatively small of the order of a few tens of km [Hayakawa et al., 2004, 2005, 2006, 2007a], and then later observations followed [Hobara
1Department of Electronic Engineering, University of Electro- Communications, Tokyo, Japan.
2Kyusyu Institute of Technology, Kitakyushu, Japan.
3Air Weather Group, Japan Air Self-Defense, Tokyo, Japan.
Copyright 2008 by the American Geophysical Union.
0148-0227/08/2007JA012528
et al., 2001; Adachi et al., 2002; Hayakawa et al., 2004, 2005; Hobara et al., 2006]. The most interesting finding for Japanese winter sprites is their much simpler structure than the continental summer ones. That is, a majority of winter sprites (with the average percentage of 85% during the winter of November, December, January, and February) are found to be of column structure (columniform type) [Hayakawa et al., 2004]. Then a fundamental question arises: what is the essential factor to determine the morphological structure of a sprite?
[
5] Very few papers are devoted to the morphological difference of sprites. Pasko et al. [1997b] suggested a hypothesis that the neutral density is nonuniform because of the gravity wave launched by the updraft associated with the mesoscale convective system (MCS). Valdivia et al.
[1997] supposed that electromagnetic waves launched from many branches of the horizontal part of the lightning discharge interfere at the upper atmosphere and produce a nonuniform distribution of electric field. Cho and Rycroft [2001] have theoretically studied this kind of wave inter- ference effect of a horizontal lightning discharge and have tried to explain the morphological difference of sprites.
These all were based on the nonuniformity of the electric field in the upper atmosphere due to complicated lightning configurations, but no study has been done on the sprite morphological difference in the most fundamental and simple lightning configuration.
[
6] In this paper, we try to investigate the following few fundamental questions. (1) Is there any threshold in the initiation of Japan winter and summer sprites with thinking of typical Japanese lightning discharges because winter storms in Japan are very different from summer storms there and in United States in their dynamical behavior and vertical extent [Williams and Yair, 2006]? (2) How about the comparison with better-resolved characteristics of sum- mer sprites in the continents like in United States? (3) What are the important physical parameters of a parent lightning discharge in the initiation of sprites? (4) What is the key parameter of the parent lightning in determining the morphological difference of sprites (mainly columnar structure in winter [Adachi et al., 2002; Hayakawa et al., 2004] and mainly carrot-type in summer in Japan (not so well documented yet, but our own observations suggest that a majority of sprites in summer are carrots)? Even by using the simple two-dimensional (2-D) lightning structure [Cho and Rycroft, 1998], we try to study the above- mentioned fundamental questions in determining the initi- ation and morphological difference of sprites (carrot or column) by assuming Japanese winter and summer light- ning discharges because when the behavior of Japan winter storms is clarified, the understanding of cloud electrification in general would be much improved as indicated by Williams and Yair [2006].
2. Computer Simulations on Sprites 2.1. Fundamental Formulation
[
7] There have been proposed two different codes to solve the sprite problem: (1) electrostatic (ES) code [Pasko et al., 1995, 1997a] and (2) electromagnetic (EM) code [Cho and Rycroft, 1998, 2001], but we use, in this paper, the more general EM code. The details of the computational
modeling are given by Cho and Rycroft [1998], but we repeat only the important things for the subsequent discus- sion. The following basic equations are
r E¼ @B
@t ð1Þ
r B¼m0e0
@E
@tþm0j ð2Þ
j¼sEþjt ð3Þ
where E is electric field, B is magnetic field, j is current density, and j
tis the lightning stroke current density. Here e
0and m
0are the dielectric constant and permeability of free space, and s is conductivity.
[
8] The electric conductivity s is modeled by the follow- ing equation:
s¼e2 me
ne
nnhQvimþsi ð4Þ
where e and m
eare electric charge and mass of electrons, n
eis electron density, n
nis neutral particle density, h Qvi
mis the momentum transfer due to the collision of electrons with neutral particles, and s
iis the conductivity due to ions. The first term in equation (4) refers to electrons, while the second term refers to ions. The ionic conductivity s
iand the neutral density n
nare functions of only height (z). However, the electron density n
eand the collisions rate h Qvi
mare known to vary depending on the value of reduced electric field, E/n
nat each grid point. The collision rate is approximated by Cho and Rycroft [1998].
[
9] The initial condition for n
e(in m
3) is given by
neð Þ ¼z
0:08 exp
ðz=4:3 kmÞ ðz<105 km
Þneð Þ ¼z neðz¼
105 km
Þ ðz105 km
Þ 8<: ð5Þ
Of course, we know a significant seasonal variation of electron density in the F and E layers [Davis, 1999].
However, the seasonal effect of the D region electron density is not so significant as compared with E and F layers [Davis, 1999] and also the D region profile is found not so important in the following computations. So, we take the same profile of equation (5) for both summer and winter.
[
10] Next, the initial condition for the electronic conduc- tivity can be calculated by substituting this electron density profile into equation (4). As the atmosphere above a thunderstorm is heated either by the QE electric field or the EM pulse, we expect an increase in electron density. The electron density is calculated by integrating the following continuity equation,
@ne
@t ¼nnhQviion0:2hQviatt
ne ð6Þ
where h Qvi
ionand h Qvi
attare ionization and attachment rates, respectively [Raizer, 1991]. The factor 0.2 comes from the assumption that we consider only the attachment to oxygen molecules. These collision rates as well as hQvi are given as functions of electron temperature, which is also given as a unique function of the reduced electric field (E/n
n). So, the collision rates are given as functions of E/n
n. [
11] While we solve for the electric field and the electron density, the optical emission is calculated by the following equation,
@nex
@t ¼nN2hQviexnenex
td
nqnex ð7Þ
where n
exis the density of nitrogen molecules excited to an upper electronic level, h Qvi
exis the excitation collision rate, t
dis the decay time, and n
qis the quenching rate. For a particular optical emission, the optical emission energy per unit volume per unit time is given by n
ex/t
d. We solve equation (7) for two optical emission bands. One is the nitrogen first positive band which decays from B
3P
gto A
3P
u
+
at t
d= 8 ms and gives optical emissions of red color.
The other is the nitrogen second positive band which decays from C
3P
uto B
3P
gat t
d= 38 ns and gives optical emission of blue color.
[
12] Now we make an assumption for parent lightning discharges. We assume that a lightning return stroke current begins to flow at t = 0 before the lightning discharge occurs, and the thundercloud charge must be accumulated. Because this process is slow as compared with the relaxation time of the upper atmosphere, the surrounding space charge adjusts itself to alter the electric field induced by the thundercloud charge. We must take into account this fact to calculate the initial conditions for the EM code.
[
13] We assume that the thundercloud charge r
tis built up linearly from t = t
0(t
0should be large enough) to t = 0 with the Gaussian distribution.
rtðr;z;tÞ ¼rto tþt0
t0
exp
r2 r02
exp
ðzzþÞ2 z20!
zþdz<z<zþþdz;r<dr
ð Þ
rtðr;z;tÞ ¼ rt0 tþt0
t0
exp
r2 r20
exp
ðzzÞ2 z20!
zdzzzþdz;rdr
ð Þ
where r
t0is given by
ð8Þrt0¼ Q
2pr
20z01 exp
ðdr=r0Þ2 Z dz=z00
exp
s2 dsð9Þ
with Q as the total charge flowing in the stroke current. This distribution gives a positive charge confined within a disk whose center is located at z = z
+and r = 0 and z
0and r
0are the spatial scales in z and r directions. The radius and thickness of the disk are given by dr and 2dz, respectively.
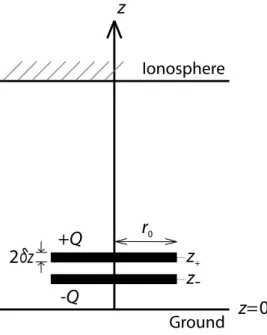
The negative charge is confined within a similar disk centered at z = z
and r = 0. The electric charges within the two disks are +Q for the upper disk and Q for the lower disk. The configuration of lightning is given in Figure 1.
Figure 1 illustrates the real dipole structure of lightning, but in the following computations we have used the removal of monopole charges (either positive or negative) because Pasko et al. [1997a] concluded that the results obtained for the removal of monopole charges is essentially identical above 60 km altitude to those for the more realistic dipole configurations as expected, since the electric field at high altitudes is defined mainly by the value of the removed charge and its altitude, independent of the charge config- uration inside the cloud before and after the lightning discharge. Between t = t
0and t = 0, we calculate the electric field surrounding the thundercloud by the ES code and use the electric field at t = 0 as the initial condition for the EM code.
[
14] After the discharge (t 0), the thundercloud charge is assumed to decay according to the following continuity equation:
@rt
@t ¼ @
@zjtz ð10Þ
In the case of a positive CG discharge, the discharge current is given by
jtðr;z;tÞ ¼
0
ðz>zþþdzÞ jtðr;z;tÞ ¼ rt01
12 1
tt
t
exp
t t1
2
exp
r2 r20
Z zþþdz z
exp
ðzzþÞ2 z20!
dzez ðzþdz<z<zþþdzÞ
jtðr;z;tÞ ¼rt0
1 12
1
tt
t
exp
t t1
2
exp
r2 r02Z zþþdz
zþdz
exp
ðzzþÞ2 z20!
dzez ðz<zþdzÞ ð11Þ
Figure 1. Configuration of a lightning discharge, where z
+and z
are heights of positive and negative charges, ±Q is
charge, r
0is horizontal scale of a thundercloud, and 2dz is
total thickness of the charge layer.
where e
zis a unit vector in z direction and t indicates the timescale of rise and relaxation of the current. By integrating j
tat z = 0 in the horizontal direction, we can calculate the lightning stroke current to the ground. It is given by
I zð ¼
0;
tÞ ¼Q1 12
1
tt
t
exp
t t1=2
ð12Þ
Ipeak¼I zð ¼
0;
t¼4t
Þ: ð13ÞOur current model is different from previous models characterized by several parameters [e.g., Nickolaenko and Hayakawa, 2002], but the waveform by our model can approximate any of the previous currents. The most important property of our model is that we can control the shape of the current pulse by only two parameters Q and t, which is the reason why we adopt this model. In the case of a negative CG discharge, the current j
tgrows only below z
+ dz with a similar horizontal distribution as for the positive CG discharge. The current density j
tis substituted into equation (3). So, we solve equations (1) – (4) and equations (6) and (7) for the EM code, which provides us with the self-consistent determination of the temporal evolution of different physical parameters (reduced electric field, optical emissions, etc.).
2.2. Numerical Computation Method
[
15] For the EM code we use a simple and fundamental axisymmetrical 2-D cylindrical coordinate system (radial distance r and vertical height z), and the size of each grid is Dr = Dz = 1 km. We use the reflecting boundary condition at z = 0, and the absorbing boundary conditions of Mur’s second order [Mur, 1981] are applied at z = 128 km and r = 300 km. In this paper we pay a lot of attention to fast variations (e.g., even a small t 10 ms) as well, so that the EM code is more preferable.
3. Computational Results for Japan Winter and Summer Lightning Discharges
[
16] The parameters associated with the parent lightning discharge as seen in Figure 1 are (1) r
0, (2) dz, (3) z
+and z
, (4) Q, (5) t, and (6) polarity. The first two parameters are related to the configuration of the thundercloud (radius r
0and thickness dz). The third parameter is the height of charges to be removed by the lightning discharge, and the fourth parameter, Q, is the magnitude of the removed charge. The fifth parameter t is the time constant which determines the rate at which the charge is transferred to the ground. The last parameter is the polarity indicating which
charge (positive or negative) is removed to the ground. By changing these parameters, we try to identify which param- eter is of essential importance in the initiation of sprites and in distinguishing the morphology of sprites (carrot or column). As described in previous section, we can study different aspects of sprites; electron density change, optical emission, etc. However, in the following we pay attention only to the sprite initiation by looking at the reduced electric field and electric field, so the details on the optical emis- sions and electron density changes will be discussed in separate papers.
[
17] The estimation of the threshold of optical emission is based on the threshold of breakdown of the atmosphere, which is E/n
n> 1 10
19[V/m
2] and which is defined by the equality of the ionization and dissociative attachment coefficients [Raizer, 1991] (as is used by Cho and Rycroft [1998] and also by Hiraki and Fukunishi [2006]). So, we use this threshold in reduced electric field, E/n
nin the sprite initiation problems.
[
18] In order to simulate the summertime and wintertime lightning discharges in Japan, we take the following con- ventional parameters for both as summarized in Table 1. Of course, we know that summer midcontinental sprites are believed often to come from the stratiform portion of storms that have complex multilayer charge structure [Lyons et al., 2003], much more complex than our simple model here.
The vertical charge structure for Japan summer lightning is poorly understood. There have been no reports on the MCSs with stratiform region for Japan summer lightning, so the simple bipolar structure (as used by Pasko et al. [1997a]) for modeling continental summer lightning) seems accept- able, and the height of positive charge for Japan summer lightning is estimated to be z
+10 km [Hatakeyama, 1958;
Takagi, 1961; Ogawa, 1982; Society of Atmospheric Elec- tricity of Japan, 2003]. As for the Japan winter lightning, recent studies by Suzuki et al. [2006] and Morimoto et al.
[2005] have suggested that the height z
+is around 4 km as in Table 1. Its spatial scale is based on our previous radar study [Hayakawa et al., 2004, 2006, 2007a]. It is already known from the optical measurements [e.g., Rodger, 1999; Lyons, 2006] that a sprite takes place after 1.5 ms from the lightning discharges, with the vast majority being in the range of 2 – 15 ms. We pay our particular attention to the time evolution mainly from t = 0 to a few ms in our computations.
[
19] We compute the reduced electric field, E/n
nand we study its spatiotemporal evolution. We investigate the effect of different physical parameters in Figure 1 by changing one parameter with others remaining fixed, in order to understand which is the essential factor in determining the initiation of sprites and the morphological differences between summer and winter lightning, to be compared with our latest
Table 1.Physical Parameters of Japan Summer and Winter Lightning Models
Cloud Radius Charge Height Charge Transfer Risetime
r0, km dz, km z+, km z, km Q+, C Q, C t,ms
Summer model 50 5 10 5 +100 100 25
Winter model 25 4 4 2 +100 100 25
[Hayakawa et al., 2004; Hobara et al., 2006] and future observational results.
3.1. Effect of Changing r
0(Cloud Radius)
[
20] We have studied the spatiotemporal distribution of the computed E/n
nfor different values of r
0(r
0= 25, 30, 40, and 50 km for summer and r
0= 25, 30, 40, and 50 km for winter, as well). Of course, we can notice a difference in the
computed E/n
nbetween summer and winter for a fixed r
0, but the effect of changing r
0is found to be too insignificant to identify.
3.2. Effect of dz (Cloud Thickness)
[
21] The cloud thickness dz is changed from dz = 3, 4, 5, and 6 km in the computations, while other parameters are fixed as in Table 1. By looking at the spatiotemporal Figure 2. Spatial distribution of reduced electric field (E/n
n) at a sample delay time (t = 1.5 ms) from
the lightning discharge with Q = +100 C and t = 25 ms. We change from (a) z
+= 4 km, (b) z
+= 6 km,
(c) z
+= 8 km, to (d) z
+= 10 km, with other parameters as given in Table 1 (summer model). The area with
enhanced E/n
nexceeding 1.28 10
19Vm
2is given in white. Also shown is (e) the enlarged part of
Figure 2a just overhead of the discharge with a narrow bright band at 77 km.
distribution at a sample delay time of t = 1.5 ms, we have found that there is a small difference in the computed E/n
nbetween summer and winter situation for the same dz.
However, it is found that changing dz did not affect the overall distribution of the reduced electric field, E/n
nvery much.
4. Significant Effects of Charge Height (z
+, z
), Charge Transfer (Q), and Time Variation (t) in the Sprite Initiation and Morphogical Differences Between Summer and Winter Sprites
[
22] As already described in previous section, the effects of r
0and dz are found to be not so important. Here, we have found that the sprite characteristics are mainly controlled by a few important parameters z
+(or z
), Q (charge) and t, as already found by Pasko et al. [1997a, 1997b]. We have prepared one particular section to discuss these effects on the initiation of sprites and their morphological character- istics in more details.
4.1. Effect of the Height of Charge Removed (z
+, z
) 4.1.1. Optical Emissions (or Reduced Electric Field, E/n
n)
[
23] First of all, we discuss the most important parameter of the height of charge removed and its effect on the optical emission parameter, E/n
n. We only treat the summer light- ning (as in Table 1) to estimate the effect of charge height.
Figure 2 illustrates the spatial distribution of E/n
nonly in a height range up to 100 km and in a radial radius less than 150 km at the same sample delay time of t = 1.5 ms, with changing z
+= 4 km (Figure 2a), z
+= 6 km (Figure 2b), z
+= 8 km (Figure 2c), z
+= 10 km (Figure 2d) with other parameters remaining the same as in Table 1. A glance at Figure 2 indicates clearly that the effect of changing z
+is very significant in sprite initiation and its structure.
[
24] When we look at Figure 2, we find that when the height of charge removed (z
+) increases, the area with enhanced reduced electric field, is found to extend in the radial direction with a radius of about 30 km. When E/n
nis greater than 1.28 10
19[Vm
2], we expect the breakdown and this region is indicated in white in Figure 2. While for the lower z
+, the corresponding area with enhanced reduced electric field is found to shrink as expected. This suggests that the height of the charge transferred to the ground (z
+) is of essential importance in sprite initiation and sprite struc- ture because as is given by Pasko et al. [1997a] and Hiraki and Fukunishi [2006] that the electric field at the lower ionosphere is proportional to the charge transfer (Q) multi- plied by z
+(the product is called charge moment change). In spite of this particular difference in the higher E/n
nregion for higher z
+, we have found that the region with E/n
nexceeding the threshold of 1 10
19[Vm
2] is always of the order of 2 km in radius for any z
+. This region with the enhanced region of E/n
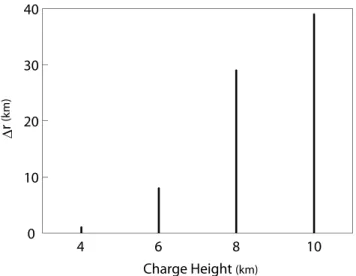
nin Figure 2a is enlarged in Figure 2e to show the narrow brite region around x = 0. Figure 3 is the summary of the radial extent (Dr) when the reduced electric field exceeds a certain threshold (E/n
n4 10
20Vm
2) at the height of 80 km and at the same delay time of 1.5 ms.
This threshold is taken as one half of the halo threshold defined by Hiraki and Fukunishi [2006]. Figure 3 suggests that the wider area of enhanced reduced electric field for higher z
+is considered to be favorable for subsequent breakdown after the sprite initiation, which can be consid- ered as being closely related with the complexity of sprite configuration such as the carrot structure, while only the core area with a radius of 2 km is subject to sprite initiation for smaller z
+in Figure 3 (and Figure 2), for which we expect the simpler structure of sprites like columnar struc- ture, although Wescott et al. [1998] showed that column sprites tend to occur in multiples.
4.1.2. Charge Moment
[
25] We have understood that the charge height (z
+or z
) plays an essential role in the initiation and morphology of sprites, and we estimate the threshold of charge transfer (Q) by judging whether there would appear any area with the reduced electric field exceeding the breakdown criterion of E/n
n> 10
19[Vm
2], with keeping the charge structure being constant. The delay time to estimate the Q threshold is taken to be t 1.3 ms after the lightning discharge. Our computations show that when t < 1.3 ms, we find some variability in the altitude with breakdown for different charge heights, but we have found that the altitude of peak E/n
nfor t > 1.3 ms till a few milliseconds is rather stable even for changing heights. This is the reason why we use 1.5 ms as a sample delay time.
[
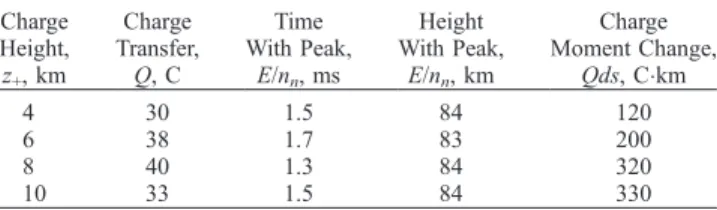
26] By defining the charge moment (Qds) as Q multi- plied by z
+, we estimate the threshold of this charge moment and the result is summarized in Table 2. Even though we change the height z
+as in Table 2, we expect the sprite initiation at any z
+when the Q value exceeds 40 C. The threshold of inducing sprites is summarized in Table 2. For larger z
+(such as 8 km and 10 km), the threshold of charge moment is found to be around 300 Ckm. However, the threshold Qds becomes about 120 – 200 C km for much smaller z
+(as 4 km and 6 km) values, which seems to correspond to the Japanese winter sprites [Hobara et al., 2001, 2006; Hayakawa et al., 2004, 2005]. We, however, Figure 3. Summary of the radial extend (Dr) of reduced
electric field exceeding a threshold ( 4 10
20Vm
2) at a
specific height of 80 km and at a sample delay time of
1.5 ms. This is based on Figure 2 and is intended to indicate
the dependence of optical emission area size on the charge
height.
have to mention that one important parameter, t is fixed to 25 ms in the above computations, and the important role of t will be discussed later. Also, these results are valid for only a small subset of possible sprite delay times (up to a few milliseconds).
4.1.3. Electric Field Intensity
[
27] Though not shown as figures, we study the spatial distribution of electric field itself at the same sampling delay
t = 1.5 ms for the charge heights, z
+= 4, 6, 8, and 10 km.
Being consistent with the spatial distribution of optical emissions (or reduced electric field), it is found that stronger electric field is observed in a wider height range and also in a wider radial distance in the case of higher charge heights, while the strong electric field is extremely limited just above the lightning discharge, within a radius of about 2 km.
4.2. Effect of Q (Charge Transfer)
4.2.1. Optical Emissions (Reduced Electric Filed) [
28] Next, the effect of changing Q over a wide range is investigated for both polarities (positive and negative): Q = 10, 50, 100, and 200 C and Q = 10, 50, 100, and 200 C. Figure 4 illustrates the results on optical emission (or reduced electric field, E/n
n) for positive discharge (Q >
0) for the summer lightning model in Table 1, while Figure 5, the corresponding plots for positive winter light- ning model. The summer and winter models mean that the cloud structures for both models are specified as in Table 1
Table 2.Summary of the Height With Peak
E/nnand Charge
Moment Change for Different
z+Charge Height, z+, km
Charge Transfer,
Q, C
Time With Peak,
E/nn, ms
Height With Peak,
E/nn, km
Charge Moment Change,
Qds, Ckm
4 30 1.5 84 120
6 38 1.7 83 200
8 40 1.3 84 320
10 33 1.5 84 330
Figure 4. Spatial distribution of reduced electric field (E/n
n) at the time (t = 1.5 ms) from the lightning
discharge (summer positive case). The charge (Q positive) is changed from (a) Q = 10 C, (b) Q = 50 C,
(c) Q = 100 C, to (d) Q = 200 C. Other parameters are given as summer model in Table 1. The color code
is the same as in Figure 2.
with those parameters. All of the figures are obtained at t = 1.5 ms. A comparison of these figures is indicative that even though we observe a difference in the spatial distribution of optical emissions between summer and winter models, we conclude that the area with enhanced optical emission (or E/n
n) expands simply with the increase in the value of Q.
[
29] We here comment on the corresponding results for negative polarity (although not shown as figures). The same conclusion is obtained on the significant effect of increasing j Q j on the expansion of enhanced reduced electric field. A small difference is noticed either for summer or winter in the distribution, but this is entirely due to the different height of charge as in Table 1.
4.2.2. Electric Field
[
30] Here we study the electric field distribution by changing the Q. When we plot the distribution of absolute value of electric field jEj, we have found that the spatial distribution of j E j at t = 1.5 ms is exactly the same for both Q = 100 C and Q = 100 C assuming the same charge altitude. This means that the initiation of sprites is very possible for large Q irrespective of the polarity (polarity independent).
4.3. Effect of t (Risetime in Lightning Current) [
31] Of course, the charge transfer (Q) is interrelated with the lightning current waveform (t) through equations (11) and (12). Here, we investigate the effect of lightning current risetime (t) on the optical emission, and we have changed the value of t in a wide range of t = 15 ms, 25 ms, 35 ms to 100 ms (= 0.1 ms). Figure 6 is the computational result on the effect of t on the reduced electric field, with keeping the charge transfer (Q) to be +100 C only for the summer lightning. First of all, we need some explanation on the spatial distribution in Figure 6. Look at Figure 6a, in which there are two distinct regions; one bright area around r = 0 and another height area at r 100 km. The former corresponds to the sprite, while the latter corresponds to an elve. Because we understand that this elve is propagating clearly outward with the increase in time (thought not shown as figures). A comparison of images in Figure 6 is suggesting that a smaller t might result in more enhance- ment in the optical emissions. Larger t values lead to the smaller enhancement in the optical emissions. This conclu- sion is very consistent with the recent result by Hiraki and Fukunishi [2006] even based on the ES code, though their Figure 5. Same as Figure 4, but for the case of winter positive CGs. Other parameters are given in the
winter model in Table 1. The color code is the same as in Figure 2.
paper is considered to be a further extension of the idea by Adachi et al. [2004].
[
32] The same conclusion can be obtained for the sum- mer, negative Q, which indicates the polarity-independent property.
5. Concluding Remarks and Discussion
[
33] Our primary objectives of this paper were (1) to investigate the lowest threshold of charge moment change for initiation of sprites, especially winter sprites in the Hokuriku area of Japan in relation to Japan summer sprites, and (2) what are the key physical parameters in distinguish- ing morphological differences between Japanese winter and summer sprites (in other words, columnar and carrot-type sprites). As for the second problem, there have been suggested a few mechanisms; one is the gravity wave effect resulting in the nonuniform distribution in n
n[Pasko et al., 1997b] and others are due to the wave-interference effects [Valdivia et al., 1997; Cho and Rycroft, 2001]. Not adopting
these complicated lightning configurations, these problems are tackled in this paper for a simple and conventional bipolar lightning structure as in Table 1 by means of a 2-D axisymmetric EM code. Of course, we know that summer continental sprites come from the stratiform region of storms that have complex multilayer change structures (four to eight layers) [Lyons, 2006]. This complex thunderstorm is much more complex than the simple one in this paper.
However, as we have already described before, the bipolar structure and the physical parameters (charge structure and charge height) of Japan summer and winter lightning models, seem not so unrealistic [Society of Atmospheric Electricity of Japan, 2003]. The storm sizes used for Japan summer storms are very inconsistent with those repeatedly reported in the literature for summer continental lightning.
Most summer MCSs in the continents rarely produce sprites unless the size is at least 10,000 km
2[Lyons et al., 2003].
The samples used in Table 1 for Japan summer lightning are all smaller than the minimum for the summer continental storms, but these sizes are also supported by previous Figure 6. Spatial distribution of reduced electric field (E/n
n) at t = 0.5 ms after the lightning discharge
for summer positive. Q is fixed at Q = 100 C, but the risetime of discharge current (t) is changed from
(a) t = 15 ms, (b) t = 25 ms, (c) t = 35 ms, to (d) t = 100 ms (0.1 ms). Other parameters are those for
summer model in Table 1. The color code is the same as in Figure 2.
studies [Hatakeyama, 1958]. Also, the size of Japan winter lightning is supported by our recent studies [Hayakawa et al., 2004, 2006, 2007b; Suzuki et al., 2006]. By changing the physical parameter of a lightning discharge (such as z
+, z
, r
0, dz, Q (+ or ), t), we have tried to sort out what are the essential parameters in the initiation of sprites and morphological difference in sprites in winter and summer in Japan by studying the reduced electric field (E/n
n). The following conclusions have emerged from the present study based on the 2-D lightning model.
[
34] 1. Among many physical parameters associated with lightning structure, the two parameters r
0and dz are very unimportant, and other parameters (z
+(or z
), Q (positive or negative) and t) are confirmed to be very essential in the initiation of sprites and morphological difference of sprites, as is already found by Pasko et al. [1997a].
[
35] 2. First, we can list the following conditions for the initiation of sprites in the mesosphere. For a possible range of charge height (z
+), we expect the initiation of sprites when the charge transfer (Q) exceeds 40 C (but with a typical lightning risetime of t = 25 ms), and, as the result, the corresponding lowest threshold of charge moment is 120 – 200 Ckm. For typical charge heights and current risetimes, the maximum electric field (or sprite occurrence) is found to take place at the height 80 km and about 1.5 ms after the lightning discharge.
[
36] 3. The charge transfer (Q) is a very important quantity for inducing sprites; that is, we have an enhance- ment of sprite initiation with higher Q value. However, in this case, we assume that the lightning rise is of the order of 25 ms.
[
37] 4. The values of Q and lightning current waveform are closely interrelated, but the value of t is of essential importance in the initiation of sprites. The condition for t to have initiation of sprites is smaller t value (such as t = 25 ms) in good agreement with Hiraki and Fukunishi [2006], and when we have larger t values, we observe a small probability of sprite initiation.
[
38] 5. One comment on the charge polarity is made here.
Our computations indicate that there is no charge asymme- try in the sprite initiation. If all parameters are the same (e.g., same charge height, same Q, and same t), the condition of initiation of sprites is completely the same, with no polarity asymmetry.
[
39] 6. Morphological difference in carrot-type and co- lumnar structure might be explained as follows. When we think of summer and winter lightning discharges in Japan, the most essential difference between the two is closely related with the change in the height of charge removed (z
+10 km in summer and z
+a few kilometers in winter).
This height difference is likely to be the essential physical parameter in distinguishing the carrot and columnar type.
[
40] Here we discuss our conclusions derived from the present EM computer simulations, with special reference to previous works. It is generally agreed that the charge transfer (Q) is mainly positive and the charge moment (Qds) should exceed a certain value. For example, Huang et al. [1999], Hu et al. [2002], and Cummer and Lyons [2005] suggested the lowest threshold of 300 Ckm, and also Lyons et al. [2003] have suggested 600 Ckm and
above as the threshold (these all refer to continental summer sprites), while Hobara et al. [2001] and Hayakawa et al.
[2004] have suggested 200 Ckm for Japan winter sprites.
The ELF observation is known to provide us with the information only on the charge moment as a product of charge transfer with the charge height. However, as is concluded in our computer simulations, we understand that a separate consideration of charge transfer (Q) and charge height (z
+or z
) is required and that charge moment is simply a consequence (i.e., Qz
+). In a possible range of z
+(we assume positive CG), we need a minimum Q of 40 C with a supposition of t = 25 ms, and we have, as the consequence, the lowest threshold of 120 – 200 Ckm.
However, we have to remember that the risetime of light- ning current waveform is assumed to be sufficiently small and typical, t = 25 ms, as summarized as point 4. Our theoretical expectations seem to be in good agreement with earlier observational results. As is already pointed out by the ES code by Pasko et al. [1997a], there are three important lightning parameters; z
+(or z
), Q (+ or ), and t.
However, they studied the former two parameters very extensively but no so much on the last parameter. This present paper has given the more quantitative estimation than Pasko et al. [1997a].
[
41] We now refer to a recent and very interesting paper by Hiraki and Fukunishi [2006], who suggested the impor- tance of the discharge time in the initiation of sprites, that is, the effect of t in this paper. We have found as point 4 that the risetime of lightning current waveform (t) should be small enough to initiate a sprite (i.e., smaller t value). With keeping the Q value as constant, smaller t value suggests that the peak amplitude of the discharge current is more enhanced (more enhanced current moment). On the basis of the ES code, Hiraki and Fukunishi [2006] have paid special attention to this effect of lightning discharge time, and as the consequence of their simulations they have obtained the following approximate criterion.
Qzs
ð Þ2 ts
¼ðIzsÞðQzsÞ ¼
const
¼1:6 10
6ðAkm
ÞðCkm
Þ ð14ÞHere t
sis their definition of discharge time, so that this t
sis
related closely with our risetime t as follows, for example,
t
s= 4 t (the time of maximum (peak) current, I) or t
s=
10 t. Here, I is defined approximately as I = Q/t
s. By
using equation (13), they have insisted that smaller t
sresults in the initiation of sprites (just by looking at the
electric field exceeding the threshold, without examining
the spatial-temporal evolution of reduced electric field as
in our paper), which is completely consistent with our
conclusion (4). This point is not so much investigated by
Pasko et al. [1997a]. Equation (13) is informative that the
two quantities are involved in the criterion of initiation of
sprites; the first term refers to the current moment, and
the second refers to the charge moment. In other words,
we can call the first term the elve factor because this is
known to be influential in the generation of elves
[Nickolaenko and Hayakawa, 1995; Inan et al., 1996],
and the second term may be called the sprite factor
because this is already known to be, at least, a physical parameter of sprite generation. There is a general question on sprites; is large charge moment (Qz
s) a necessary and sufficient condition for sprites? We can answer this question as follows; our computer simulation result and also Hiraki and Fukunishi’s conclusion indicate that Qz
sis only a necessary condition but not a sufficient condition.
The sufficient condition should be further requirement of smaller t value (in other words, larger Iz
s) in equation (13).
[
42] Larger t values indicate less chance of sprites as one of the most important conclusions from our computer simulations. This theoretical conclusion seems to be in contradiction to the larger risetimes associated with positive CGs, the almost exclusive producer of sprites as is already concluded for the continental summer lightning [e.g., Lyons, 2006]. Here we comment on this discrepancy with special reference to the extensive continuing currents. As is already shown by equation (13), the elve factor (Iz
s) and sprite factor (Qz
s) are equally important in having sprites; that is, a combination of these two factors is the key in sprite initiation. We can suggest the following scenario to com- prise between our computer simulation results (the impor- tance of smaller t) and observational facts on the importance of continuing currents as suggested by Lyons [2006]. The model of lightning current used in this paper is too simple to reflect the real situation. We propose to modify the current model in such a way that any fast variation with smaller t (like M-components [Rakov and Uman, 2003]) is superimposed on the continuing current with larger t. That is, the sprite factor (QE field and continuing current) in equation (13) acts as having a function of seed (or embryo) to organize the upper envi- ronment to be ready for sprites, while the elve factor (fast variations like M-components as surges superimposed on the continuing current) in equation (13) acts as a trigger of sprites. Of course, the nature of equation (13) on the combinational effects of elve and sprite factors suggests that the role of two factors can be interchanged such as the elve factor (higher frequency variations) as the seed and the sprite factor (QE field) as the trigger of sprites.
[
43] Next, we comment on the polarization asymmetry [Williams, 2006; Williams et al., 2007]. It is generally known that sprites are easily triggered by +CG, with few exceptions by CGs for continental summer lightning [Barrington-Leigh et al., 1999; Lyons, 2006] and several exceptions by CGs for Japan winter lightning [e.g., Suzuki et al., 2006; Matsudo et al., 2007]. However, our computer simulations indicate that exactly the same effect of break- down takes place in the upper mesosphere irrespective of + or CG on the supposition of the same charge height (i.e.
polarity independent). The real lightning charge distribution itself is characterized by positive charges in the upper level and negative charges in the lower level. Our computer simulations may indicate that this observational fact of the notable lack of CG sprites is simply a matter of negative CGs so rarely having large Q and of its characteristic much lower height of negative charges. An additional factor might be the absence in the CGs of continuing currents with M- component like fast variations.
[
44] Then, we address our second important questions, how to explain the morphological difference of sprites in
winter and summer (or carrot-type in summer, but nearly colummar structure in winter). Our computer simulations suggest that the charge height (z
+, z
) is the most influential parameter in distinguishing carrot-type or columnar struc- ture. That is, the much simpler structure (column) is definitely as the consequence of much smaller z
+(than the summer time charge height, z
).
[
45] In the following we would like to suggest some future work to do. Especially we want to point out some latest observational results on the fine structure of lightning discharges in relation to sprites generation. Our recent work by Matsudo et al. [2007] for Japanese winter sprite indicates very complicated charge structures only for Japanese winter lightning because one half of the sprite events are found to be associated with +CG by the SAFIR VHF system as well, but another half has yielded rather surprising results, some definitely associated with CG and the remaining associ- ated with intercloud flashes. Though all are identified as +CG by the ELF waves. There have been recently several attempts to investigate the microphysical and electrical properties of sprite-producing thunderstorms by means of coordinated measurements [Lyons et al., 2003; Suzuki et al., 2006]. Williams and Yair [2006] have suggested the impor- tance of spider lightning even for continental summer sprites. Suzuki et al. [2006] have investigated the meteoro- logical and cloud conditions for sprite-producing thunder- storms and those clouds can be described as ‘‘flat-topped stratiform, extending extensively horizontally.’’ The char- acteristics on lightning, as seen in VHF, seem to provide us with the information on the elve factor in equation (13).
[
46] The sprite morphology problem has recently been discussed by van der Velde et al. [2006], who have suggested that column sprites are associated with little VHF activity, suggesting no direct intracloud action, while carrot sprites are accompanied by a burst of VHF activity as indicating the intracloud activity. Additionally, Ohkubo et al. [2005] have indicated VLF/ELF sferics indicative of in- cloud discharge activity in association with sprite genera- tion. However, unfortunately the relation with sprite mor- phology has not been presented. We think that these VHF (and VLF/ELF) activity might be closely related with the microphysical details in the electrical structure in the preparatory process of sprites. These high-frequency activ- ities might provide the information on the elve factor (Ids) in equation (13), and so the above papers are indicative of the significance of a combinational effect of the elve factor with the slowly varying effect (such as QE field) of the sprite factor in equation (13).
[
47] In future we intend to perform the computer simu- lations with the much more realistic lightning current model with M-component-like variations being superimposed (as already mentioned before). The complication of inclusion of fine electrical processes (not only fast temporal evolution like M components but also small-scale spatial structure (as given by Iudin et al. [2003] and Hayakawa et al. [2007b]) and much more realistic 3-D structures should be taken into account in the forthcoming computer simulations.
[
48]
Acknowledgments. The authors are grateful to Y. Hiraki of Kyoto University for his extensive discussion. This work is, in part, supported by Sekisui Chemical Foundation, to which we are grateful, andthanks are also due to National Institute of Information and Communica- tions Technology (NiCT) for its support (R and D promotion scheme funding international joint research).
[
49]
Zuyin Pu thanks the reviewers for their assistance in evaluating this paper.References
Adachi, A., H. Fukunishi, and Y. Takahashi (2002), Characteristics of sprites and their parent thunderstorm systems in winter of Japan,Eos Trans. AGU,83(47), Fall Meet. Suppl., Abstract A11C-0106.
Adachi, T., H. Fukunishi, Y. Takahashi, and M. Sato (2004), Roles of the EMP and QE field in the generation of columniform sprites,Geophys.
Res. Lett.,31, L04107, doi:10.1029/2003GL019081.
Barrington-Leigh, C. P., U. S. Inan, M. Stanley, and S. A. Cummer (1999), Sprites triggered by negative lightning discharges,Geophys. Res. Lett., 26, 3605 – 3608.
Cho, M., and M. J. Rycroft (1998), Computer simulation of the electric field structure and optical emission from cloud-top to the ionosphere,J. Atmos.
Sol. Terr. Phys.,60, 871 – 888.
Cho, M., and M. J. Rycroft (2001), Non-uniform ionisation of the upper atmosphere due to the electromagnetic pulse from a horizontal lightning discharge,J. Atmos. Sol. Terr. Phys.,63, 559 – 580.
Cummer, S. A., and W. A. Lyons (2005), Implications of lightning charge moment changes for sprite initiation,J. Geophys. Res.,110, A04304, doi:10.1029/2004JA010812.
Davis, K. (1999),Ionospheric Radio, pp. 126 – 128, Peter Peregrinus, Lon- don.
Fukunishi, H., Y. Takahashi, M. Kubota, K. Sakanoi, U. S. Inan, and W. A.
Lyons (1996), Elves: Lightning-induced transient luminous events in the lower ionosphere,Geophys. Res. Lett.,23, 2157 – 2160.
Fukunishi, H., Y. Takahashi, A. Uchida, M. Sera, K. Adachi, and R. Miyasato (1999), Occurrences of sprites and elves above the Sea of Japan near Hokuriku in winter,Eos Trans. AGU, 80(46), Fall Meet.
Suppl., F217.
Hatakeyama, H. (1958), The distribution of the sudden changes of electric field on the Earth’s surface, inRecent Advances in Atmospheric Electri- city, editied by L. G. Smith, 289 pp., Pergamon, London.
Hayakawa, M., T. Nakamura, Y. Hobara, and E. Williams (2004), Observa- tion of sprites over the Sea of Japan and conditions for lightning-induced sprites in winter, J. Geophys. Res., 109, A01312, doi:10.1029/
2003JA009905.
Hayakawa, M., T. Nakamura, D. Iudin, K. Michimoto, T. Suzuki, T. Hanada, and T. Shimura (2005), On the fine structure of thunderstorms leading to the generation of sprites and elves: Fractal analysis,J. Geo- phys. Res.,110, D06104, doi:10.1029/2004JD004545.
Hayakawa, M., F. Yokose, Y. Ida, and D. Iudin (2006), Multi-fractal ana- lysis for thunderstorms leading to the generation of sprites and elves, J. Atmos. Electr.,26, 51 – 57.
Hayakawa, M., T. Suzuki, T. Nakamura, K. Michimoto, and D. Iudin (2007a), Fractal analysis of radar images of Japanese winter thunder- clouds inducting sprites and its comparison with their corresponding life cycle,J. Atmos. Electr.,27, 113 – 121.
Hayakawa, M., D. I. Iudin, E. A. Marrev, and V. Y. Trakhtengerts (2007b), Cellular automation modeling of mesospheric optical emissions: Sprites, Phys. Plasmas,14, 042902, doi:10.1063/1.2721079.
Hiraki, Y., and H. Fukunishi (2006), Theoretical criterion of charge moment change by lightning for initiation of sprites,J. Geophys. Res.,111, A11305, doi:10.1029/2006JA011729.
Hobara, Y., N. Iwasaki, T. Hayashida, M. Hayakawa, K. Ohta, and H. Fukunishi (2001), Interrelation between ELF transients and iono- spheric disturbances in association with sprites and elves, Geophys.
Res. Lett., 28, 935 – 938.
Hobara, Y., M. Hayakawa, E. Williams, R. Boldi, and E. Downes (2006), Location and electrical properties of sprite-producing lightning from a single ELF site, inSprites, Elves and Intense Lightning Discharges, NATO Sci. Ser., Ser. II, vol. 225, edited by M. Fu¨llekrug, E. A. Mareev, and M. J. Rycroft, pp. 211 – 235, Springer, Dordrecht, Netherlands.
Hu, W., S. A. Cummer, W. A. Lyons, and T. E. Nelson (2002), Lightning charge moment changes for the initiation of sprites,Geophys. Res. Lett., 29(8), 1279, doi:10.1029/2001GL014593.
Huang, E., E. Williams, R. Boldi, S. Heckman, W. Lyons, M. Taylor, T. Nelson, and C. Wong (1999), Criteria for sprites and elves based on Schumann resonance observations,J. Geophys. Res., 104, 16,943 – 16,964.
Inan, U. S., W. A. Sampson, and Y. N. Taranenko (1996), Space-time structure of optical flashes and ionization changes produced by light- ning-EMP,Geophys. Res. Lett.,23, 133 – 136.
Iudin, D. I., V. Y. Trakhtegerts, and M. Hayakawa (2003), Fractal dynamics of electric discharges in a thundercloud,Phys. Rev. E, 68, 016601, doi:10.1103/PhysRevE.68.016601.
Lyons, W. A. (1996), Sprite observations above the U.S. High Plains in relation to their parent thunderstorm systems, J. Geophys. Res.,101, 29,641 – 29,652.
Lyons, W. A. (2006), The meteorology of transient luminous events¯An introduction and overview, inSprites, Elves and Intense Lightning Dis- charges,NATO Sci. Ser., Ser. II, vol. 225, edited by M. Fu¨llekrug, E. A.
Mareev, and M. J. Rycroft, pp. 19 – 44, Springer, Dordrecht, Netherlands.
Lyons, W. A., T. Nelson, E. R. Williams, S. A. Cummer, and M. A. Stanley (2003), Characteristics of sprite-producing positive cloud-to-ground lightning during the 19 July STEPS mesoscale convective systems, Mon. Weather Rev.,131, 2417 – 2427.
Matsudo, Y., T. Suzuki, M. Hayakawa, K. Yamashita, K. Michimoto, V. Korepanov, and Y. Ando (2007), Characteristics of Japanese winter sprites and their parent lightning as estimated by VHF lightning and ELF transients,J. Atmos. Sol. Terr. Phys.,69, 1431 – 1446.
Morimoto, T., Z. Kawasaki, and T. Ushio (2005), Lightning observations and consideration of positive charge distribution inside thunderclouds using VHF broadband interferometry,Atmos. Res.,76(1 – 4), 445 – 454.
Mur, G. (1981), Absorbing boundary conditions for the finite difference approximation of time-domain electro-magnetic-field equations, IEEE Trans. Electromagn. Compat.,23, 377 – 382.
Nickolaenko, A. P., and M. Hayakawa (1995), Heating of the lower iono- sphere electrons by electromagnetic radiation of lightning discharges, Geophys. Res. Lett.,22, 3015 – 3018.
Nickolaenko, A. P., and M. Hayakawa (2002),Resonances in the Earth- Ionosphere Waveguide, 380 pp., Kluwer Acad., Dordrecht, Netherlands.
Ogawa, T. (1982), The lightning current, inHandbook of Atmospherics, vol. 1, edited by H. Volland, pp. 496 – 536, CRC Press, Boca Raton, Fla.
Ohkubo, A., H. Fukunishi, Y. Takahashi, and T. Adachi (2005), VLF/ELF sferic evidence for in-cloud discharge activity producing sprites, Geo- phys. Res. Lett.,32, L04812, doi:10.1029/2004GL021943.
Pasko, V. (2006), Theoretical modeling of sprites and jets, inSprites, Elves and Intense Lightning Discharges,NATO Sci. Ser., Ser. II, vol. 225, edited by M. Fu¨llekrug, E. A. Mareev, and M. J. Rycroft, pp. 253 – 311, Springer, Dordrecht, Netherlands.
Pasko, V. P., U. S. Inan, Y. N. Taranenko, and T. F. Bell (1995), Heating, ionization and upward discharges in the mesosphere due to intense quasi- electrostatic thundercloud field,Geophys. Res. Lett.,22, 365 – 368.
Pasko, V. P., U. S. Inan, T. F. Bell, and Y. N. Tarenenko (1997a), Sprites produced by quasi-electrostatic heating and ionization in the lower iono- sphere,J. Geophys. Res.,102, 4529 – 4561.
Pasko, V. P., U. S. Inan, and T. F. Bell (1997b), Sprites as evidence of vertical gravity wave structures above mesoscale thunderstorms, Geo- phys. Res. Lett.,24, 1735 – 1738.
Raizer, Y. P. (1991),Gas Discharge Physics, 449 pp., Springer, Berlin.
Rakov, V. A., and M. A. Uman (2003),Lightning: Physics and Effects, 687 pp., Cambridge Univ. Press, Cambridge, U.K.
Rodger, C. J. (1999), Red sprites, upward lightning, and VLF perturbations, Rev. Geophys.,37, 317 – 336.
Sentman, D. D., and E. M. Wescott (1995), Red sprites and blue jets:
Thunderstorm-excited optical emissions in the stratosphere, mesosphere, and ionosphere,Phys. Plasmas,2, 2514 – 2522.
Society of Atmospheric Electricity of Japan (2003),Atmospheric Electri- city, 237 pp., Corona, Tokyo.
Suzuki, T., M. Hayakawa, Y. Matsudo, and K. Michimoto (2006), How do winter thundercloud systems generate sprite-inducing lightning in the Hokuriku area of Japan?, Geophys. Res. Lett., 33, L10806, doi:10.1029/2005GL025433.
Takagi, M. (1961), The mechanism of discharges in a thundercloud,Proc.
Res. Inst. Atmos. Nagoya Univ.,8B, 1 – 106.
Valdivia, J. A., G. Milikh, and K. Papadopoulos (1997), Red sprites: Light- ning as a fractal antenna,Geophys. Res. Lett.,24, 3169 – 3172.
van der Velde, O. A., A´ . Mika, S. Soula, C. Haldoupis, T. Neubert, and U. S. Inan (2006), Observations of the relationship between sprite mor- phology and in-cloud lightning processes, J. Geophys. Res., 111, D15203, doi:10.1029/2005JD006879.
Wescott, E. M., D. D. Sentman, M. J. Heavner, D. L. Hampton, W. A.
Lyons, and T. Nelson (1998), Observations of columniform sprites, J. Atmos. Sol. Terr. Phys.,60, 733 – 740.
Williams, E., and Y. Yair (2006), The microphysical and electrical proper- ties of sprite-producing thunderstorms, inSprites, Elves and Intense light- ning Discharges, NATO Sci. Ser., Ser. II, vol. 225, edited by M.
Fu¨llekrug, E. A. Mareev, and M. J. Rycroft, pp. 57 – 83, Springer, Dor- drecht, Netherlands.
Williams, E. R. (2006), Problems in lightning physics—the role of polarity asymmetry,Plasma Sources Sci. Technol.,15, S91 – S108.
Williams, E., E. Downes, R. Boldi, W. Lyons, and S. Heckman (2007), Polarity asymmetry of sprite-producing lightning: A paradox?,Radio Sci.,42, RS2S17, doi:10.1029/2006RS003488.
T. Asano and M. Hayakawa, Department of Electronic Engineering, University of Electro-Communications, 1-5-1 Chofugaoka, Chofu Tokyo 182-8555, Japan. ([email protected])
M. Cho, Kyusyu Institute of Technology, Tobata-ku, Kitakyushu 804, Japan.
T. Suzuki, Air Weather Group, Japan Air Self-Defense, Fuchu Tokyo 183-0001, Japan.